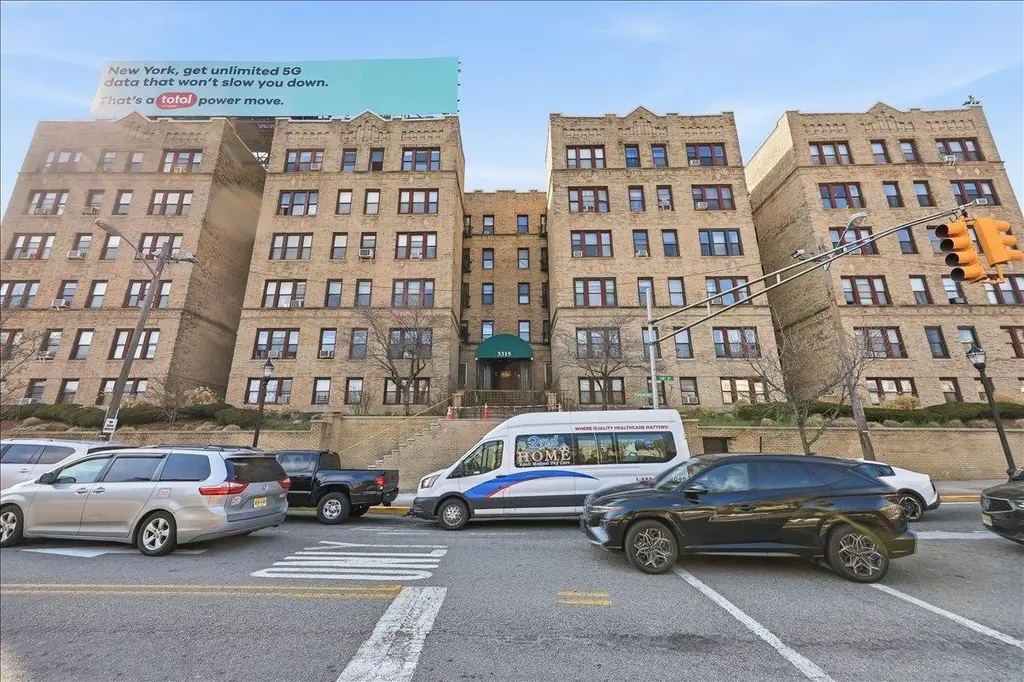
3315 PLEASANT Ave #8 · Union City, NJ
Flood risk 1/10 · Minimal
- FEMA flood zone
- X (unshaded)
- Chance of flooding over 30 yrs
- 0.0%
- Est. flood insurance / yr
- $507 – $1,088
Fire risk 1/10 · Minimal
- Est. fire insurance / yr
- $526 – $976
Heat risk 7/10 · Major
- Hot days now (above 98°F)
- 7 days/yr
- Hot days in 30 yrs
- 15 days/yr
Wind risk 6/10 · Moderate
- Chance of severe wind over 30 yrs
- 27.0%
Air-quality risk 4/10 · Minor
- Unhealthy air days now
- 5 days/yr
- Unhealthy air days in 30 yrs
- 6 days/yr
Risk factors via First Street. Map © Google.
Why this score? — see what drove the C- grade
The composite is a weighted blend of 9 inputs, each scored 0–100. Each bar is that input's sub-score; the figure is the points it added to the 100-point composite (weight × sub-score).
- ARV discount +15.0/15.0
- Appreciation +10.0/10.0
- Cash flow +9.0/30.0
- 1% rule +4.9/10.0
- Livability +3.9/5.0
- Rent growth +2.7/5.0
- DSCR +2.5/10.0
- Condition / age +2.5/5.0
- Schools +2.2/10.0
$215,000
🖨 Deal sheet 📄 Offer letter ✓ Due diligence
Listing remarks MLS
This WELL LAID OUT 1 BEDROOM CONDO at Harborview is located just 10 minutes to NYC! Updated kitchen includes dishwasher, breakfast bar, track-lighting. Hardwood floors throughout, and ample closet space. Building includes elevator, laundry room, keypad entry, heat/hot water included in maintenance with FULL TIME SUPER! CLOSE TO NYC TRANSPORTATION, SHOPPING, and minutes to the waterfront, dining and nightlife.
Key facts
- Spacious kitchen
- Ample closet space
- Elevator
Tags
Neighborhood map
What this means for you Summary
Snapshot
- This is a 1-bed/1.0-bath condo listed at $215k.
Deal economics
- At list price, monthly cash flow is $-170 ($-2k/yr) — negative.
- To cash-flow at today's rent, offer at most $185k (14.0% below list).
- To meet the 1% rule (rent ≥ 1% of price), the offer needs to be $213k (0.8% below list).
- Recommended offer: $185k (14.0% below list) — sets the bar for cash-flow.
- Cap rate 5.3% vs local median 2.3% in Union City — top-decile yield for the area; either an underpriced asset or a hidden risk that comps aren't pricing in. Stress-test before assuming the spread holds.
Location & tenants
- Location reads 77/100 on livability (#117 in NJ, #2,998 nationally) — a middle-class / working-renter tenant base. Strengths: amenities A+, commute A+, health & safety A; Watch: cost of living F.
- Union City School District (suburban): math 15% / reading 36% proficiency, ranked #399 of 472 in NJ (top 84%) — low school quality limits family demand, transient renter base, plan for 1-2y turnover; 85% free/reduced lunch — lower-income household profile, screen leases tightly.
- Market conditions: Rents flat; 226 active listings in the ZIP; 5 comparable units currently listed for rent nearby; rentals leasing fast (median 13d on market — plan ~1-2 weeks tenant-placement turnaround); 5,310 units permitted in Hudson County in 2024 (4,154 in 5+ unit buildings).
- This rent runs 40% of the median local income ($64k/yr) — at the standard rent-burdened threshold; future hikes will face affordability resistance.
Forward outlook
- In year one you build about $23k of equity ($1k loan paydown + $22k appreciation (10.0% local appreciation)).
- Hudson County population projected at +29% by 2050 — long-run rental-demand tailwind backs the buy-and-hold thesis.
- By year 2, paydown + projected appreciation supports a ~$37k cash-out refi (75% LTV) — recoverable capital for the next deal without selling this one.
Negotiation context
- It's been on market 80 days — a 6% lower offer ($202k) is reasonable based on typical stale-listing flexibility.
- 5 sale attempts since 23y ago; this cycle's ask has dropped $35k (14%) from the opening price — seller is motivated, your offer sets the floor, not the list.
- Current owner paid $117k; list at $215k implies a 84% gain — meaningful room to come down on a strong offer.
Risks & watch-outs
- Watch-outs: built in 1930 — expect roof / HVAC / electrical / plumbing capex.
- Climate carrying-cost: major wind risk, 27% chance of damaging wind over 30y; extreme-heat days projected 7→15/yr by 2055 (HVAC capex compounding) — expect insurance premiums to compound above CPI over the hold.
Questions for the listing agent
- What do current leases actually rent for vs. the listed asking? Can we see a recent rent roll and the last 12 months of T-12 income?
- It's been on market 80 days. Have you received any prior offers? Is the seller open to a 14% concession, seller financing, or rate buy-down credit?
- Built in 1930 — when were the roof, HVAC, electrical panel, plumbing, and water heater last replaced?
- What does the HOA fee cover, when was the last increase, and are there any pending special assessments or reserve-fund shortfalls?
- Any open or pending special assessments — roof, HVAC, plumbing, elevator, façade? What's the per-unit balance and payoff schedule, and is the seller paying it off at close or rolling it to the buyer?
- Why hasn't it sold? Are there any deal-killer items the seller is aware of (foundation, flood, title, zoning, code violations)?
- Is there a deadline driving the sale (1031 exchange, divorce, estate, relocation)? That informs how much negotiation room exists.
- What's the average days-on-market for RENTAL listings here right now (not sales)? A rising rental-DOM trend means longer vacancies and softer asking-rent achievability than the comps imply.
- What's the recent tenant-quality profile in this submarket — average credit score on applications, eviction rate, late-payment / NSF rate, and stable-employment percentage? A property-management company in the area should have these aggregated.
- How much new apartment / multifamily construction is in the pipeline within 1–3 miles? Heavy new supply (>2% of stock underway) typically softens rents 12–24 months out; light construction supports rent growth.
Investment metrics
- 1% rule
- 0.99% ✗
- Cap rate
- 5.35%
- Cash-on-cash
- -3.38%
- DSCR
- 0.85
- GRM
- 8.4
CMA / ARV
- ARV (median comp)
- $275,926
- List price
- $215,000
- Delta
- -22.08%
- Verdict
- UNDERPRICED
- Comps
- 20 within 1.0 mi
Projected returns pro-forma
10.0% appreciation · 0.89% rent growth · sell at horizon
- IRR
- 21.1%
- Equity multiple
- 2.70×
- Total profit
- $102,106
- Equity at exit
- $193,689
- IRR
- 18.6%
- Equity multiple
- 6.01×
- Total profit
- $301,460
- Equity at exit
- $417,698
Cash invested: $60,200 (down + closing). Projections, not guarantees.
Landlord ↔ Tenant lean methodology
- Overall (STATE)
- 21 Tenant-Leaning
- State New Jersey
- 21 Tenant-Leaning · D+6
- County
- — inherits STATE
- City
- — inherits STATE
ZIP-level market 07087
- Home prices YoY
- 9.6%
- Rents YoY
- 0.9%
- Active inventory
- 226
- Price-to-rent
- 8.4×
Monthly cashflow live
- Estimated rent
- $2,132 medium interval (Pro) →
- Mortgage (P&I)
- −$1,127
- Tax from tax record
- −$335 /mo · $4,019/yr
- Insurance
- −$90
- HOA
- −$302
- Vacancy / Maint / Mgmt
- −$448
- Net cashflow
- $-170
Break-even live
UW: 25.0% down · 7.5% · 30yr · 1.5% tax · 5.0% vac · 8.0% maint · 8.0% mgmt
Financing live
Cash to close
- Down payment
- $53,750
- Closing costs
- $6,450
- Reserves months
- —
- Total cash needed
- —
Loan-product check · same deal, 3 products live
Conventional
25% down · 7.5% · 30yr
- Down + closing
- —
- Monthly P&I
- —
- Monthly cashflow
- —
- DSCR
- —
- Eligible?
- —
Personal DTI + credit; lowest rate.
DSCR
20% down · 8.5% · 30yr
- Down + closing
- —
- Monthly P&I
- —
- Monthly cashflow
- —
- DSCR
- —
- Eligible?
- —
No personal income docs; deal must DSCR.
Hard money
10% down · 12.0% · 12mo
- Down + closing
- —
- Monthly P&I
- —
- Monthly cashflow
- —
- DSCR
- —
- Eligible?
- —
Short-term bridge; refi at stabilization.
Rent comps 5 comps
| Address | Beds | Baths | Sqft | Rent | $/sqft | DOM | Units | Dist |
|---|---|---|---|---|---|---|---|---|
| 213 48th St Unit 4A Union City, NJ | 1.0 | 1.0 | 360 | $1,825 | $5.07 | 43d | 1 | 0.75mi |
| 510 10th St Unit Ground 1 Union City, NJ | — | 1.0 | 360 | $1,700 | $4.72 | 13d | 1 | 1.11mi |
| 1217 Washington St Hoboken, NJ | 3.0 | 1.0 | 547 | $3,033 | $5.55 | 4d | 3 | 1.25mi |
| 9 Ave At Port Imperial West New York, NJ | 1.0–2.0 | 1.0–2.0 | 794 | $2,570 | $3.24 | 7d | 4 | 1.37mi |
| 1 Plaza Dr Secaucus, NJ | — | 1.0 | 300 | $3,089 | $10.30 | 24d | 1 | 1.41mi |
HOA detail condo
- Monthly dues
- $302 · $3,624/yr
- Likely covers
- water
- Assessments
- None detected in remarks — confirm with the listing agent.
Listing history 28 events
-
2026-06-18days on market $215,000 Active 80 DOM
-
2026-06-17days on market $215,000 Active 79 DOM
-
2026-06-16days on market $215,000 Active 78 DOM
-
2026-06-15days on market $215,000 Active 77 DOM
-
2026-06-13days on market $215,000 Active 75 DOM
-
2026-06-13pricedays on market $215,000 Active 74 DOM
-
2026-06-09days on market $237,000 Active 71 DOM
-
2026-06-08days on market $237,000 Active 70 DOM
-
2026-06-07days on market $237,000 Active 69 DOM
-
2026-06-04days on market $237,000 Active 66 DOM
-
2026-06-03days on market $237,000 Active 65 DOM
-
2026-06-02days on market $237,000 Active 64 DOM
-
2026-06-01days on market $237,000 Active 63 DOM
-
2026-05-31days on market $237,000 Active 62 DOM
-
2026-04-30price $237,000 429-char remark
Show marketing remark (429 chars)
This WELL LAID OUT 1 BEDROOM CONDO at Harborview is located just 10 minutes to NYC! Updated kitchen includes dishwasher, breakfast bar, track-lighting. Hardwood floors throughout, and ample closet space. Building includes elevator, laundry room, keypad entry, heat/hot water included in maintenance with FULL TIME SUPER! CLOSE TO NYC TRANSPORTATION, SHOPPING, and minutes to the waterfront, dining and nightlife.
-
2026-03-30$249,995 Active 429-char remark
Show marketing remark (429 chars)
This WELL LAID OUT 1 BEDROOM CONDO at Harborview is located just 10 minutes to NYC! Updated kitchen includes dishwasher, breakfast bar, track-lighting. Hardwood floors throughout, and ample closet space. Building includes elevator, laundry room, keypad entry, heat/hot water included in maintenance with FULL TIME SUPER! CLOSE TO NYC TRANSPORTATION, SHOPPING, and minutes to the waterfront, dining and nightlife.
-
2021-11-29historical
-
2021-10-20$199,000 Active
-
2004-07-19soldstatus $116,900
-
2004-06-29soldstatus $116,900
-
2004-06-29soldstatus $116,900
-
2004-05-28historical
-
2004-05-20$115,150
-
2004-05-12historical
-
2004-03-12historical
-
2004-02-02$110,450
-
2003-10-22$105,750
-
1998-11-16soldstatus $450,000
ⓘ Source: listings_history table (triggers on properties + properties_extension) + one-shot
backfill from property_details.listing_events for pre-trigger history.
Tax reassessment forecast NJ · Partial reset (capped growth)
- Current annual tax
- $4,019 · $335/mo
- Projected year-2 tax
- $4,686 · $391/mo
- Expected delta
- +$667/yr (+$56/mo · 16.6%)
ⓘ Screening estimate from a state-policy table — verify with the county assessor before closing.
Climate risk First Street
- Flood 1/10 Low FEMA zone X (unshaded) · 0% chance over 30 yrs
- Wildfire 1/10 Low
- Heat 7/10 Severe 7 d/yr ≥98°F today · 15 d/yr by 30 yrs out
- Wind 6/10 Major 27% chance of damaging wind over 30 yrs
- Air quality 4/10 Moderate 5 unhealthy d/yr today · 6 by 30 yrs out
Nearby sold comps map
Loading sold comps map…
Walkable amenities ~0.75 mi
Loading nearby amenities…
Taxation est. · year 1
- Rental income
- $25,583
- − Mortgage interest
- −$12,043
- − Property taxes
- −$4,019
- − Insurance
- −$1,075
- − Repairs & maintenance
- −$2,047
- − Management
- −$2,047
- − HOA
- −$3,624
- − Depreciation
- −$6,255
- Taxable loss
- −$5,527
- Est. tax savings @ 24.0%
- +$1,326
- After-tax cash flow
- $-711/yr
For passive investors: Depreciation is non-cash, so a rental often shows a tax loss while cash-flowing — sheltering income. Rental losses are passive: they offset passive income freely, and up to $25,000/yr can offset ordinary (W-2) income if you actively participate and your MAGI is under $100k (phasing out to $0 by $150k); unused losses carry forward. On sale, claimed depreciation is recaptured at up to 25%, and gains may owe capital-gains tax (a 1031 exchange can defer both). Figures are a year-1 estimate at your 24.0% rate — not tax advice; consult a CPA.
Schools (NCES district)
- District
- Union City School District
- NCES district ID
- 3416380
- Math proficiency
- 15% ▼ -19.00%
- Reading proficiency
- 36% ▼ -19.00%
- Median HH income
- $41,210
- Composite
- 21.55/100
- National rank
- #8312
- State rank
- #399 of 472 in NJ
Livability — Union City
- Score
- 77/100
- State rank
- #117
- US rank
- #2998
Category grades
Schools grade is shown separately in the Schools card above.
Census & demographics
- Census place
- Union City, NJ
- County
- Hudson County · 718,323 people
- City population
- 66,463
- Metro
- New York-Newark-Jersey City, NY-NJ-PA
- Population (ZIP)
- 66,463
- Household income
- $64,310
- Rent vs Own
- Severe rent burden
- 6042.0
Population outlook (Hudson County) Hauer SSP2
- Today (2025)
- 771,834 people
- By 2030
- 818,028 · +6.0%
- By 2040
- 907,866 · +17.6%
- By 2050
- 994,480 · +28.8%
- By 2075
- 1,163,301 · +50.7%
- By 2100
- 1,254,703 · +62.6%
Race, ethnicity, and origin ACS 2023
- Neighborhood character
- Predominantly Hispanic (82%)
- Race & ethnicity
- Hispanic / Latino 82% Two or more races 28% White 10% Asian 4% Black 3% Native American 2%
- Hispanic origin (detail)
- Mexican 7% Puerto Rican 8% Cuban 9% Dominican 17%
- Foreign-born
- 55% · Canada, Jamaica, China
- Languages at home
- 18% English-only · Spanish 74% Other Indo-European 2% Arabic 1%
Political lean MEDSL · Hudson
- 2024 margin
- Strong D (+28.1) · D 62.6% · R 34.6% · Other 2.8%
- 2008→2024 swing
- -18.7pp toward R · 2008: 46.7pp · 2024: 28.1pp
- All cycles
- 2024: D+28.1 2020: D+46.2 2016: D+51.8 2012: D+55.7 2008: D+46.7
Not yet ingested
- Civics
- —
Market trends
- HPI YoY
- ▲ 52.10%
- Current HPI
- 597.8126
- Rent YoY
- ▲ 0.89%
- Metro
- New York-Newark-Jersey City, NY-NJ-PA
- State GDP YoY
- ▲ 2.05%
- F500 in state
- 34
Industry mix (Fortune 500 HQ in NJ)
| Industry | F500 HQs | Revenue |
|---|---|---|
| Consumer Goods | 3 | $31B |
|
||
| Pharmaceuticals | 2 | $153B |
|
||
| Technology | 2 | $21B |
|
||
| Insurance | 2 | $20B |
|
||
| Healthcare | 2 | $19B |
|
||
| Financial Services | 1 | $70B |
|
||
Price history
-47.3% since first listed14 events — show timeline
- 2026-04-30 Price Changed $237,000 HCMLS
- 2026-03-30 Listed $249,995 HCMLS
- 2021-11-29 Listing Removed — HCMLS
- 2021-10-20 Listed $199,000 HCMLS
- 2004-07-19 Sold (Public Records) $116,900 Public Records
- 2004-06-29 Sold (Public Records) $116,900 Public Records
- 2004-06-29 Sold (MLS) $116,900 HCMLS
- 2004-05-28 Listing Removed — HCMLS
- 2004-05-20 Listed $115,150 HCMLS
- 2004-05-12 Listing Removed — HCMLS
- 2004-03-12 Listing Removed — HCMLS
- 2004-02-02 Listed $110,450 HCMLS
- 2003-10-22 Listed $105,750 HCMLS
- 1998-11-16 Sold (Public Records) $450,000 Public Records
Property tax history
+1.8%/yrLatest (2025): $4,019 · +21.2% YoY. Source: county tax records.
Cash-flow waterfall
monthlySold comps — $/sqft
last 12 mo · ≤1 miLoading sold comps…