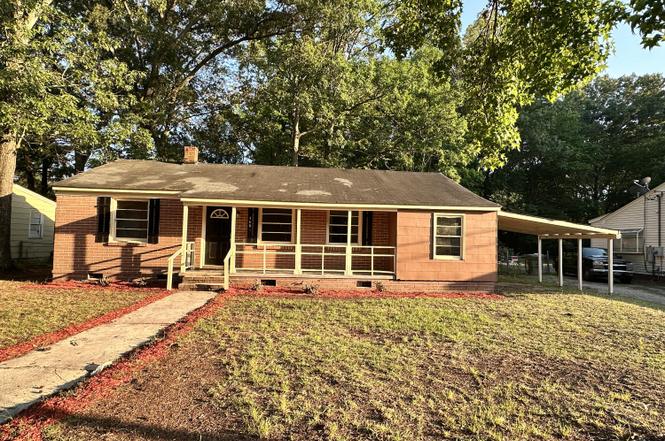
468 Loring Dr · Sumter, SC
Flood risk 4/10 · Minor
- FEMA flood zone
- AE
- Chance of flooding over 30 yrs
- 0.22%
- Est. flood insurance / yr
- $1,737 – $8,500
Fire risk 3/10 · Minor
- Est. fire insurance / yr
- $783 – $1,453
Heat risk 6/10 · Moderate
- Hot days now (above 108°F)
- 7 days/yr
- Hot days in 30 yrs
- 16 days/yr
Wind risk 8/10 · Major
- Chance of severe wind over 30 yrs
- 80.0%
Air-quality risk 2/10 · Minimal
- Unhealthy air days now
- 2 days/yr
- Unhealthy air days in 30 yrs
- 2 days/yr
Risk factors via First Street. Map © Google.
Why this score? — see what drove the C grade
The composite is a weighted blend of 9 inputs, each scored 0–100. Each bar is that input's sub-score; the figure is the points it added to the 100-point composite (weight × sub-score).
- Cash flow +26.1/30.0
- DSCR +8.8/10.0
- 1% rule +5.9/10.0
- ARV discount +4.1/15.0
- Rent growth +3.1/5.0
- Livability +3.0/5.0
- Condition / age +2.5/5.0
- Schools +1.9/10.0
- Appreciation +0.0/10.0
$135,000
🖨 Deal sheet (PDF) 📄 Offer letter ✓ Due diligence
Listing remarks
This home has been renovated with an owner's suite with a half bath and closet. Renovation are moving along nicely . 4 bedrooms / 1.5 baths; new hot water heater; new electric heater pump to be installed before closing. Split-bedroom floor plan with a separate laundry room. Fenced back yard and carport. Contact listing agent about appliances.
Key facts
- Half bath
- New hot water heater
- Owner's suite
Tags
Property features AI
Finance
- HOA & community: Sidewalks in the community
Exterior
- Parking: Attached carport; 1 carport space
- Utilities: Public water; Public sewer; Electricity available
- Home design: Single-family residence; One story; Brick veneer and HardiPlank-type exterior
- Construction: House structure
- Exterior features: Covered porch/patio; Chain link fencing; Shingle roof; Paved road access; Public maintained road
Interior
- Kitchen: No appliances included
- Bedrooms: 6 total rooms (bedroom count not specified)
- Flooring: Hardwood flooring; Laminate flooring
- Bathrooms: 1 full bathroom; 1 half bathroom
- Heating & cooling: Heat pump heating; Heat pump cooling
- Interior features: Walk-in closets; Crawl space basement
- Laundry & utility: Washer hookup; Electric dryer hookup
Neighborhood map
What this means for you Summary
Snapshot
- This is a 3-bed/1.5-bath single-family listed at $135k.
Deal economics
- At list price, monthly cash flow is $-87 ($-1k/yr) — negative.
- To cash-flow at today's rent, offer at most $120k (11.4% below list).
- Meets the 1% rule at list price ($1k rent vs $135k).
- Recommended offer: $119k (12.0% below list) — sets the bar for market timing.
- Cap rate 9.3% vs local median 3.4% in Sumter — top-decile yield for the area; either an underpriced asset or a hidden risk that comps aren't pricing in. Stress-test before assuming the spread holds.
Location & tenants
- Location reads 59/100 on livability (#235 in SC) — a working-class tenant base; expect higher turnover. Strengths: cost of living A+, health & safety A+, housing A-; Watch: crime F, amenities F, commute F.
- Sumter 01 (urban): math 18% / reading 28% proficiency, ranked #64 of 80 in SC (top 80%) — low school quality limits family demand, transient renter base, plan for 1-2y turnover; 64% free/reduced lunch — lower-income household profile, screen leases tightly.
- Zoned schools: Crosswell Drive Elementary (math 8% / reading 12%, grade F, #587 of 597 statewide, top 99%, 460 students, 100% FRL); Chestnut Oaks Middle (math 3% / reading 17%, grade F, #221 of 229 statewide, top 97%, 396 students, 100% FRL); Sumter High School (math 22% / reading 67%, grade F, #166 of 196 statewide, top 87%, 2,289 students, 100% FRL) — zoned schools average 100% FRL vs 64% district-wide (36 pts higher); higher-poverty schools than district average — tighter screening recommended.
- Market conditions: Rents rising (+2.5%/yr); 384 active listings in the ZIP; 386 units permitted in Sumter County in 2024 (0 in 5+ unit buildings).
- This rent runs 35% of the median local income ($51k/yr) — at the standard rent-burdened threshold; future hikes will face affordability resistance.
Forward outlook
- Local home prices are declining (-3.0%/yr); year-one equity from $933 of loan paydown is wiped out by about $4k of value loss. Plan a longer hold.
- Sumter County population projected at -14% by 2050 — secular population decline; favor cash flow + early exit over multi-decade hold.
Negotiation context
- It's been on market 122 days — a 12% lower offer ($119k) is reasonable based on typical stale-listing flexibility.
Risks & watch-outs
- Watch-outs: flood insurance adds $427/mo; built in 1955 — expect roof / HVAC / electrical / plumbing capex.
- Climate carrying-cost: in FEMA flood zone AE (mandatory federal flood insurance); severe wind risk, 80% chance of damaging wind over 30y; extreme-heat days projected 7→16/yr by 2055 (HVAC capex compounding) — expect insurance premiums to compound above CPI over the hold.
Questions for the listing agent
- What do current leases actually rent for vs. the listed asking? Can we see a recent rent roll and the last 12 months of T-12 income?
- It's been on market 122 days. Have you received any prior offers? Is the seller open to a 12% concession, seller financing, or rate buy-down credit?
- Built in 1955 — when were the roof, HVAC, electrical panel, plumbing, and water heater last replaced?
- What's the actual annual flood-insurance premium (NFIP or private), and is the property in a SFHA with mandatory coverage?
- Why hasn't it sold? Are there any deal-killer items the seller is aware of (foundation, flood, title, zoning, code violations)?
- Is there a deadline driving the sale (1031 exchange, divorce, estate, relocation)? That informs how much negotiation room exists.
- Schools are D-rated, which usually means shorter tenancies and higher turnover. Who's the typical renter profile here, and what's been the actual vacancy rate?
- Crime grade is F in this area — have there been break-ins, vandalism, or insurance claims at this property in the last 3 years? What carrier currently insures it and at what premium?
- What's the average days-on-market for RENTAL listings here right now (not sales)? A rising rental-DOM trend means longer vacancies and softer asking-rent achievability than the comps imply.
- What's the recent tenant-quality profile in this submarket — average credit score on applications, eviction rate, late-payment / NSF rate, and stable-employment percentage? A property-management company in the area should have these aggregated.
- How much new for-sale + rental construction is in the pipeline within 1–3 miles? Heavy new supply typically softens prices + rents 12–24 months out; constrained supply supports both.
Investment metrics
- 1% rule
- 1.09% ✓
- Cap rate
- 9.31%
- Cash-on-cash
- 10.77%
- DSCR
- 1.48
- GRM
- 7.6
CMA / ARV
- ARV (on-the-fly)
- $125,400
- Comps found
- 12
Show comp detail 12 sales within ~0.75 mi
| Address | Dist | Beds/Ba | Sqft | Sold | Price | $/sf | Match |
|---|---|---|---|---|---|---|---|
| 606 E Charlotte Ave | 0.34mi | 3/1.0 | 1,250 (-0%) | 11mo | $109,000 | $87 | 72 |
| 401 Bagnal Dr | 0.27mi | 3/1.0 | 1,237 (-1%) | 15mo | $82,680 | $67 | 70 |
| 107 Emily Dr | 0.33mi | 3/1.0 | 1,237 (-1%) | 15mo | $79,500 | $64 | 67 |
| 6 Emily Dr | 0.21mi | 3/1.0 | 1,145 (-9%) | 9mo | $70,000 | $61 | 66 |
| 526 E Charlotte Ave | 0.32mi | 3/1.0 | 1,198 (-4%) | 13mo | $160,000 | $134 | 65 |
| 609 E Charlotte Ave | 0.38mi | 3/1.0 | 1,203 (-4%) | 11mo | $144,000 | $120 | 65 |
| 735 E Charlotte Ave | 0.41mi | 3/1.0 | 1,076 (-14%) | 2mo | $149,900 | $139 | 54 |
| 16 Wilson St | 0.72mi | 3/1.0 | 1,310 (+4%) | 6mo | $49,000 | $37 | 52 |
| 727 Wen Le Dr | 0.45mi | 3/1.5 | 1,098 (-12%) | 10mo | $110,000 | $100 | 50 |
| 105 S Magnolia St | 0.68mi | 3/2.0 | 1,193 (-5%) | 15mo | $156,000 | $131 | 45 |
| 110 Phifer St | 0.71mi | 3/1.5 | 1,427 (+14%) | 2mo | $140,000 | $98 | 43 |
| 167 Poinsett Dr | 0.63mi | 3/1.0 | 1,070 (-15%) | 8mo | $153,000 | $143 | 38 |
Match score weights: distance 35% · size 25% · config 20% · recency 20%. Top-matched comps best support the ARV.
Projected returns pro-forma
-3.0% appreciation · 2.55% rent growth · sell at horizon
- IRR
- -21.4%
- Equity multiple
- 0.26×
- Total profit
- $-27,876
- Equity at exit
- $20,129
- IRR
- -16.0%
- Equity multiple
- 0.12×
- Total profit
- $-33,241
- Equity at exit
- $11,672
Cash invested: $37,800 (down + closing). Projections, not guarantees.
Landlord ↔ Tenant lean methodology
- Overall (STATE)
- 90 Strongly Landlord-Friendly
- State South Carolina
- 90 Strongly Landlord-Friendly · R+6
- County
- — inherits STATE
- City
- — inherits STATE
ZIP-level market 29150
- Rents YoY
- 2.5%
- Active inventory
- 384
- Price-to-rent
- 7.6×
Monthly cashflow live
- Estimated rent
- $1,477 medium interval (Pro) →
- Mortgage (P&I)
- −$708
- Tax from tax record
- −$63 /mo · $757/yr
- Insurance
- −$56
- Flood insurance flood zone
- −$427 /mo · $5,118/yr
- HOA
- −$0
- Vacancy / Maint / Mgmt
- −$310
- Net cashflow
- $-87
Break-even live
Sensitivity live
| Price | -10% $-11 | -5% $-49 | +0% $-87 | +5% $-125 | +10% $-164 |
|---|---|---|---|---|---|
| Rent | -10% $-204 | -5% $-146 | +0% $-87 | +5% $-29 | +10% $29 |
| Rate | -1.0pp $-19 | -0.5pp $-53 | base $-87 | +0.5pp $-122 | +1.0pp $-158 |
UW: 25.0% down · 7.5% · 30yr · 1.5% tax · 5.0% vac · 8.0% maint · 8.0% mgmt
Financing live
Cash to close
- Down payment
- $33,750
- Closing costs
- $4,050
- Reserves months
- —
- Total cash needed
- —
Loan-product check · same deal, 3 products live
Conventional
25% down · 7.5% · 30yr
- Down + closing
- —
- Monthly P&I
- —
- Monthly cashflow
- —
- DSCR
- —
- Eligible?
- —
Personal DTI + credit; lowest rate.
DSCR
20% down · 8.5% · 30yr
- Down + closing
- —
- Monthly P&I
- —
- Monthly cashflow
- —
- DSCR
- —
- Eligible?
- —
No personal income docs; deal must DSCR.
Hard money
10% down · 12.0% · 12mo
- Down + closing
- —
- Monthly P&I
- —
- Monthly cashflow
- —
- DSCR
- —
- Eligible?
- —
Short-term bridge; refi at stabilization.
Listing history 17 events
-
2026-06-22days on market $135,000 Active 122 DOM
-
2026-06-19days on market $135,000 Active 120 DOM
-
2026-06-18days on market $135,000 Active 119 DOM
-
2026-06-17days on market $135,000 Active 118 DOM
-
2026-06-16days on market $135,000 Active 117 DOM
-
2026-06-15days on market $135,000 Active 116 DOM
-
2026-06-14days on market $135,000 Active 114 DOM
-
2026-06-13days on market $135,000 Active 113 DOM
-
2026-06-10days on market $135,000 Active 111 DOM
-
2026-06-09days on market $135,000 Active 110 DOM
-
2026-06-08days on market $135,000 Active 109 DOM
-
2026-06-07days on market $135,000 Active 108 DOM
-
2026-06-02days on market $135,000 Active 103 DOM
-
2026-06-01days on market $135,000 Active 102 DOM
-
2026-05-31days on market $135,000 Active 101 DOM
-
2026-05-30days on market $135,000 Active 100 DOM
-
2026-02-19$135,000 Active
ⓘ Source: listings_history table (triggers on properties + properties_extension) + one-shot
backfill from property_details.listing_events for pre-trigger history.
Tax reassessment forecast SC · Resets to sale price
- Current annual tax
- $757 · $63/mo
- Projected year-2 tax
- $770 · $64/mo
- Expected delta
- +$13/yr (+$1/mo · 1.7%)
ⓘ Screening estimate from a state-policy table — verify with the county assessor before closing.
Climate risk First Street
- Flood 4/10 Moderate FEMA zone AE · 22% chance over 30 yrs
- Wildfire 3/10 Moderate
- Heat 6/10 Major 7 d/yr ≥108°F today · 16 d/yr by 30 yrs out
- Wind 8/10 Severe 80% chance of damaging wind over 30 yrs
- Air quality 2/10 Low 2 unhealthy d/yr today · 2 by 30 yrs out
Nearby sold comps map
Loading sold comps map…
Walkable amenities ~0.75 mi
Loading nearby amenities…
Taxation est. · year 1
- Rental income
- $17,721
- − Mortgage interest
- −$7,562
- − Property taxes
- −$757
- − Insurance
- −$5,794
- − Repairs & maintenance
- −$1,418
- − Management
- −$1,418
- − Depreciation
- −$3,927
- Taxable loss
- −$3,154
- Est. tax savings @ 24.0%
- +$757
- After-tax cash flow
- $-289/yr
For passive investors: Depreciation is non-cash, so a rental often shows a tax loss while cash-flowing — sheltering income. Rental losses are passive: they offset passive income freely, and up to $25,000/yr can offset ordinary (W-2) income if you actively participate and your MAGI is under $100k (phasing out to $0 by $150k); unused losses carry forward. On sale, claimed depreciation is recaptured at up to 25%, and gains may owe capital-gains tax (a 1031 exchange can defer both). Figures are a year-1 estimate at your 24.0% rate — not tax advice; consult a CPA.
Schools (NCES district)
- District
- Sumter 01
- NCES district ID
- 4503902
- Math proficiency
- 18% ▼ -13.00%
- Reading proficiency
- 28% ▼ -6.00%
- Median HH income
- $40,423
- Composite
- 19.45/100
- National rank
- #8775
- State rank
- #64 of 80 in SC
Livability — Sumter
- Score
- 59/100
- State rank
- #235
- US rank
- #19754
Category grades
Schools grade is shown separately in the Schools card above.
Census & demographics
- Census place
- Sumter, SC
- County
- Sumter County · 76,912 people
- City population
- 67,992
- Metro
- Sumter, SC
- Population (ZIP)
- 38,538
- Household income
- $50,965
- Rent vs Own
- Severe rent burden
- 1136.0
Population outlook (Sumter County) Hauer SSP2
- Today (2025)
- 104,585 people
- By 2030
- 102,282 · -2.2%
- By 2040
- 96,258 · -8.0%
- By 2050
- 89,592 · -14.3%
- By 2075
- 74,715 · -28.6%
- By 2100
- 60,235 · -42.4%
Race, ethnicity, and origin ACS 2023
- Neighborhood character
- Diverse neighborhood (Simpson 0.60)
- Race & ethnicity
- Black 50% White 39% Hispanic / Latino 5% Two or more races 4% Asian 2%
- Hispanic origin (detail)
- Mexican 3% Puerto Rican 1%
- Common ancestry
- Slovak 2% Lithuanian 1% Italian 1%
- Foreign-born
- 4% · Canada, China, Vietnam
- Languages at home
- 93% English-only · Spanish 4% Other Indo-European 1% German/W. Germanic 1%
Political lean MEDSL · Sumter
- 2024 margin
- Toss-up / Even · D 51.9% · R 47.0% · Other 1.2%
- 2008→2024 swing
- -10.6pp toward R · 2008: 15.4pp · 2024: 4.9pp
- All cycles
- 2024: D+4.9 2020: D+13.0 2016: D+12.0 2012: D+17.5 2008: D+15.4
Not yet ingested
- Civics
- —
Market trends
- HPI YoY
- ▼ -100.16%
- Current HPI
- 129.032
- Rent YoY
- ▲ 2.55%
- Metro
- Sumter, SC
- State GDP YoY
- ▲ 4.51%
- F500 in state
- 2
Industry mix (Fortune 500 HQ in SC)
| Industry | F500 HQs | Revenue |
|---|---|---|
| Packaging | 1 | $7B |
|
||
Price history
1 event — show timeline
- 2026-02-19 Listed $135,000 SBOR
Property tax history
+0.8%/yrLatest (2025): $757 · +1.9% YoY. Source: county tax records.
Cash-flow waterfall
monthlySold comps — $/sqft
last 12 mo · ≤1 miLoading sold comps…