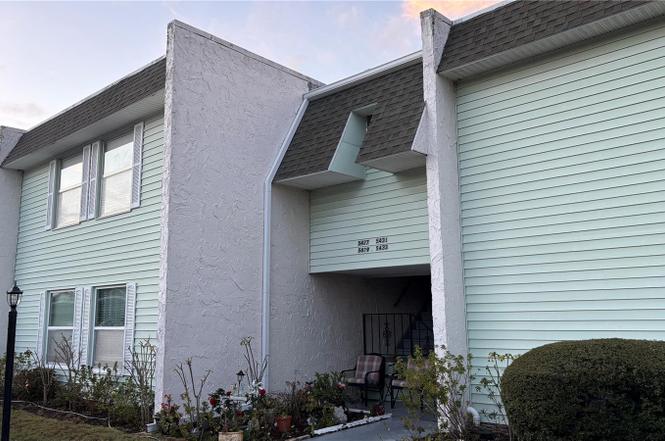
5433 Palm Dr · New Port Richey, FL
Flood risk 6/10 · Moderate
- FEMA flood zone
- X (shaded)
- Chance of flooding over 30 yrs
- 0.69%
- Est. flood insurance / yr
- $507 – $1,088
Fire risk 3/10 · Minor
- Est. fire insurance / yr
- $947 – $1,759
Heat risk 10/10 · Severe
- Hot days now (above 108°F)
- 7 days/yr
- Hot days in 30 yrs
- 28 days/yr
Wind risk 10/10 · Severe
- Chance of severe wind over 30 yrs
- 99.0%
Air-quality risk 2/10 · Minimal
- Unhealthy air days now
- 1 days/yr
- Unhealthy air days in 30 yrs
- 1 days/yr
Risk factors via First Street. Map © Google.
Why this score? — see what drove the C- grade
The composite is a weighted blend of 9 inputs, each scored 0–100. Each bar is that input's sub-score; the figure is the points it added to the 100-point composite (weight × sub-score).
- Cash flow +17.9/30.0
- 1% rule +8.5/10.0
- ARV discount +7.5/15.0
- DSCR +5.6/10.0
- Schools +4.3/10.0
- Livability +4.1/5.0
- Rent growth +2.7/5.0
- Condition / age +2.5/5.0
- Appreciation +0.0/10.0
$109,900
🖨 Deal sheet (PDF) 📄 Offer letter ✓ Due diligence
Listing remarks
Condo in Twin Lakes community in New Port Richey. 1 bed 1 bath with an open floor plan located in a well-maintained community. The community offers amenities, such as a clubhouse, community pool, & laundry room. Located near Downtown New Port Richey with plenty of shopping & dining options.
Key facts
- Open floor plan
- Clubhouse
- Community pool
Tags
Property features AI
Finance
- Other: Unit is unfurnished; Condo floor: 1; Homesteaded; Irrigation equipment present; Road surface: Asphalt
- Financial info: Total monthly fees $282; total annual fees $3,384; Lease restrictions apply
- HOA & community: HOA required; monthly association fee $282 (includes maintenance of structure, sewer, water); Association approval required; Association name: Greg Kessel; Community features: Clubhouse, Pool, Sidewalks, Deed restrictions, Buyer approval required; Senior community; Pets not allowed
Exterior
- Parking: Carport (1 space)
- Utilities: Public water; Public sewer; Cable available and connected; Electricity available and connected; Phone available; Underground utilities; Fire hydrant on site; Water available and connected; Sewer available and connected
- Home design: Condominium; Residential property; One story; Faces north; Entry on level one
- Construction: Block construction; Shake and shingle roof; Slab foundation; Building/complex identified as 5433
- Exterior features: Outdoor grill; Private mailbox; Sidewalk; Storage; Pond view (Twin Lake) with central fountain
Interior
- Kitchen: Built-in oven; Convection oven; Cooktop; Range; Range hood; Dishwasher; Refrigerator; Freezer; Exhaust fan
- Bedrooms: 1 bedroom (first floor)
- Flooring: Carpet
- Bathrooms: 1 full bathroom
- Heating & cooling: Central heating; Central air
- Interior features: Ceiling fans; Living room/dining room combo; Split bedroom layout; Thermostat; Walk-in closet(s); Aluminum frame windows with blinds
- Laundry & utility: Washer; Electric water heater; Laundry: Other
Neighborhood map
What this means for you Summary
Snapshot
- This is a 1-bed/1.0-bath condo listed at $110k.
Deal economics
- At list price, monthly cash flow is $92 ($1k/yr) — positive.
- The deal already cash-flows at list — no discount required.
- Meets the 1% rule at list price ($1k rent vs $110k).
- Recommended offer: $100k (9.0% below list) — sets the bar for market timing.
- Cap rate 7.3% vs local median 1.9% in New Port Richey — top-decile yield for the area; either an underpriced asset or a hidden risk that comps aren't pricing in. Stress-test before assuming the spread holds.
Location & tenants
- Location reads 82/100 on livability (#67 in FL, #1,139 nationally) — a professional / high-income tenant draw. Strengths: amenities A+, cost of living A+, housing A+; Watch: crime C-, commute D, employment F.
- Pasco (suburban): math 50% / reading 52% proficiency, ranked #32 of 73 in FL (top 44%) — acceptable for families but not a draw, mixed tenant base, ~2y average lease.
- Market conditions: Rents flat; 644 active listings in the ZIP; 40 comparable units currently listed for rent nearby; rentals at typical pace (median 25d on market — plan ~3-4 weeks tenant-placement turnaround); 6,765 units permitted in Pasco County in 2024 (1,250 in 5+ unit buildings).
- This rent runs 31% of the median local income ($57k/yr) — at the standard rent-burdened threshold; future hikes will face affordability resistance.
Forward outlook
- Local home prices are declining (-3.0%/yr); year-one equity from $760 of loan paydown is wiped out by about $3k of value loss. Plan a longer hold.
- Pasco County population projected at +29% by 2050 — long-run rental-demand tailwind backs the buy-and-hold thesis.
Negotiation context
- It's been on market 114 days — a 9% lower offer ($100k) is reasonable based on typical stale-listing flexibility.
- Current owner paid $85k; 29% above their basis — modest negotiation headroom, anchor on the comps not their cost.
Risks & watch-outs
- Climate carrying-cost: major flood risk; severe wind risk, 99% chance of damaging wind over 30y; extreme-heat days projected 7→28/yr by 2055 (HVAC capex compounding) — expect insurance premiums to compound above CPI over the hold.
Questions for the listing agent
- It's been on market 114 days. Have you received any prior offers? Is the seller open to a 9% concession, seller financing, or rate buy-down credit?
- Built in 1971 — when were the roof, HVAC, electrical panel, plumbing, and water heater last replaced?
- What does the HOA fee cover, when was the last increase, and are there any pending special assessments or reserve-fund shortfalls?
- Any open or pending special assessments — roof, HVAC, plumbing, elevator, façade? What's the per-unit balance and payoff schedule, and is the seller paying it off at close or rolling it to the buyer?
- Why hasn't it sold? Are there any deal-killer items the seller is aware of (foundation, flood, title, zoning, code violations)?
- Is there a deadline driving the sale (1031 exchange, divorce, estate, relocation)? That informs how much negotiation room exists.
- What's the average days-on-market for RENTAL listings here right now (not sales)? A rising rental-DOM trend means longer vacancies and softer asking-rent achievability than the comps imply.
- What's the recent tenant-quality profile in this submarket — average credit score on applications, eviction rate, late-payment / NSF rate, and stable-employment percentage? A property-management company in the area should have these aggregated.
- How much new apartment / multifamily construction is in the pipeline within 1–3 miles? Heavy new supply (>2% of stock underway) typically softens rents 12–24 months out; light construction supports rent growth.
Investment metrics
- 1% rule
- 1.35% ✓
- Cap rate
- 7.30%
- Cash-on-cash
- 3.58%
- DSCR
- 1.16
- GRM
- 6.2
CMA / ARV
No comps found within radius.
Projected returns pro-forma
-3.0% appreciation · 0.72% rent growth · sell at horizon
- IRR
- -14.1%
- Equity multiple
- 0.51×
- Total profit
- $-15,071
- Equity at exit
- $16,386
- IRR
- -11.1%
- Equity multiple
- 0.42×
- Total profit
- $-17,752
- Equity at exit
- $9,502
Cash invested: $30,772 (down + closing). Projections, not guarantees.
Landlord ↔ Tenant lean methodology
- Overall (STATE)
- 87 Strongly Landlord-Friendly
- State Florida
- 87 Strongly Landlord-Friendly · R+3
- County
- — inherits STATE
- City
- — inherits STATE
ZIP-level market 34652
- Home prices YoY
- -26.1%
- Rents YoY
- 0.7%
- Active inventory
- 644
- Price-to-rent
- 6.2×
Monthly cashflow live
- Estimated rent
- $1,484 high interval (Pro) →
- Mortgage (P&I)
- −$576
- Tax from tax record
- −$176 /mo · $2,117/yr
- Insurance
- −$46
- HOA
- −$282
- Vacancy / Maint / Mgmt
- −$312
- Net cashflow
- $92
Break-even live
Sensitivity live
| Price | -10% $154 | -5% $123 | +0% $92 | +5% $61 | +10% $30 |
|---|---|---|---|---|---|
| Rent | -10% $-25 | -5% $33 | +0% $92 | +5% $150 | +10% $209 |
| Rate | -1.0pp $147 | -0.5pp $120 | base $92 | +0.5pp $63 | +1.0pp $34 |
UW: 25.0% down · 7.5% · 30yr · 1.5% tax · 5.0% vac · 8.0% maint · 8.0% mgmt
Financing live
Cash to close
- Down payment
- $27,475
- Closing costs
- $3,297
- Reserves months
- —
- Total cash needed
- —
Loan-product check · same deal, 3 products live
Conventional
25% down · 7.5% · 30yr
- Down + closing
- —
- Monthly P&I
- —
- Monthly cashflow
- —
- DSCR
- —
- Eligible?
- —
Personal DTI + credit; lowest rate.
DSCR
20% down · 8.5% · 30yr
- Down + closing
- —
- Monthly P&I
- —
- Monthly cashflow
- —
- DSCR
- —
- Eligible?
- —
No personal income docs; deal must DSCR.
Hard money
10% down · 12.0% · 12mo
- Down + closing
- —
- Monthly P&I
- —
- Monthly cashflow
- —
- DSCR
- —
- Eligible?
- —
Short-term bridge; refi at stabilization.
Rent comps 40 comps
| Address | Beds | Baths | Sqft | Rent | $/sqft | DOM | Units | Dist |
|---|---|---|---|---|---|---|---|---|
| 5403 Tangerine Dr New Port Richey, FL | 2.0 | 1.0 | 962 | $1,750 | $1.82 | 0d | 1 | 0.11mi |
| 4938 Azalea Dr New Port Richey, FL | 2.0 | 1.0 | 870 | $2,000 | $2.30 | 25d | 1 | 0.15mi |
| 5333 Pasadena Dr Unit 5333 New Port Richey, FL | 1.0 | 1.0 | 576 | $1,200 | $2.08 | 18d | 1 | 0.17mi |
| 4746 Azalea Dr Apt 103C Port Richey, FL | 2.0 | 2.0 | 1008 | $1,220 | $1.21 | 25d | 1 | 0.19mi |
| 4744 Azalea Dr #204 New Port Richey, FL | 1.0 | 1.0 | 736 | $1,100 | $1.49 | 21d | 1 | 0.21mi |
| 5227 Tangerine Dr New Port Richey, FL | 2.0 | 1.5 | 996 | $1,500 | $1.51 | 13d | 1 | 0.22mi |
| 4529 Audrey Ln New Port Richey, FL | 2.0 | 1.0 | 750 | $1,295 | $1.73 | 22d | 1 | 0.45mi |
| 4540 Audrey Ln New Port Richey, FL | 2.0 | 1.0 | 750 | $1,150 | $1.53 | 25d | 1 | 0.45mi |
| 4551 Audrey Ln NEW PRT RCHY, FL | 2.0 | 1.0 | 750 | $1,295 | $1.73 | 22d | 1 | 0.45mi |
| 4518 Audrey Ln Unit 4551 New Port Richey, FL | 2.0 | 1.0 | 750 | $1,295 | $1.73 | 22d | 1 | 0.48mi |
| 4939 Floramar Ter New Port Richey, FL | 2.0 | 2.0 | 1050 | $1,675 | $1.60 | 25d | 2 | 0.52mi |
| 4939 Floramar Ter New Port Richey, FL | 2.0 | 2.0 | 1050 | $1,600 | $1.52 | 2d | 2 | 0.52mi |
| 4939 Floramar Ter New Port Richey, FL | 2.0 | 2.0 | 1050 | $1,648 | $1.57 | 17d | 3 | 0.52mi |
| 5543 Gulf Dr New Port Richey, FL | 2.0 | 1.0 | 744 | $1,550 | $2.08 | 17d | 1 | 0.57mi |
| 5154 Turquoise Ln #102 New Port Richey, FL | 1.0 | 1.0 | 708 | $1,250 | $1.77 | 6d | 1 | 0.57mi |
| 5197 Silent Loop #124 New Port Richey, FL | 2.0 | 2.0 | 956 | $2,200 | $2.30 | 25d | 1 | 0.58mi |
| 5197 Silent Loop New Port Richey, FL | 2.0 | 2.0 | 956 | $2,200 | $2.30 | 4d | 1 | 0.58mi |
| 5743 Elm St New Port Richey, FL | 2.0 | 1.0 | 756 | $1,200 | $1.59 | 6d | 1 | 0.59mi |
| 5529 La Salle Ct New Port Richey, FL | 2.0 | 1.0 | 850 | $1,300 | $1.53 | 11d | 1 | 0.60mi |
| 5132 Amulet Dr #107 New Port Richey, FL | 1.0 | 1.0 | 928 | $1,395 | $1.50 | 13d | 1 | 0.60mi |
| 4944 Elkner St New Port Richey, FL | 2.0 | 1.0 | 722 | $1,350 | $1.87 | 22d | 1 | 0.62mi |
| 5648 Townhouse Dr New Port Richey, FL | 2.0 | 1.5 | 900 | $1,495 | $1.66 | 25d | 1 | 0.62mi |
| 4901 Onyx Ln #102 New Port Richey, FL | 1.0 | 1.0 | 672 | $1,295 | $1.93 | 25d | 1 | 0.63mi |
| 4854 Marine Pkwy #103 New Port Richey, FL | 1.0 | 2.0 | 1088 | $1,500 | $1.38 | 25d | 1 | 0.63mi |
| 4948 Getner St New Port Richey, FL | 2.0 | 1.0 | 722 | $1,350 | $1.87 | 25d | 1 | 0.65mi |
| 4922 Filner St New Port Richey, FL | 1.0 | 1.0 | 540 | $1,000 | $1.85 | 22d | 1 | 0.67mi |
| 5511 Executive Dr Apt E1 New Port Richey, FL | 2.0 | 2.0 | 1000 | $1,459 | $1.46 | 25d | 1 | 0.70mi |
| 4754 Marine Pkwy Unit 102-I New Port Richey, FL | 2.0 | 2.0 | 1088 | $1,500 | $1.38 | 25d | 1 | 0.71mi |
| 5521 Executive Dr Unit D1 New Port Richey, FL | 2.0 | 2.0 | 1000 | $1,379 | $1.38 | 25d | 1 | 0.71mi |
| 4616 Irene Loop New Port Richey, FL | 2.0 | 1.0 | 898 | $1,600 | $1.78 | 21d | 1 | 0.74mi |
| 5543 Executive Dr Unit B4 New Port Richey, FL | 2.0 | 2.0 | 1000 | $1,459 | $1.46 | 25d | 1 | 0.75mi |
| 4753 Marine Pkwy Unit 4753 New Port Richey, FL | 2.0 | 2.0 | 1100 | $1,600 | $1.45 | 25d | 1 | 0.76mi |
| 5551 Executive Dr New Port Richey, FL | 2.0 | 2.0 | 1100 | $1,459 | $1.33 | 25d | 1 | 0.77mi |
| 4540 Irene Loop New Port Richey, FL | 2.0 | 1.0 | 768 | $1,550 | $2.02 | 25d | 1 | 0.79mi |
| 5640 Ferguson Ct #2101 New Port Richey, FL | 2.0 | 2.0 | 1056 | $1,650 | $1.56 | 25d | 1 | 0.81mi |
| 5809 Dailey Ln New Port Richey, FL | 2.0 | 1.0 | 950 | $1,000 | $1.05 | 25d | 1 | 0.82mi |
| 5020 Vickers Dr New Port Richey, FL | 2.0 | 1.0 | 863 | $1,495 | $1.73 | 0d | 1 | 0.90mi |
| 4852 Pompano Dr New Port Richey, FL | 2.0 | 2.0 | 1104 | $2,900 | $2.63 | 25d | 1 | 0.90mi |
| 5567 Sea Forest Dr New Port Richey, FL | 2.0–3.0 | 2.0–3.0 | 1335 | $1,795 | $1.34 | 13d | 2 | 0.92mi |
| 5741 Tennessee Ave New Port Richey, FL | 1.0 | 1.0 | 700 | $1,200 | $1.71 | 25d | 1 | 0.96mi |
HOA detail condo
- Monthly dues
- $282 · $3,384/yr
- Likely covers
- pool
- Assessments
- None detected in remarks — confirm with the listing agent.
Listing history 17 events
-
2026-06-18days on market $109,900 Active 114 DOM
-
2026-06-17days on market $109,900 Active 113 DOM
-
2026-06-16days on market $109,900 Active 112 DOM
-
2026-06-15days on market $109,900 Active 111 DOM
-
2026-06-13days on market $109,900 Active 109 DOM
-
2026-06-09days on market $109,900 Active 105 DOM
-
2026-06-08days on market $109,900 Active 104 DOM
-
2026-06-07days on market $109,900 Active 103 DOM
-
2026-06-04days on market $109,900 Active 100 DOM
-
2026-06-03days on market $109,900 Active 99 DOM
-
2026-06-02days on market $109,900 Active 98 DOM
-
2026-06-01days on market $109,900 Active 97 DOM
-
2026-05-31days on market $109,900 Active 96 DOM
-
2026-04-27price $109,900
-
2026-02-24$115,000 Active
-
2022-04-04soldstatus $85,000
-
2015-02-05soldstatus $24,000
ⓘ Source: listings_history table (triggers on properties + properties_extension) + one-shot
backfill from property_details.listing_events for pre-trigger history.
Tax reassessment forecast FL · Resets to sale price
- Current annual tax
- $2,117 · $176/mo
- Projected year-2 tax
- $2,117 · $176/mo
- Expected delta
- $0/yr ($0/mo · 0.0%)
ⓘ Screening estimate from a state-policy table — verify with the county assessor before closing.
Climate risk First Street
- Flood 6/10 Major FEMA zone X (shaded) · 69% chance over 30 yrs
- Wildfire 3/10 Moderate
- Heat 10/10 Extreme 7 d/yr ≥108°F today · 28 d/yr by 30 yrs out
- Wind 10/10 Extreme 99% chance of damaging wind over 30 yrs
- Air quality 2/10 Low 1 unhealthy d/yr today · 1 by 30 yrs out
Nearby sold comps map
Loading sold comps map…
Walkable amenities ~0.75 mi
Loading nearby amenities…
Taxation est. · year 1
- Rental income
- $17,807
- − Mortgage interest
- −$6,156
- − Property taxes
- −$2,117
- − Insurance
- −$550
- − Repairs & maintenance
- −$1,425
- − Management
- −$1,425
- − HOA
- −$3,384
- − Depreciation
- −$3,197
- Taxable loss
- −$445
- Est. tax savings @ 24.0%
- +$107
- After-tax cash flow
- $1,208/yr
For passive investors: Depreciation is non-cash, so a rental often shows a tax loss while cash-flowing — sheltering income. Rental losses are passive: they offset passive income freely, and up to $25,000/yr can offset ordinary (W-2) income if you actively participate and your MAGI is under $100k (phasing out to $0 by $150k); unused losses carry forward. On sale, claimed depreciation is recaptured at up to 25%, and gains may owe capital-gains tax (a 1031 exchange can defer both). Figures are a year-1 estimate at your 24.0% rate — not tax advice; consult a CPA.
Schools (NCES district)
- District
- Pasco
- NCES district ID
- 1201530
- Math proficiency
- 50% ▼ -10.00%
- Reading proficiency
- 52% ▼ -5.00%
- Median HH income
- $45,039
- Composite
- 43.14/100
- National rank
- #3074
- State rank
- #32 of 73 in FL
Livability — New Port Richey
- Score
- 82/100
- State rank
- #67
- US rank
- #1139
Category grades
Schools grade is shown separately in the Schools card above.
Census & demographics
- Census place
- New Port Richey, FL
- County
- Pasco County · 524,098 people
- City population
- 137,708
- Metro
- Tampa-St. Petersburg-Clearwater, FL
- Population (ZIP)
- 27,444
- Household income
- $56,931
- Rent vs Own
- Severe rent burden
- 1190.0
Population outlook (Pasco County) Hauer SSP2
- Today (2025)
- 570,045 people
- By 2030
- 605,844 · +6.3%
- By 2040
- 674,806 · +18.4%
- By 2050
- 736,022 · +29.1%
- By 2075
- 862,900 · +51.4%
- By 2100
- 906,364 · +59.0%
Race, ethnicity, and origin ACS 2023
- Neighborhood character
- Predominantly White (78%)
- Race & ethnicity
- White 78% Hispanic / Latino 13% Two or more races 9% Black 4%
- Hispanic origin (detail)
- Mexican 3% Puerto Rican 4% Cuban 4%
- Common ancestry
- Romanian 4% Lithuanian 3% Slovak 2%
- Foreign-born
- 9% · Canada
- Languages at home
- 87% English-only · Spanish 9% Other Indo-European 1% Russian/Polish/Slavic 1%
Political lean MEDSL · Pasco
- 2024 margin
- Strong R (+25.2) · D 36.9% · R 62.1% · Other 1.0%
- 2008→2024 swing
- -21.6pp toward R · 2008: -3.6pp · 2024: -25.2pp
- All cycles
- 2024: R+25.2 2020: R+20.1 2016: R+21.6 2012: R+6.7 2008: R+3.6
Not yet ingested
- Civics
- —
Market trends
- HPI YoY
- ▼ -109.49%
- Current HPI
- 310.8347
- Rent YoY
- ▲ 0.72%
- Metro
- Tampa-St. Petersburg-Clearwater, FL
- State GDP YoY
- ▲ 3.28%
- F500 in state
- 36
Industry mix (Fortune 500 HQ in FL)
| Industry | F500 HQs | Revenue |
|---|---|---|
| Industrial Technology | 2 | $29B |
|
||
| Insurance | 2 | $17B |
|
||
| Retail | 1 | $60B |
|
||
| Technology Distribution | 1 | $58B |
|
||
| Homebuilding | 1 | $35B |
|
||
| Technology Manufacturing | 1 | $35B |
|
||
Price history
+357.9% since first listed4 events — show timeline
- 2026-04-27 Price Changed $109,900 Stellar MLS as Distributed by MLS Grid
- 2026-02-24 Listed $115,000 Stellar MLS as Distributed by MLS Grid
- 2022-04-04 Sold (Public Records) $85,000 Public Records
- 2015-02-05 Sold (Public Records) $24,000 Public Records
Property tax history
+33.9%/yrLatest (2025): $2,117 · +5.8% YoY. Source: county tax records.
Cash-flow waterfall
monthlySold comps — $/sqft
last 12 mo · ≤1 miLoading sold comps…