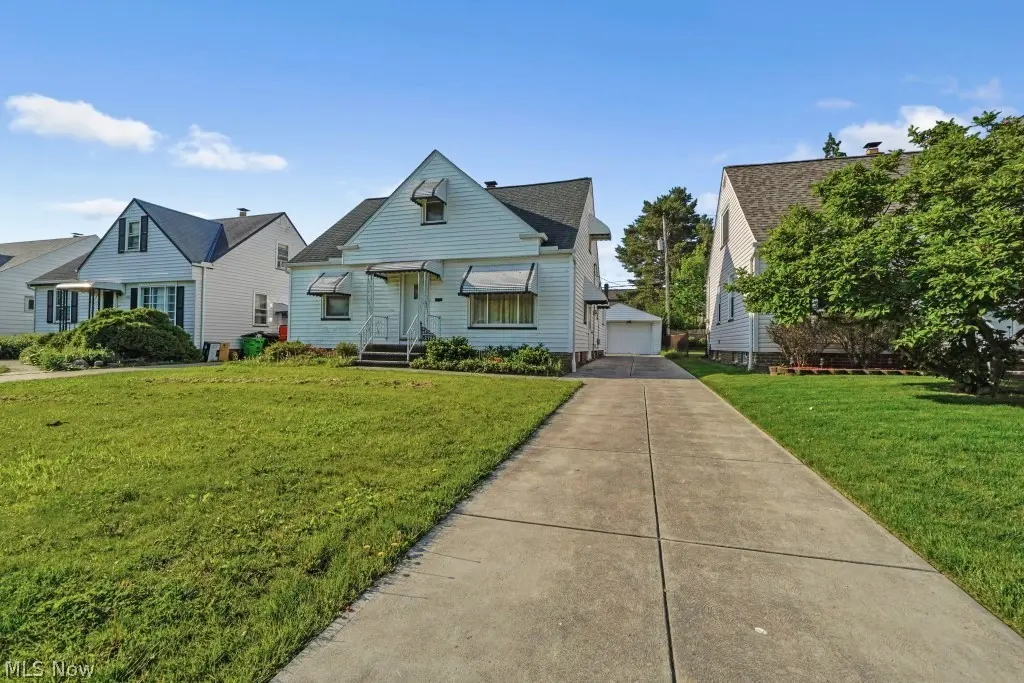
13708 Woodward Blvd · Garfield Heights, OH
Flood risk 1/10 · Minimal
- FEMA flood zone
- X (unshaded)
- Chance of flooding over 30 yrs
- 0.0%
- Est. flood insurance / yr
- $473 – $860
Fire risk 1/10 · Minimal
- Est. fire insurance / yr
- $713 – $1,323
Heat risk 3/10 · Minor
- Hot days now (above 95°F)
- 7 days/yr
- Hot days in 30 yrs
- 17 days/yr
Wind risk 1/10 · Minimal
- Chance of severe wind over 30 yrs
- —
Air-quality risk 3/10 · Minor
- Unhealthy air days now
- 2 days/yr
- Unhealthy air days in 30 yrs
- 3 days/yr
Risk factors via First Street. Map © Google.
Why this score? — see what drove the C grade
The composite is a weighted blend of 9 inputs, each scored 0–100. Each bar is that input's sub-score; the figure is the points it added to the 100-point composite (weight × sub-score).
- Cash flow +20.0/30.0
- ARV discount +14.8/15.0
- DSCR +6.3/10.0
- 1% rule +5.7/10.0
- Rent growth +3.7/5.0
- Livability +3.4/5.0
- Condition / age +2.5/5.0
- Schools +1.3/10.0
- Appreciation +0.0/10.0
$147,000
🖨 Deal sheet 📄 Offer letter ✓ Due diligence
Listing remarks
Welcome home to this well maintained 3 bedroom, 2 full bath Cape Cod nestled on a wonderful street! Step through the front door into the inviting living room filled with warmth and charm. The eat-in kitchen offers ample counter space, plenty of cabinetry and room for everyday dining. Just off the kitchen is a versatile bonus room perfect for a home office, playroom, formal dining space or additional living area to fit your needs. The main floor features two generously sized bedrooms and a full bathroom, while the upstairs provides a spacious bedroom and living area complete with a large walk-in closet. The finished basement adds even more living space with a built-in bar, large full bathro
Key facts
- Nice backyard space
- Finished basement
- Eat-in kitchen
Tags
Property features AI
Finance
- Other: Below-grade finished area approximately 806 (per assessor); Above-grade finished area approximately 1,339 (per assessor); Annual tax information available
Exterior
- Parking: Garage parking; 1.5 garage spaces
- Utilities: Public water; Public sewer
- Home design: Aluminum and vinyl siding exterior; Shingle (asphalt/fiberglass) roof; Home warranty included
- Construction: Built (year per public records); Aluminum siding; Vinyl siding; Asphalt/fiberglass roof
- Exterior features: Lot recorded at approximately 0.12 acres
Interior
- Bedrooms: Two main-level bedrooms
- Bathrooms: Two full bathrooms; One main-level bathroom
- Heating & cooling: Forced air heating (gas); Central air conditioning
- Interior features: Full basement; Below-grade finished living area
- Laundry & utility: Washer; Dryer; Range
Neighborhood map
What this means for you Summary
Snapshot
- This is a 3-bed/1.5-bath single-family listed at $147k.
Deal economics
- At list price, monthly cash flow is $180 ($2k/yr) — positive.
- The deal already cash-flows at list — no discount required.
- Meets the 1% rule at list price ($2k rent vs $147k).
Location & tenants
- Location reads 67/100 on livability (#593 in OH) — a middle-class / working-renter tenant base. Strengths: cost of living A+, housing A+, health & safety A; Watch: schools C-, crime D-, amenities F.
- Garfield Heights City Schools (suburban): math 8% / reading 22% proficiency, ranked #643 of 656 in OH (top 98%) — low school quality limits family demand, transient renter base, plan for 1-2y turnover; 64% free/reduced lunch — lower-income household profile, screen leases tightly.
- Market conditions: Rents rising fast (+4.8%/yr); 120 active listings in the ZIP; 39 comparable units currently listed for rent nearby; rentals at typical pace (median 16d on market — plan ~3-4 weeks tenant-placement turnaround); 1,441 units permitted in Cuyahoga County in 2024 (700 in 5+ unit buildings).
- This rent runs 33% of the median local income ($57k/yr) — at the standard rent-burdened threshold; future hikes will face affordability resistance.
Forward outlook
- Local home prices are declining (-3.0%/yr); year-one equity from $1k of loan paydown is wiped out by about $4k of value loss. Plan a longer hold.
- Cuyahoga County population projected to shrink 8% by 2050 — rents likely to lag national; underwrite the cash flow, not the appreciation.
Negotiation context
- Only 6 days on market — expect competitive offers; lowballing is unlikely to land.
- Current owner paid $66k; list at $147k implies a 124% gain — meaningful room to come down on a strong offer.
Risks & watch-outs
- Watch-outs: built in 1955 — expect roof / HVAC / electrical / plumbing capex.
Questions for the listing agent
- Built in 1955 — when were the roof, HVAC, electrical panel, plumbing, and water heater last replaced?
- Is there a deadline driving the sale (1031 exchange, divorce, estate, relocation)? That informs how much negotiation room exists.
- Crime grade is D in this area — have there been break-ins, vandalism, or insurance claims at this property in the last 3 years? What carrier currently insures it and at what premium?
- What's the average days-on-market for RENTAL listings here right now (not sales)? A rising rental-DOM trend means longer vacancies and softer asking-rent achievability than the comps imply.
- What's the recent tenant-quality profile in this submarket — average credit score on applications, eviction rate, late-payment / NSF rate, and stable-employment percentage? A property-management company in the area should have these aggregated.
- How much new for-sale + rental construction is in the pipeline within 1–3 miles? Heavy new supply typically softens prices + rents 12–24 months out; constrained supply supports both.
Investment metrics
- 1% rule
- 1.07% ✓
- Cap rate
- 7.76%
- Cash-on-cash
- 5.25%
- DSCR
- 1.23
- GRM
- 7.8
CMA / ARV
- ARV (on-the-fly)
- $175,409
- Comps found
- 12
Show comp detail 12 sales within ~0.75 mi
| Address | Dist | Beds/Ba | Sqft | Sold | Price | $/sf | Match |
|---|---|---|---|---|---|---|---|
| 13616 Oakview Blvd | 0.14mi | 3/2.0 | 1,414 (+6%) | 0mo | $164 | — | 82 |
| 14413 Krems Ave | 0.35mi | 3/1.5 | 1,314 (-2%) | 3mo | $98,000 | $75 | 78 |
| 5853 Monica Ln | 0.36mi | 3/1.5 | 1,299 (-3%) | 0mo | $169,900 | $131 | 78 |
| 12913 Darlington Ave | 0.38mi | 3/2.0 | 1,354 (+1%) | 2mo | $209,900 | $155 | 77 |
| 13513 York Blvd | 0.23mi | 3/1.5 | 1,170 (-13%) | 1mo | $185,900 | $159 | 67 |
| 13004 Rockside Rd | 0.64mi | 3/1.0 | 1,319 (-2%) | 0mo | $154,000 | $117 | 66 |
| 5408 Roland Dr | 0.34mi | 3/1.0 | 1,160 (-13%) | 2mo | $142,000 | $122 | 58 |
| 12214 Woodward Blvd | 0.57mi | 4/1.5 (+1) | 1,236 (-8%) | 3mo | $157,500 | $127 | 53 |
| 12701 York Blvd | 0.48mi | 3/2.0 | 1,170 (-13%) | 3mo | $139,900 | $120 | 52 |
| 12119 Woodward Blvd | 0.61mi | 4/1.5 (+1) | 1,236 (-8%) | 3mo | $182,500 | $148 | 51 |
| 13804 Rockside Rd | 0.54mi | 3/1.0 | 1,173 (-12%) | 2mo | $164,500 | $140 | 50 |
| 11909 Hastings Rd | 0.74mi | 3/2.0 | 1,186 (-11%) | 3mo | $188,000 | $159 | 42 |
Match score weights: distance 35% · size 25% · config 20% · recency 20%. Top-matched comps best support the ARV.
Projected returns pro-forma
-3.0% appreciation · 4.8% rent growth · sell at horizon
- IRR
- -6.0%
- Equity multiple
- 0.77×
- Total profit
- $-9,378
- Equity at exit
- $21,918
- IRR
- 5.8%
- Equity multiple
- 1.47×
- Total profit
- $19,231
- Equity at exit
- $12,710
Cash invested: $41,160 (down + closing). Projections, not guarantees.
Landlord ↔ Tenant lean methodology
- Overall (STATE)
- 73 Landlord-Friendly
- State Ohio
- 73 Landlord-Friendly · R+6
- County
- — inherits STATE
- City
- — inherits STATE
ZIP-level market 44125
- Rents YoY
- 4.8%
- Active inventory
- 120
- Price-to-rent
- 7.8×
Monthly cashflow live
- Estimated rent
- $1,579 high interval (Pro) →
- Mortgage (P&I)
- −$771
- Tax from tax record
- −$235 /mo · $2,825/yr
- Insurance
- −$61
- HOA
- −$0
- Vacancy / Maint / Mgmt
- −$332
- Net cashflow
- $180
Break-even live
UW: 25.0% down · 7.5% · 30yr · 1.5% tax · 5.0% vac · 8.0% maint · 8.0% mgmt
Financing live
Cash to close
- Down payment
- $36,750
- Closing costs
- $4,410
- Reserves months
- —
- Total cash needed
- —
Loan-product check · same deal, 3 products live
Conventional
25% down · 7.5% · 30yr
- Down + closing
- —
- Monthly P&I
- —
- Monthly cashflow
- —
- DSCR
- —
- Eligible?
- —
Personal DTI + credit; lowest rate.
DSCR
20% down · 8.5% · 30yr
- Down + closing
- —
- Monthly P&I
- —
- Monthly cashflow
- —
- DSCR
- —
- Eligible?
- —
No personal income docs; deal must DSCR.
Hard money
10% down · 12.0% · 12mo
- Down + closing
- —
- Monthly P&I
- —
- Monthly cashflow
- —
- DSCR
- —
- Eligible?
- —
Short-term bridge; refi at stabilization.
Rent comps 39 comps
| Address | Beds | Baths | Sqft | Rent | $/sqft | DOM | Units | Dist |
|---|---|---|---|---|---|---|---|---|
| 13776 Shady Oak Blvd Cleveland, OH | 4.0 | 1.0 | 1170 | $1,600 | $1.37 | 14d | 1 | 0.03mi |
| 14205 Corridon Ave Maple Heights, OH | 4.0 | 1.5 | 1236 | $1,650 | $1.33 | 23d | 1 | 0.21mi |
| 12918 Eastwood Blvd Cleveland, OH | 4.0 | 1.0 | 1170 | $1,295 | $1.11 | 16d | 1 | 0.31mi |
| 14519 Tokay Ave Maple Heights, OH | 3.0 | 1.0 | 1230 | $1,325 | $1.08 | 43d | 1 | 0.45mi |
| 14100 Brunswick Ave Maple Heights, OH | 3.0 | 1.0 | 1157 | $1,475 | $1.27 | 43d | 1 | 0.45mi |
| 12214 Shady Oak Blvd Cleveland, OH | 3.0 | 1.0 | 900 | $1,350 | $1.50 | 23d | 1 | 0.58mi |
| 5270 Beech Ave Maple Heights, OH | 3.0 | 1.0 | 1401 | $1,350 | $0.96 | 16d | 1 | 0.58mi |
| 12211 Woodward Blvd Cleveland, OH | 4.0 | 2.0 | 1236 | $1,500 | $1.21 | 10d | 1 | 0.58mi |
| 5283 E 133rd St Cleveland, OH | 3.0 | 2.0 | 1176 | $1,495 | $1.27 | 16d | 1 | 0.59mi |
| 14509 Rockside Rd Maple Heights, OH | 3.0 | 2.0 | 1430 | $2,300 | $1.61 | 1d | 1 | 0.63mi |
| 12808 Havana Rd Cleveland, OH | 3.0 | 1.0 | 1056 | $1,350 | $1.28 | 16d | 1 | 0.65mi |
| 5973 Turney Rd Cleveland, OH | 3.0 | 1.5 | 1159 | $1,425 | $1.23 | 23d | 1 | 0.70mi |
| 5164 E 128th St Cleveland, OH | 4.0 | 1.0 | 1222 | $1,495 | $1.22 | 20d | 1 | 0.85mi |
| 11512 Tonsing Dr Unit 2 UP Garfield Heights, OH | 2.0 | 1.0 | 1145 | $975 | $0.85 | 23d | 1 | 0.88mi |
| 11512 Tonsing Dr Cleveland, OH | 2.0 | 1.0 | 1104 | $1,095 | $0.99 | 16d | 1 | 0.88mi |
| 13319 McCracken Rd Cleveland, OH | 3.0 | 1.0 | 1664 | $2,000 | $1.20 | 3d | 1 | 0.88mi |
| 15312 Ramage Ave Maple Heights, OH | 3.0 | 1.0 | 1060 | $1,595 | $1.50 | 43d | 1 | 1.03mi |
| 5581 Saxon Dr Cleveland, OH | 3.0 | 2.0 | 1080 | $1,595 | $1.48 | 7d | 1 | 1.03mi |
| 16011 Maplewood Ave Maple Heights, OH | 3.0 | 1.0 | 1070 | $1,300 | $1.21 | 43d | 1 | 1.06mi |
| 5069 Henry St Cleveland, OH | 3.0 | 2.0 | 1575 | $2,000 | $1.27 | 21d | 1 | 1.09mi |
| 5223 Paine Ave Maple Heights, OH | 4.0 | 1.0 | 1344 | $1,650 | $1.23 | 2d | 1 | 1.12mi |
| 5074 Miller Ave Maple Heights, OH | 3.0 | 1.0 | 962 | $1,400 | $1.46 | 43d | 1 | 1.13mi |
| 16224 Maplewood Ct Maple Heights, OH | 2.0 | 1.0 | 926 | $1,550 | $1.67 | 16d | 1 | 1.16mi |
| 5145 E 114th St Cleveland, OH | 3.0 | 1.5 | 1174 | $1,620 | $1.38 | 7d | 1 | 1.17mi |
| 5627 Jefferson Ave Maple Heights, OH | 3.0 | 1.0 | 1136 | $1,250 | $1.10 | 7d | 1 | 1.24mi |
| 15913 Grant Ave Maple Heights, OH | 3.0 | 1.5 | 1400 | $1,390 | $0.99 | 16d | 1 | 1.25mi |
| 11303 McCracken Rd Cleveland, OH | 3.0 | 1.0 | 1300 | $1,650 | $1.27 | 4d | 1 | 1.29mi |
| 11213 McCracken Rd Cleveland, OH | 3.0 | 1.0 | 1200 | $1,375 | $1.15 | 7d | 1 | 1.33mi |
| 16914 Maple Heights Blvd Maple Heights, OH | 3.0 | 1.0 | 1212 | $1,425 | $1.18 | 10d | 1 | 1.35mi |
| 11006 McCracken Rd Cleveland, OH | 2.0 | 1.0 | 887 | $1,350 | $1.52 | 23d | 1 | 1.36mi |
| 5225 Theodore St Maple Heights, OH | 3.0 | 1.0 | 1785 | $1,450 | $0.81 | 4d | 1 | 1.37mi |
| 11107 Park Heights Ave Cleveland, OH | 4.0 | 2.0 | 1640 | $2,000 | $1.22 | 1d | 1 | 1.39mi |
| 5554 Dalewood Ave Maple Heights, OH | 3.0 | 1.0 | 1150 | $1,500 | $1.30 | 12d | 1 | 1.40mi |
| 5508 Grasmere Ave Maple Heights, OH | 3.0 | 2.0 | 1834 | $1,710 | $0.93 | 43d | 1 | 1.40mi |
| 11110 Vernon Ave Cleveland, OH | 3.0 | 1.0 | 1224 | $1,395 | $1.14 | 23d | 1 | 1.42mi |
| 5461 Clement Ave Maple Heights, OH | 3.0 | 1.5 | 1260 | $1,350 | $1.07 | 20d | 1 | 1.43mi |
| 5461 Clement Ave Maple Heights, OH | 3.0 | 1.5 | 1260 | $1,350 | $1.07 | 16d | 1 | 1.43mi |
| 17204 Mapleboro Ave Maple Heights, OH | 3.0 | 1.0 | 1074 | $1,475 | $1.37 | 43d | 1 | 1.44mi |
| 17206 Mapleboro Ave Maple Heights, OH | 3.0 | 1.0 | 1020 | $1,325 | $1.30 | 23d | 1 | 1.44mi |
Listing history 2 events
-
2026-05-22$147,000 Active
-
1990-09-20soldstatus $65,500
ⓘ Source: listings_history table (triggers on properties + properties_extension) + one-shot
backfill from property_details.listing_events for pre-trigger history.
Tax reassessment forecast OH · Partial reset (capped growth)
- Current annual tax
- $2,825 · $235/mo
- Projected year-2 tax
- $2,825 · $235/mo
- Expected delta
- $0/yr ($0/mo · 0.0%)
ⓘ Screening estimate from a state-policy table — verify with the county assessor before closing.
Climate risk First Street
- Flood 1/10 Low FEMA zone X (unshaded) · 0% chance over 30 yrs
- Wildfire 1/10 Low
- Heat 3/10 Moderate 7 d/yr ≥95°F today · 17 d/yr by 30 yrs out
- Wind 1/10 Low
- Air quality 3/10 Moderate 2 unhealthy d/yr today · 3 by 30 yrs out
Nearby sold comps map
Loading sold comps map…
Walkable amenities ~0.75 mi
Loading nearby amenities…
Taxation est. · year 1
- Rental income
- $18,953
- − Mortgage interest
- −$8,234
- − Property taxes
- −$2,825
- − Insurance
- −$735
- − Repairs & maintenance
- −$1,516
- − Management
- −$1,516
- − Depreciation
- −$4,276
- Taxable loss
- −$150
- Est. tax savings @ 24.0%
- +$36
- After-tax cash flow
- $2,198/yr
For passive investors: Depreciation is non-cash, so a rental often shows a tax loss while cash-flowing — sheltering income. Rental losses are passive: they offset passive income freely, and up to $25,000/yr can offset ordinary (W-2) income if you actively participate and your MAGI is under $100k (phasing out to $0 by $150k); unused losses carry forward. On sale, claimed depreciation is recaptured at up to 25%, and gains may owe capital-gains tax (a 1031 exchange can defer both). Figures are a year-1 estimate at your 24.0% rate — not tax advice; consult a CPA.
Schools (NCES district)
- District
- Garfield Heights City Schools
- NCES district ID
- 3904404
- Math proficiency
- 8% ▼ -19.00%
- Reading proficiency
- 22% ▼ -18.00%
- Median HH income
- $41,334
- Composite
- 12.88/100
- National rank
- #9590
- State rank
- #643 of 656 in OH
Livability — Garfield Heights
- Score
- 67/100
- State rank
- #593
- US rank
- #10152
Category grades
Schools grade is shown separately in the Schools card above.
Census & demographics
- Census place
- Garfield Heights, OH
- County
- Cuyahoga County · 1,090,369 people
- City population
- 29,461
- Metro
- Cleveland-Elyria, OH
- Population (ZIP)
- 29,461
- Household income
- $57,363
- Rent vs Own
- Severe rent burden
- 1738.0
Population outlook (Cuyahoga County) Hauer SSP2
- Today (2025)
- 1,244,621 people
- By 2030
- 1,230,093 · -1.2%
- By 2040
- 1,189,108 · -4.5%
- By 2050
- 1,145,706 · -7.9%
- By 2075
- 1,076,557 · -13.5%
- By 2100
- 978,987 · -21.3%
Race, ethnicity, and origin ACS 2023
- Neighborhood character
- Diverse neighborhood (Simpson 0.61)
- Race & ethnicity
- Black 47% White 41% Two or more races 7% Hispanic / Latino 6%
- Hispanic origin (detail)
- Mexican 2% Puerto Rican 3%
- Common ancestry
- Romanian 11% Slovak 1% Lithuanian 1%
- Foreign-born
- 3% · Canada
- Languages at home
- 94% English-only · Spanish 4% Russian/Polish/Slavic 1%
Political lean MEDSL · Cuyahoga
- 2024 margin
- Solid D (+31.5) · D 65.4% · R 33.9%
- 2008→2024 swing
- -7.4pp toward R · 2008: 38.9pp · 2024: 31.5pp
- All cycles
- 2024: D+31.5 2020: D+34.1 2016: D+35.0 2012: D+38.7 2008: D+38.9
Not yet ingested
- Civics
- —
Market trends
- HPI YoY
- ▼ -116.98%
- Current HPI
- 155.1507
- Rent YoY
- ▲ 4.80%
- Metro
- Cleveland-Elyria, OH
- State GDP YoY
- ▲ 1.98%
- F500 in state
- 48
Industry mix (Fortune 500 HQ in OH)
| Industry | F500 HQs | Revenue |
|---|---|---|
| Insurance | 3 | $145B |
|
||
| Industrial Machinery | 3 | $49B |
|
||
| Financial Services | 3 | $24B |
|
||
| Consumer Goods | 2 | $93B |
|
||
| Aerospace / Defense | 2 | $47B |
|
||
| Utilities | 2 | $33B |
|
||
Price history
+124.4% since first listed2 events — show timeline
- 2026-05-22 Listed $147,000 MLSNOW
- 1990-09-20 Sold (Public Records) $65,500 Public Records
Property tax history
+4.9%/yrLatest (2025): $2,825 · -20.5% YoY. Source: county tax records.
Cash-flow waterfall
monthlySold comps — $/sqft
last 12 mo · ≤1 miLoading sold comps…