 🏗️ New Construction
Irvington Plan · Westfield, IN
Flood risk No data
- FEMA flood zone
- —
- Chance of flooding over 30 yrs
- —
- Est. flood insurance / yr
- —
Fire risk No data
- Est. fire insurance / yr
- —
Heat risk No data
- Hot days now (above threshold)
- —
- Hot days in 30 yrs
- —
Wind risk No data
- Chance of severe wind over 30 yrs
- —
Air-quality risk No data
- Unhealthy air days now
- —
- Unhealthy air days in 30 yrs
- —
Risk factors via First Street. Map © Google.
Why this score? — see what drove the F grade
The composite is a weighted blend of 9 inputs, each scored 0–100. Each bar is that input's sub-score; the figure is the points it added to the 100-point composite (weight × sub-score).
- ARV discount +7.5/15.0
- Cash flow +6.6/30.0
- Schools +5.5/10.0
- Rent growth +3.6/5.0
- Livability +3.6/5.0
- Condition / age +2.2/5.0
- 1% rule +1.7/10.0
- DSCR +0.9/10.0
- Appreciation +0.0/10.0
$276,000
🖨 Deal sheet (PDF) 📄 Offer letter ✓ Due diligence
Listing remarks MLS
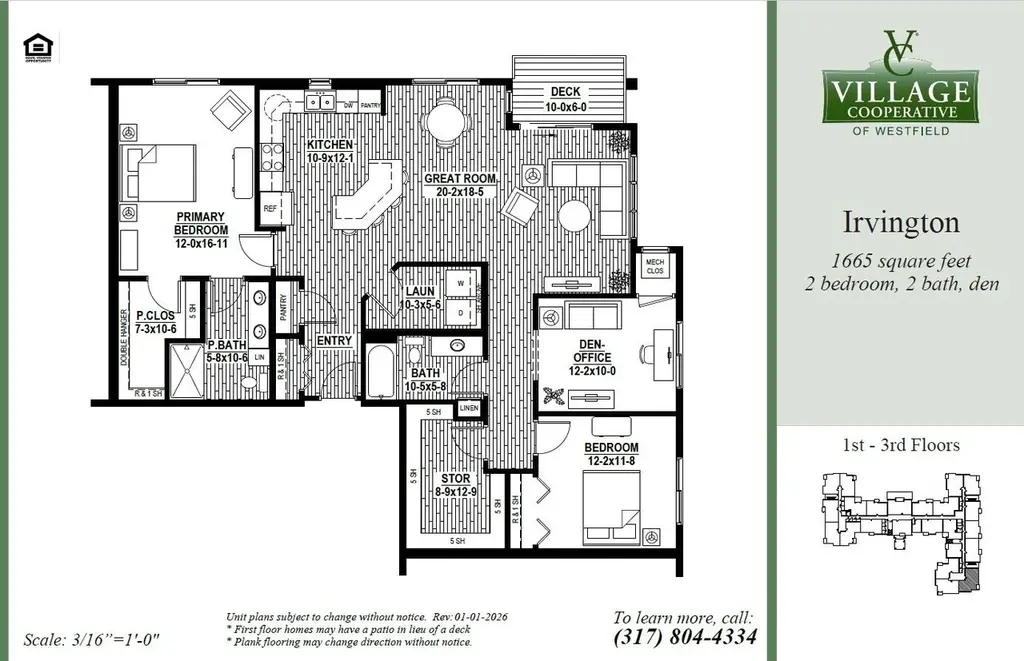
This home plan features a den/office/hobby space in addition to the two bedrooms *
Key facts
- Parking
- Listed 143 days
Tags
Neighborhood map
What this means for you Summary
Snapshot
- This is a 2-bed/2.0-bath condo listed at $276k. Condition is rated fair.
Deal economics
- At list price, monthly cash flow is $-590 ($-7k/yr) — negative.
- To cash-flow at today's rent, offer at most $273k (0.9% below list).
- To meet the 1% rule (rent ≥ 1% of price), the offer needs to be $239k (13.3% below list).
- Recommended offer: $239k (13.3% below list) — sets the bar for 1% rule.
- Cap rate 4.3% vs local median 3.0% in Westfield — top-decile yield for the area; either an underpriced asset or a hidden risk that comps aren't pricing in. Stress-test before assuming the spread holds.
Location & tenants
- Location reads 71/100 on livability (#140 in IN) — a middle-class / working-renter tenant base. Strengths: crime A+, employment A+, housing A+; Watch: amenities F, commute F, health & safety F.
- Westfield-Washington Schools (suburban): math 58% / reading 64% proficiency, ranked #10 of 301 in IN (top 3%) — acceptable for families but not a draw, mixed tenant base, ~2y average lease; only 14% free/reduced lunch — higher-income household profile.
- Market conditions: Rents rising fast (+4.3%/yr); 809 active listings in the ZIP; 4 comparable units currently listed for rent nearby; rentals leasing fast (median 0d on market — plan ~1-2 weeks tenant-placement turnaround); high-income renter base; 4,661 units permitted in Hamilton County in 2024 (1,528 in 5+ unit buildings).
Forward outlook
- Local home prices are declining (-3.0%/yr); year-one equity from $2k of loan paydown is wiped out by about $11k of value loss. Plan a longer hold.
- Hamilton County population projected at +44% by 2050 — long-run rental-demand tailwind backs the buy-and-hold thesis.
Negotiation context
- It's been on market 144 days — a 12% lower offer ($243k) is reasonable based on typical stale-listing flexibility.
Questions for the listing agent
- What do current leases actually rent for vs. the listed asking? Can we see a recent rent roll and the last 12 months of T-12 income?
- It's been on market 144 days. Have you received any prior offers? Is the seller open to a 13% concession, seller financing, or rate buy-down credit?
- Have any recent inspections been done? Can we get a copy of the seller's disclosures and any deferred-maintenance estimates?
- Any open or pending special assessments — roof, HVAC, plumbing, elevator, façade? What's the per-unit balance and payoff schedule, and is the seller paying it off at close or rolling it to the buyer?
- Why hasn't it sold? Are there any deal-killer items the seller is aware of (foundation, flood, title, zoning, code violations)?
- Is there a deadline driving the sale (1031 exchange, divorce, estate, relocation)? That informs how much negotiation room exists.
- Schools are A-rated — typically a magnet for longer-tenancy family renters. What's the average tenant stay here, and is there a school-zone premium baked into asking?
- The area grade is low — what's the realistic commute time and amenity access for the typical tenant pool here? Any planned neighborhood developments (good or bad) we should know about?
- What's the average days-on-market for RENTAL listings here right now (not sales)? A rising rental-DOM trend means longer vacancies and softer asking-rent achievability than the comps imply.
- What's the recent tenant-quality profile in this submarket — average credit score on applications, eviction rate, late-payment / NSF rate, and stable-employment percentage? A property-management company in the area should have these aggregated.
- How much new apartment / multifamily construction is in the pipeline within 1–3 miles? Heavy new supply (>2% of stock underway) typically softens rents 12–24 months out; light construction supports rent growth.
Investment metrics
- 1% rule
- 0.67% ✗
- Cap rate
- 4.32%
- Cash-on-cash
- -7.04%
- DSCR
- 0.69
- GRM
- 12.5
CMA / ARV
- ARV (median comp)
- $358,823
- List price
- $276,000
- Delta
- -23.08%
- Verdict
- UNDERPRICED
- Comps
- 20 within 1.0 mi
Projected returns pro-forma
-3.0% appreciation · 4.26% rent growth · sell at horizon
- IRR
- -27.1%
- Equity multiple
- 0.08×
- Total profit
- $-92,598
- Equity at exit
- $53,502
- IRR
- -21.1%
- Equity multiple
- -0.15×
- Total profit
- $-115,922
- Equity at exit
- $31,024
Cash invested: $100,470 (down + closing). Projections, not guarantees.
Landlord ↔ Tenant lean methodology
- Overall (STATE)
- 90 Strongly Landlord-Friendly
- State Indiana
- 90 Strongly Landlord-Friendly · R+11
- County
- — inherits STATE
- City
- — inherits STATE
ZIP-level market 46074
- Rents YoY
- 4.3%
- Active inventory
- 809
- Price-to-rent
- 9.6×
Monthly cashflow live
- Estimated rent
- $2,392 medium interval (Pro) →
- Mortgage (P&I)
- −$1,882
- Tax est. 1.5%
- −$449 /mo · $5,382/yr
- Insurance
- −$150
- HOA
- −$0
- Vacancy / Maint / Mgmt
- −$502
- Net cashflow
- $-590
Break-even live
Sensitivity live
| Price | -10% $-342 | -5% $-466 | +0% $-590 | +5% $-714 | +10% $-838 |
|---|---|---|---|---|---|
| Rent | -10% $-779 | -5% $-684 | +0% $-590 | +5% $-495 | +10% $-401 |
| Rate | -1.0pp $-409 | -0.5pp $-498 | base $-590 | +0.5pp $-683 | +1.0pp $-777 |
UW: 25.0% down · 7.5% · 30yr · 1.5% tax · 5.0% vac · 8.0% maint · 8.0% mgmt
Financing live
Cash to close
- Down payment
- $89,706
- Closing costs
- $10,765
- Reserves months
- —
- Total cash needed
- —
Loan-product check · same deal, 3 products live
Conventional
25% down · 7.5% · 30yr
- Down + closing
- —
- Monthly P&I
- —
- Monthly cashflow
- —
- DSCR
- —
- Eligible?
- —
Personal DTI + credit; lowest rate.
DSCR
20% down · 8.5% · 30yr
- Down + closing
- —
- Monthly P&I
- —
- Monthly cashflow
- —
- DSCR
- —
- Eligible?
- —
No personal income docs; deal must DSCR.
Hard money
10% down · 12.0% · 12mo
- Down + closing
- —
- Monthly P&I
- —
- Monthly cashflow
- —
- DSCR
- —
- Eligible?
- —
Short-term bridge; refi at stabilization.
Rent comps 4 comps
| Address | Beds | Baths | Sqft | Rent | $/sqft | DOM | Units | Dist |
|---|---|---|---|---|---|---|---|---|
| 1601 S Waterleaf Dr Westfield, IN | 2.0 | 2.0 | 635 | $1,941 | $3.05 | 0d | 19 | 0.08mi |
| 1659 Dewey Dr Westfield, IN | 2.0 | 2.0 | 1748 | $2,650 | $1.52 | 0d | 1 | 0.35mi |
| 14518 Brecon Ln Carmel, IN | 3.0 | 2.5 | 1980 | $2,695 | $1.36 | 45d | 1 | 0.49mi |
| 14637 Handel Dr Carmel, IN | 1.0–3.0 | 1.0–2.0 | 1128 | $1,695 | $1.50 | 0d | 49 | 1.24mi |
HOA detail condo
- Monthly dues
- $0 · $0/yr
- Assessments
- None detected in remarks — confirm with the listing agent.
Listing history 17 events
-
2026-06-21days on market $276,000 Active 144 DOM
-
2026-06-18days on market $276,000 Active 141 DOM
-
2026-06-17days on market $276,000 Active 140 DOM
-
2026-06-16days on market $276,000 Active 139 DOM
-
2026-06-15days on market $276,000 Active 138 DOM
-
2026-06-13days on market $276,000 Active 136 DOM
-
2026-06-13days on market $276,000 Active 135 DOM
-
2026-06-09days on market $276,000 Active 132 DOM
-
2026-06-08days on market $276,000 Active 131 DOM
-
2026-06-07days on market $276,000 Active 130 DOM
-
2026-06-05days on market $276,000 Active 127 DOM
-
2026-06-03days on market $276,000 Active 126 DOM
-
2026-06-02days on market $276,000 Active 125 DOM
-
2026-06-01days on market $276,000 Active 124 DOM
-
2026-05-31days on market $276,000 Active 123 DOM
-
2026-02-03price $276,000 82-char remark
Show marketing remark (82 chars)
This home plan features a den/office/hobby space in addition to the two bedrooms *
-
2026-01-28$290,000 Active 82-char remark
Show marketing remark (82 chars)
This home plan features a den/office/hobby space in addition to the two bedrooms *
ⓘ Source: listings_history table (triggers on properties + properties_extension) + one-shot
backfill from property_details.listing_events for pre-trigger history.
Nearby sold comps map
Loading sold comps map…
Walkable amenities ~0.75 mi
Loading nearby amenities…
Taxation est. · year 1
- Rental income
- $28,709
- − Mortgage interest
- −$20,100
- − Property taxes
- −$5,382
- − Insurance
- −$1,794
- − Repairs & maintenance
- −$2,297
- − Management
- −$2,297
- − Depreciation
- −$10,438
- Taxable loss
- −$13,599
- Est. tax savings @ 24.0%
- +$3,264
- After-tax cash flow
- $-3,813/yr
For passive investors: Depreciation is non-cash, so a rental often shows a tax loss while cash-flowing — sheltering income. Rental losses are passive: they offset passive income freely, and up to $25,000/yr can offset ordinary (W-2) income if you actively participate and your MAGI is under $100k (phasing out to $0 by $150k); unused losses carry forward. On sale, claimed depreciation is recaptured at up to 25%, and gains may owe capital-gains tax (a 1031 exchange can defer both). Figures are a year-1 estimate at your 24.0% rate — not tax advice; consult a CPA.
Condition & rehab AI · 1 photo
This Irvington Condo requires moderate rehabilitation, focusing on painting and minor repairs. Fresh paint and landscaping would significantly enhance its resale and rental value.
Repairs flagged
- Minor Paint — Paint appears slightly faded
Value-add opportunities
- Resale Paint — Fresh paint enhances curb appeal and interior aesthetics
- Rental Landscaping — Landscaping improves curb appeal and attracts tenants
Renovation cost estimate screening
| Repair item | Severity | Est. cost |
|---|---|---|
| Paint · Paint appears slightly faded | Minor | $500–3,000 |
| Total estimated repair cost · 1 items | $500–3,000 |
Value-add ROI direction
- Resale Paint — Fresh paint enhances curb appeal and interior aesthetics ↑
- Rental Landscaping — Landscaping improves curb appeal and attracts tenants ↑
ⓘ Cost ranges are severity-bucket heuristics (US national rule-of-thumb). Get contractor quotes + a written scope before underwriting a rehab budget.
Schools (NCES district)
- District
- Westfield-Washington Schools
- NCES district ID
- 1813080
- Math proficiency
- 58% ▼ -9.00%
- Reading proficiency
- 64% ▼ -3.00%
- Median HH income
- $82,682
- Composite
- 55.01/100
- National rank
- #1295
- State rank
- #10 of 301 in IN
Livability — Westfield
- Score
- 71/100
- State rank
- #140
- US rank
- #7263
Category grades
Schools grade is shown separately in the Schools card above.
Census & demographics
- Census place
- Westfield, IN
- County
- Hamilton County · 337,479 people
- City population
- 48,901
- Metro
- Indianapolis-Carmel-Anderson, IN
- Population (ZIP)
- 48,901
- Household income
- $126,724
- Rent vs Own
- Severe rent burden
- 742.0
Population outlook (Hamilton County) Hauer SSP2
- Today (2025)
- 381,938 people
- By 2030
- 417,496 · +9.3%
- By 2040
- 486,684 · +27.4%
- By 2050
- 549,805 · +44.0%
- By 2075
- 687,078 · +79.9%
- By 2100
- 754,495 · +97.5%
Race, ethnicity, and origin ACS 2023
- Neighborhood character
- Predominantly White (74%)
- Race & ethnicity
- White 74% Two or more races 10% Hispanic / Latino 9% Asian 8% Black 3%
- Hispanic origin (detail)
- Mexican 4% Puerto Rican 1%
- Common ancestry
- Romanian 4% Italian 4% Lithuanian 2%
- Foreign-born
- 12% · Canada, China, South Korea
- Languages at home
- 84% English-only · Spanish 5% Arabic 3% Chinese 2%
Political lean MEDSL · Hamilton
- 2024 margin
- Lean R (+6.1) · D 46.0% · R 52.1% · Other 1.9%
- 2008→2024 swing
- +16.2pp toward D · 2008: -22.2pp · 2024: -6.1pp
- All cycles
- 2024: R+6.1 2020: R+6.8 2016: R+19.6 2012: R+34.3 2008: R+22.2
Not yet ingested
- Civics
- —
Market trends
- HPI YoY
- ▼ -140.45%
- Current HPI
- 220.9413
- Rent YoY
- ▲ 4.26%
- Metro
- Indianapolis-Carmel-Anderson, IN
- State GDP YoY
- ▲ 2.90%
- F500 in state
- 18
Industry mix (Fortune 500 HQ in IN)
| Industry | F500 HQs | Revenue |
|---|---|---|
| Industrial Machinery | 2 | $37B |
|
||
| Healthcare | 1 | $177B |
|
||
| Pharmaceuticals | 1 | $45B |
|
||
| Metals / Steel | 1 | $18B |
|
||
| Agriculture | 1 | $17B |
|
||
| Packaging | 1 | $12B |
|
||
Price history
-4.8% since first listed2 events — show timeline
- 2026-02-03 Price Changed $276,000 Zillow
- 2026-01-28 Listed $290,000 Zillow
Cash-flow waterfall
monthlySold comps — $/sqft
last 12 mo · ≤1 miLoading sold comps…