205 Bay Springs Blvd Unit 42A · DeFuniak Springs, FL
Flood risk No data
- FEMA flood zone
- —
- Chance of flooding over 30 yrs
- —
- Est. flood insurance / yr
- —
Fire risk No data
- Est. fire insurance / yr
- —
Heat risk No data
- Hot days now (above threshold)
- —
- Hot days in 30 yrs
- —
Wind risk No data
- Chance of severe wind over 30 yrs
- —
Air-quality risk No data
- Unhealthy air days now
- —
- Unhealthy air days in 30 yrs
- —
Risk factors via First Street. Map © Google.
Why this score? — see what drove the D- grade
The composite is a weighted blend of 9 inputs, each scored 0–100. Each bar is that input's sub-score; the figure is the points it added to the 100-point composite (weight × sub-score).
- Appreciation +10.0/10.0
- ARV discount +7.5/15.0
- Cash flow +5.4/30.0
- Schools +5.2/10.0
- Livability +3.2/5.0
- Rent growth +2.5/5.0
- Condition / age +2.5/5.0
- 1% rule +1.5/10.0
- DSCR +0.0/10.0
$279,980
🖨 Deal sheet 📄 Offer letter ✓ Due diligence
Listing remarks
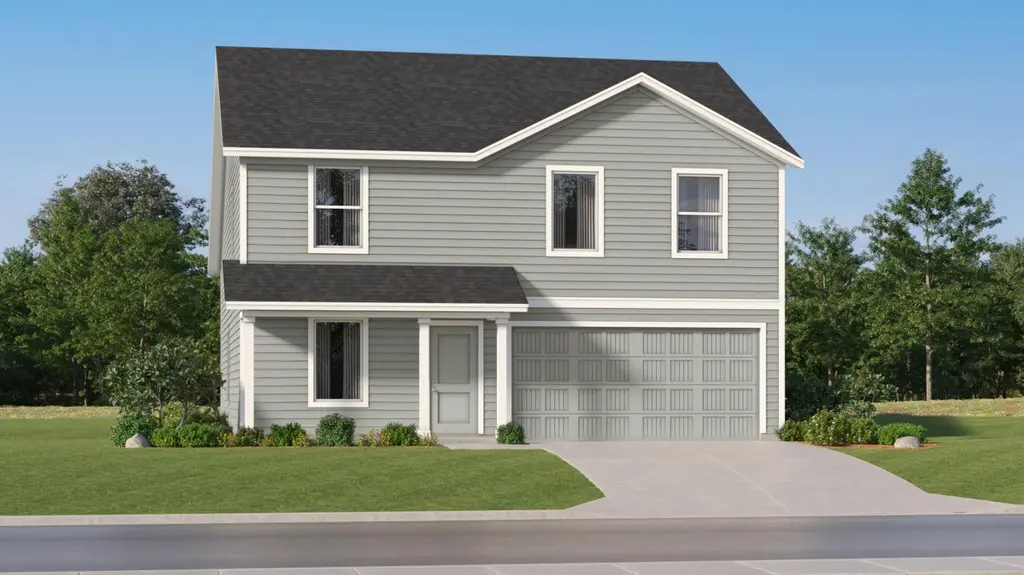
Model Home Open! Introducing the Littleton floorplan, a beautifully designed new construction home that blends modern comfort with thoughtful functionality. This spacious two-story layout offers 4 bedrooms, 2.5 baths, and a versatile loft bonus area, perfect for working from home, entertaining guests, or relaxing with family. Step inside to discover luxury finishes throughout, including quartz countertops, stainless steel appliances, and shaker style cabinets, all selected for their style and durability. The exterior features low maintenance Hardie board siding, offering clean lines and lasting curb appeal. An attached 2 car garage adds convenience for everyday living.
Key facts
- Quartz countertops
- Loft bonus area
- Luxury finishes
Tags
Property features AI
Finance
- Other: Subdivision: Bay Springs
- HOA & community: Homeowners association present; Association covers management and structure maintenance; Fees include management, repairs/maintenance, and master association services
Exterior
- Parking: Garage
- Utilities: Electric service; Public water; Public sewer
- Home design: Contemporary style; 2 stories; Entry on first floor
- Construction: Shingle roof; Frame construction with vinyl siding; Slab foundation; Built in 2026
- Exterior features: Cleared interior lot; Private road frontage; Paved road access; Deed restrictions
Interior
- Kitchen: Dishwasher; Garbage disposal; Electric water heater
- Bedrooms: 4 bedrooms; Master bedroom on the first floor with walk-in closet and shower-only master bathroom
- Flooring: Vinyl; Carpet
- Bathrooms: 3 bathrooms total (2 full, 1 half)
- Heating & cooling: Heat pump
- Interior features: Breakfast bar; Newly painted; Owner's closet; Pantry; Shelving; Washer/dryer hookup; Double pane windows
- Laundry & utility: Washer/dryer hookup
Neighborhood map
What this means for you Summary
Snapshot
- This is a 4-bed/2.5-bath single-family listed at $280k.
Deal economics
- At list price, monthly cash flow is $-615 ($-7k/yr) — negative.
- To cash-flow at today's rent, offer at most $191k (31.8% below list).
- To meet the 1% rule (rent ≥ 1% of price), the offer needs to be $182k (34.9% below list).
- Recommended offer: $182k (34.9% below list) — sets the bar for 1% rule.
- Cap rate 3.7% vs local median 4.8% in DeFuniak Springs — below-typical yield; the buyer is paying a premium for something (appreciation thesis, condition, location) that the cap rate doesn't capture.
Location & tenants
- Location reads 64/100 on livability (#694 in FL) — a middle-class / working-renter tenant base. Strengths: cost of living A+, housing A+; Watch: health & safety C-, crime D, amenities F.
- Walton (rural): math 62% / reading 61% proficiency, ranked #10 of 73 in FL (top 14%) — acceptable for families but not a draw, mixed tenant base, ~2y average lease.
- Zoned schools: West Defuniak Elementary School (math 67% / reading 57%, grade B, #608 of 2,144 statewide, top 29%, 669 students, 69% FRL); Walton High School (math 52% / reading 53%, grade C-, #154 of 667 statewide, top 24%, 856 students, 65% FRL) — zoned schools average 67% FRL vs 48% district-wide (19 pts higher); higher-poverty schools than district average — tighter screening recommended.
- Market conditions: 122 active listings in the ZIP; 2,883 units permitted in Walton County in 2024 (1,322 in 5+ unit buildings).
Forward outlook
- In year one you build about $30k of equity ($2k loan paydown + $28k appreciation (10.0% local appreciation)).
- Walton County population projected at +46% by 2050 — long-run rental-demand tailwind backs the buy-and-hold thesis.
- By year 2, paydown + projected appreciation supports a ~$48k cash-out refi (75% LTV) — recoverable capital for the next deal without selling this one.
Negotiation context
- It's been on market 43 days — a 3% lower offer ($272k) is reasonable based on typical stale-listing flexibility.
Questions for the listing agent
- What do current leases actually rent for vs. the listed asking? Can we see a recent rent roll and the last 12 months of T-12 income?
- It's been on market 43 days. Have you received any prior offers? Is the seller open to a 35% concession, seller financing, or rate buy-down credit?
- What does the HOA fee cover, when was the last increase, and are there any pending special assessments or reserve-fund shortfalls?
- Is there a deadline driving the sale (1031 exchange, divorce, estate, relocation)? That informs how much negotiation room exists.
- Schools are D-rated, which usually means shorter tenancies and higher turnover. Who's the typical renter profile here, and what's been the actual vacancy rate?
- Crime grade is D in this area — have there been break-ins, vandalism, or insurance claims at this property in the last 3 years? What carrier currently insures it and at what premium?
- The area grade is low — what's the realistic commute time and amenity access for the typical tenant pool here? Any planned neighborhood developments (good or bad) we should know about?
- What's the average days-on-market for RENTAL listings here right now (not sales)? A rising rental-DOM trend means longer vacancies and softer asking-rent achievability than the comps imply.
- What's the recent tenant-quality profile in this submarket — average credit score on applications, eviction rate, late-payment / NSF rate, and stable-employment percentage? A property-management company in the area should have these aggregated.
- How much new for-sale + rental construction is in the pipeline within 1–3 miles? Heavy new supply typically softens prices + rents 12–24 months out; constrained supply supports both.
Investment metrics
- 1% rule
- 0.65% ✗
- Cap rate
- 3.66%
- Cash-on-cash
- -9.41%
- DSCR
- 0.58
- GRM
- 12.8
CMA / ARV
- ARV (on-the-fly)
- $279,868
- Comps found
- 7
Show comp detail 7 sales within ~0.75 mi
| Address | Dist | Beds/Ba | Sqft | Sold | Price | $/sf | Match |
|---|---|---|---|---|---|---|---|
| 157 Bay Springs Blvd Unit 47A | 0.05mi | 4/2.5 | 1,891 (0%) | 2mo | $276,990 | $146 | 96 |
| 187 Bay Springs Blvd Unit 44A | 0.02mi | 4/2.0 | 1,810 (-4%) | 1mo | $266,980 | $148 | 89 |
| 145 Bay Springs Blvd Unit 48A | 0.06mi | 4/2.0 | 1,810 (-4%) | 2mo | $263,980 | $146 | 87 |
| 117 Bay Springs Blvd Unit 50A | 0.08mi | 4/2.0 | 1,810 (-4%) | 2mo | $314,900 | $174 | 85 |
| 167 Bay Springs Blvd Unit 46A | 0.04mi | 4/2.0 | 1,732 (-8%) | 2mo | $259,990 | $150 | 81 |
| 108 Bay Springs Blvd Unit 4A | 0.10mi | 4/2.0 | 1,732 (-8%) | 0mo | $257,490 | $149 | 79 |
| 154 Bay Springs Blvd Unit 8A | 0.05mi | 4/2.0 | 1,707 (-10%) | 1mo | $247,990 | $145 | 79 |
Match score weights: distance 35% · size 25% · config 20% · recency 20%. Top-matched comps best support the ARV.
Projected returns pro-forma
10.0% appreciation · 3.0% rent growth · sell at horizon
- IRR
- 17.7%
- Equity multiple
- 2.45×
- Total profit
- $113,429
- Equity at exit
- $252,228
- IRR
- 16.6%
- Equity multiple
- 5.66×
- Total profit
- $365,023
- Equity at exit
- $543,940
Cash invested: $78,394 (down + closing). Projections, not guarantees.
Landlord ↔ Tenant lean methodology
- Overall (STATE)
- 87 Strongly Landlord-Friendly
- State Florida
- 87 Strongly Landlord-Friendly · R+3
- County
- — inherits STATE
- City
- — inherits STATE
ZIP-level market 32435
- Home prices YoY
- 4.0%
- Active inventory
- 122
- Price-to-rent
- 12.8×
Monthly cashflow live
- Estimated rent
- $1,823 medium interval (Pro) →
- Mortgage (P&I)
- −$1,468
- Tax est. 1.5%
- −$350 /mo · $4,200/yr
- Insurance
- −$117
- HOA
- −$120
- Vacancy / Maint / Mgmt
- −$383
- Net cashflow
- $-615
Break-even live
UW: 25.0% down · 7.5% · 30yr · 1.5% tax · 5.0% vac · 8.0% maint · 8.0% mgmt
Financing live
Cash to close
- Down payment
- $69,995
- Closing costs
- $8,399
- Reserves months
- —
- Total cash needed
- —
Loan-product check · same deal, 3 products live
Conventional
25% down · 7.5% · 30yr
- Down + closing
- —
- Monthly P&I
- —
- Monthly cashflow
- —
- DSCR
- —
- Eligible?
- —
Personal DTI + credit; lowest rate.
DSCR
20% down · 8.5% · 30yr
- Down + closing
- —
- Monthly P&I
- —
- Monthly cashflow
- —
- DSCR
- —
- Eligible?
- —
No personal income docs; deal must DSCR.
Hard money
10% down · 12.0% · 12mo
- Down + closing
- —
- Monthly P&I
- —
- Monthly cashflow
- —
- DSCR
- —
- Eligible?
- —
Short-term bridge; refi at stabilization.
HOA detail
- Monthly dues
- $120 · $1,440/yr
Listing history 2 events
-
2026-05-15status Pending
-
2026-04-02$279,980 Active
ⓘ Source: listings_history table (triggers on properties + properties_extension) + one-shot
backfill from property_details.listing_events for pre-trigger history.
Nearby sold comps map
Loading sold comps map…
Walkable amenities ~0.75 mi
Loading nearby amenities…
Taxation est. · year 1
- Rental income
- $21,875
- − Mortgage interest
- −$15,683
- − Property taxes
- −$4,200
- − Insurance
- −$1,400
- − Repairs & maintenance
- −$1,750
- − Management
- −$1,750
- − HOA
- −$1,440
- − Depreciation
- −$8,145
- Taxable loss
- −$12,493
- Est. tax savings @ 24.0%
- +$2,998
- After-tax cash flow
- $-4,379/yr
For passive investors: Depreciation is non-cash, so a rental often shows a tax loss while cash-flowing — sheltering income. Rental losses are passive: they offset passive income freely, and up to $25,000/yr can offset ordinary (W-2) income if you actively participate and your MAGI is under $100k (phasing out to $0 by $150k); unused losses carry forward. On sale, claimed depreciation is recaptured at up to 25%, and gains may owe capital-gains tax (a 1031 exchange can defer both). Figures are a year-1 estimate at your 24.0% rate — not tax advice; consult a CPA.
Schools (NCES district)
- District
- Walton
- NCES district ID
- 1201980
- Math proficiency
- 62% ▼ -4.00%
- Reading proficiency
- 61% ▼ -2.00%
- Median HH income
- $46,794
- Composite
- 52.03/100
- National rank
- #1634
- State rank
- #10 of 73 in FL
Livability — DeFuniak Springs
- Score
- 64/100
- State rank
- #694
- US rank
- #14475
Category grades
Schools grade is shown separately in the Schools card above.
Census & demographics
- Census place
- DeFuniak Springs, FL
- City population
- 19,746
- Population (ZIP)
- 6,359
Population outlook (Walton County) Hauer SSP2
- Today (2025)
- 80,014 people
- By 2030
- 88,120 · +10.1%
- By 2040
- 103,537 · +29.4%
- By 2050
- 117,034 · +46.3%
- By 2075
- 143,901 · +79.8%
- By 2100
- 155,138 · +93.9%
Race, ethnicity, and origin ACS 2023
- Neighborhood character
- Predominantly White (83%)
- Race & ethnicity
- White 83% Black 6% Two or more races 6% Hispanic / Latino 4%
- Common ancestry
- Slovak 5% Scottish 2% Serbian 1%
- Foreign-born
- 3% · Canada
- Languages at home
- 97% English-only · Spanish 2%
Political lean MEDSL · Walton
- 2024 margin
- Solid R (+57.8) · D 20.7% · R 78.6%
- 2008→2024 swing
- -12.0pp toward R · 2008: -45.8pp · 2024: -57.8pp
- All cycles
- 2024: R+57.8 2020: R+51.7 2016: R+56.1 2012: R+52.0 2008: R+45.8
Not yet ingested
- Civics
- —
Market trends
- HPI YoY
- ▲ 12.25%
- Current HPI
- 314.8146
- Rent YoY
- —
- Metro
- —
- State GDP YoY
- ▲ 3.28%
- F500 in state
- 36
Industry mix (Fortune 500 HQ in FL)
| Industry | F500 HQs | Revenue |
|---|---|---|
| Industrial Technology | 2 | $29B |
|
||
| Insurance | 2 | $17B |
|
||
| Retail | 1 | $60B |
|
||
| Technology Distribution | 1 | $58B |
|
||
| Homebuilding | 1 | $35B |
|
||
| Technology Manufacturing | 1 | $35B |
|
||
Price history
2 events — show timeline
- 2026-05-15 Pending — ECAR
- 2026-04-02 Listed $279,980 ECAR
Cash-flow waterfall
monthlySold comps — $/sqft
last 12 mo · ≤1 miLoading sold comps…