 Multi-family
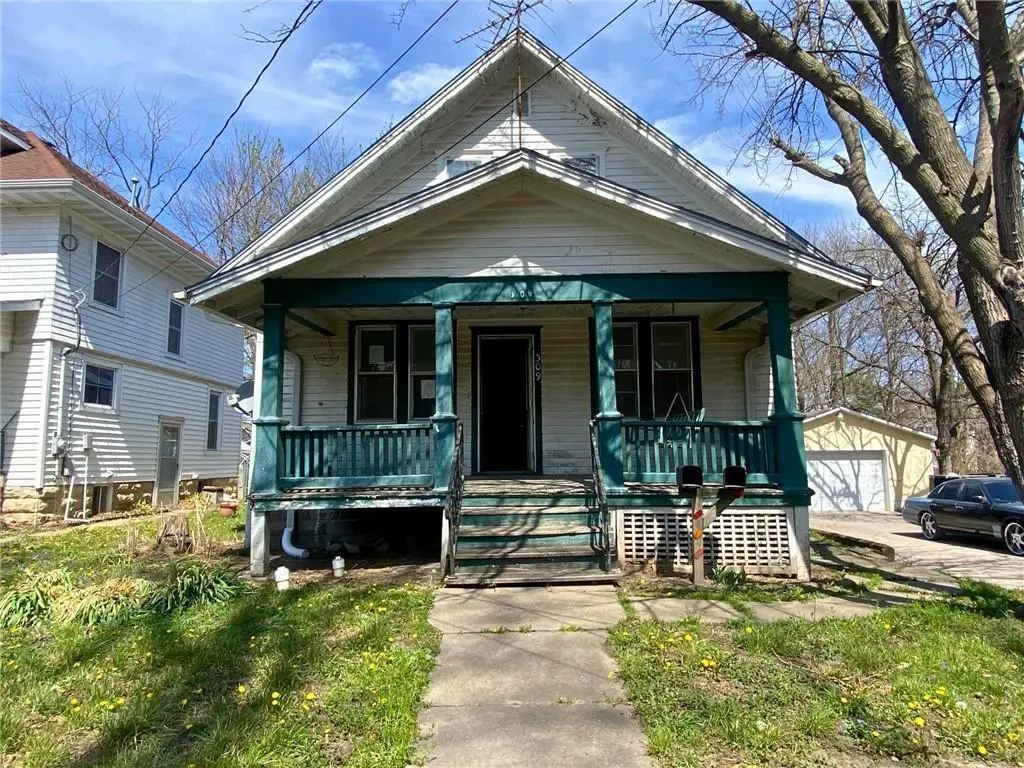
309 E Culton St · Warrensburg, MO
Flood risk 1/10 · Minimal
- FEMA flood zone
- X (unshaded)
- Chance of flooding over 30 yrs
- 0.0%
- Est. flood insurance / yr
- $507 – $1,088
Fire risk 2/10 · Minimal
- Est. fire insurance / yr
- $1,054 – $1,958
Heat risk 4/10 · Minor
- Hot days now (above 109°F)
- 7 days/yr
- Hot days in 30 yrs
- 17 days/yr
Wind risk 2/10 · Minimal
- Chance of severe wind over 30 yrs
- —
Air-quality risk 1/10 · Minimal
- Unhealthy air days now
- 0 days/yr
- Unhealthy air days in 30 yrs
- 0 days/yr
Risk factors via First Street. Map © Google.
Why this score? — see what drove the B grade
The composite is a weighted blend of 9 inputs, each scored 0–100. Each bar is that input's sub-score; the figure is the points it added to the 100-point composite (weight × sub-score).
- Cash flow +30.0/30.0
- 1% rule +10.0/10.0
- DSCR +10.0/10.0
- ARV discount +7.5/15.0
- Rent growth +4.2/5.0
- Livability +3.7/5.0
- Schools +3.2/10.0
- Condition / age +2.5/5.0
- Appreciation +0.0/10.0
$89,900
🖨 Deal sheet (PDF) 📄 Offer letter ✓ Due diligence
Multi-family units
County records classify this as Multi-Family (2-4 Unit). Listing-text estimate: 1 unit. estimate disagrees with records
Listing remarks MLS
This house would be a great investment for a nontraditional college student. Or for parents of a traditional student. The student could live in one unit and rent out the other during the four or more years of college studies. After graduation they could rent both sides as income property. The front of the home looks like a regular house not a duplex. The front unit is a two bedroom one bath home with a nice size kitchen, dinning and living room. The back unit is upstairs with a separate entrance. It is also a two bedroom one bath. The living room and kitchen are smaller upstairs but the bedrooms are a nice size. This property, 309 East Culton, sells as is. Offers welcome.
Key facts
- 6,098 sq ft lot
- Built 1925
- Listed 53 days
Property features AI
Finance
- Other: Operating expenses include other items
- Financial info: Property listed as residential income (duplex) with 2 total units
- HOA & community: No association fees; No maintenance provided
Exterior
- Parking: On-street parking
- Utilities: Public water (city/public - verify); Public sewer; Other utilities
- Home design: Duplex residential income property; 2 stories; Zoned R2
- Construction: Frame construction; Composition roof
- Exterior features: On-street parking; Lot approximately 0.14 acres
Interior
- Bedrooms: Two-bedroom units (2 units)
- Heating & cooling: Other heating; Other cooling
- Interior features: Basement present
Neighborhood map
What this means for you Summary
Snapshot
- This is a 8-bed/?-bath multifamily listed at $90k.
Deal economics
- At list price, monthly cash flow is $1k ($16k/yr) — positive.
- The deal already cash-flows at list — no discount required.
- Meets the 1% rule at list price ($2k rent vs $90k).
- Recommended offer: $87k (3.0% below list) — sets the bar for market timing.
- Cap rate 24.1% vs local median 3.2% in Warrensburg — top-decile yield for the area; either an underpriced asset or a hidden risk that comps aren't pricing in. Stress-test before assuming the spread holds.
Location & tenants
- Location reads 74/100 on livability (#71 in MO, #4,801 nationally) — a middle-class / working-renter tenant base. Strengths: cost of living A+, housing A+, health & safety A; Watch: crime D+, employment D+, commute F.
- Warrensburg R-VI (town): math 30% / reading 45% proficiency, ranked #184 of 324 in MO (top 57%) — families likely to look elsewhere, expect single-tenant / working-renter base with shorter leases.
- Zoned schools: Sterling Elem. (math 28% / reading 38%, grade F, #744 of 1,115 statewide, top 67%, 389 students, 32% FRL); Warrensburg Middle (math 32% / reading 44%, grade F, #211 of 391 statewide, top 55%, 722 students, 30% FRL); Warrensburg High (math 24% / reading 60%, grade F, #218 of 521 statewide, top 45%, 992 students, 25% FRL) — zoned schools at 29% FRL track the district average.
- Market conditions: Rents rising fast (+6.7%/yr); 272 active listings in the ZIP; 80 units permitted in Johnson County in 2024 (27 in 5+ unit buildings).
- At $2,443/mo this rent would consume 48% of the median local household income ($61k/yr) (locally 855% of renters already pay >50% of income on rent) — very limited rent-growth headroom before tenants either downsize or default.
Forward outlook
- Local home prices are declining (-3.0%/yr); year-one equity from $622 of loan paydown is wiped out by about $3k of value loss. Plan a longer hold.
- Johnson County population projected at +6% by 2050 — modest demand growth; plan on rents tracking national, not racing it.
- At projected returns (-3.0% appreciation + 6.7% rent growth), your $25k cash investment doubles in ~2 years — after that, you're playing with house money.
Negotiation context
- It's been on market 53 days — a 3% lower offer ($87k) is reasonable based on typical stale-listing flexibility.
- 6 sale attempts since 23y ago; this cycle's ask has dropped $10k (10%) from the opening price — seller is motivated, your offer sets the floor, not the list.
Risks & watch-outs
- Watch-outs: built in 1925 — expect roof / HVAC / electrical / plumbing capex.
Questions for the listing agent
- It's been on market 53 days. Have you received any prior offers? Is the seller open to a 3% concession, seller financing, or rate buy-down credit?
- Built in 1925 — when were the roof, HVAC, electrical panel, plumbing, and water heater last replaced?
- Is there a deadline driving the sale (1031 exchange, divorce, estate, relocation)? That informs how much negotiation room exists.
- Schools are B-rated — typically a magnet for longer-tenancy family renters. What's the average tenant stay here, and is there a school-zone premium baked into asking?
- Crime grade is D in this area — have there been break-ins, vandalism, or insurance claims at this property in the last 3 years? What carrier currently insures it and at what premium?
- What's the average days-on-market for RENTAL listings here right now (not sales)? A rising rental-DOM trend means longer vacancies and softer asking-rent achievability than the comps imply.
- What's the recent tenant-quality profile in this submarket — average credit score on applications, eviction rate, late-payment / NSF rate, and stable-employment percentage? A property-management company in the area should have these aggregated.
- How much new apartment / multifamily construction is in the pipeline within 1–3 miles? Heavy new supply (>2% of stock underway) typically softens rents 12–24 months out; light construction supports rent growth.
Investment metrics
- 1% rule
- 2.72% ✓
- Cap rate
- 24.09%
- Cash-on-cash
- 63.58%
- DSCR
- 3.83
- GRM
- 3.1
CMA / ARV
- ARV (median comp)
- $253,648
- List price
- $89,900
- Delta
- -64.56%
- Verdict
- UNDERPRICED
- Comps
- 3 within 1.0 mi
Projected returns pro-forma
-3.0% appreciation · 6.68% rent growth · sell at horizon
- IRR
- 66.7%
- Equity multiple
- 4.17×
- Total profit
- $79,774
- Equity at exit
- $13,404
- IRR
- 72.1%
- Equity multiple
- 9.76×
- Total profit
- $220,449
- Equity at exit
- $7,773
Cash invested: $25,172 (down + closing). Projections, not guarantees.
Landlord ↔ Tenant lean methodology
- Overall (STATE)
- 81 Strongly Landlord-Friendly
- State Missouri
- 81 Strongly Landlord-Friendly · R+10
- County
- — inherits STATE
- City
- — inherits STATE
ZIP-level market 64093
- Home prices YoY
- -33.4%
- Rents YoY
- 6.7%
- Active inventory
- 272
- Price-to-rent
- 6.1×
Monthly cashflow live
- Estimated rent
- $2,443 high interval (Pro) →
- Mortgage (P&I)
- −$471
- Tax from tax record
- −$87 /mo · $1,049/yr
- Insurance
- −$37
- HOA
- −$0
- Vacancy / Maint / Mgmt
- −$513
- Net cashflow
- $1,334
Break-even live
Sensitivity live
| Price | -10% $1,385 | -5% $1,359 | +0% $1,334 | +5% $1,308 | +10% $1,283 |
|---|---|---|---|---|---|
| Rent | -10% $1,141 | -5% $1,237 | +0% $1,334 | +5% $1,430 | +10% $1,527 |
| Rate | -1.0pp $1,379 | -0.5pp $1,357 | base $1,334 | +0.5pp $1,310 | +1.0pp $1,287 |
2-unit breakdown (identical units grouped — click to expand)
| Units | Beds | Baths | Est. rent |
|---|---|---|---|
| 2× units | 2 | 1 | $2,442 |
| #1 | 2 | 1 | $1,221 |
| #2 | 2 | 1 | $1,221 |
| Total (2 units) | $2,443 | ||
UW: 25.0% down · 7.5% · 30yr · 1.5% tax · 5.0% vac · 8.0% maint · 8.0% mgmt
Financing live
Cash to close
- Down payment
- $22,475
- Closing costs
- $2,697
- Reserves months
- —
- Total cash needed
- —
Loan-product check · same deal, 3 products live
Conventional
25% down · 7.5% · 30yr
- Down + closing
- —
- Monthly P&I
- —
- Monthly cashflow
- —
- DSCR
- —
- Eligible?
- —
Personal DTI + credit; lowest rate.
DSCR
20% down · 8.5% · 30yr
- Down + closing
- —
- Monthly P&I
- —
- Monthly cashflow
- —
- DSCR
- —
- Eligible?
- —
No personal income docs; deal must DSCR.
Hard money
10% down · 12.0% · 12mo
- Down + closing
- —
- Monthly P&I
- —
- Monthly cashflow
- —
- DSCR
- —
- Eligible?
- —
Short-term bridge; refi at stabilization.
Listing history 30 events
-
2026-06-21days on market $89,900 Active 53 DOM
-
2026-06-19days on market $89,900 Active 51 DOM
-
2026-06-18days on market $89,900 Active 50 DOM
-
2026-06-17days on market $89,900 Active 49 DOM
-
2026-06-16days on market $89,900 Active 48 DOM
-
2026-06-15days on market $89,900 Active 47 DOM
-
2026-06-14days on market $89,900 Active 45 DOM
-
2026-06-12days on market $89,900 Active 44 DOM
-
2026-06-09pricedays on market $89,900 Active 41 DOM
-
2026-06-08days on market $99,900 Active 40 DOM
-
2026-06-07days on market $99,900 Active 39 DOM
-
2026-06-03days on market $99,900 Active 35 DOM
-
2026-06-02days on market $99,900 Active 34 DOM
-
2026-06-01days on market $99,900 Active 33 DOM
-
2026-05-31days on market $99,900 Active 32 DOM
-
2026-05-30days on market $99,900 Active 31 DOM
-
2026-04-29$99,900 Active 275-char remark
-
2025-07-31historical
-
2025-05-07status Active
-
2025-04-09status Pending
-
2025-03-06status Active
-
2024-10-15status Pending
-
2024-07-15$102,000 Active
-
2021-03-01historical
Show marketing remark (680 chars)
This house would be a great investment for a nontraditional college student. Or for parents of a traditional student. The student could live in one unit and rent out the other during the four or more years of college studies. After graduation they could rent both sides as income property. The front of the home looks like a regular house not a duplex. The front unit is a two bedroom one bath home with a nice size kitchen, dinning and living room. The back unit is upstairs with a separate entrance. It is also a two bedroom one bath. The living room and kitchen are smaller upstairs but the bedrooms are a nice size. This property, 309 East Culton, sells as is. Offers welcome.
-
2020-02-24$88,900 Active
Show marketing remark (680 chars)
This house would be a great investment for a nontraditional college student. Or for parents of a traditional student. The student could live in one unit and rent out the other during the four or more years of college studies. After graduation they could rent both sides as income property. The front of the home looks like a regular house not a duplex. The front unit is a two bedroom one bath home with a nice size kitchen, dinning and living room. The back unit is upstairs with a separate entrance. It is also a two bedroom one bath. The living room and kitchen are smaller upstairs but the bedrooms are a nice size. This property, 309 East Culton, sells as is. Offers welcome.
-
2006-03-24soldstatus
-
2006-03-01soldstatus
-
2006-03-01soldstatus
-
2003-08-15$72,500
-
1993-11-01soldstatus
ⓘ Source: listings_history table (triggers on properties + properties_extension) + one-shot
backfill from property_details.listing_events for pre-trigger history.
Tax reassessment forecast MO · Resets to sale price
- Current annual tax
- $1,049 · $87/mo
- Projected year-2 tax
- $1,049 · $87/mo
- Expected delta
- $0/yr ($0/mo · 0.0%)
ⓘ Screening estimate from a state-policy table — verify with the county assessor before closing.
Climate risk First Street
- Flood 1/10 Low FEMA zone X (unshaded) · 0% chance over 30 yrs
- Wildfire 2/10 Low
- Heat 4/10 Moderate 7 d/yr ≥109°F today · 17 d/yr by 30 yrs out
- Wind 2/10 Low
- Air quality 1/10 Low 0 unhealthy d/yr today · 0 by 30 yrs out
Nearby sold comps map
Loading sold comps map…
Walkable amenities ~0.75 mi
Loading nearby amenities…
Taxation est. · year 1
- Rental income
- $29,316
- − Mortgage interest
- −$5,036
- − Property taxes
- −$1,049
- − Insurance
- −$450
- − Repairs & maintenance
- −$2,345
- − Management
- −$2,345
- − Depreciation
- −$2,615
- Taxable income
- $15,476
- Est. tax owed @ 24.0%
- −$3,714
- After-tax cash flow
- $12,290/yr
For passive investors: Depreciation is non-cash, so a rental often shows a tax loss while cash-flowing — sheltering income. Rental losses are passive: they offset passive income freely, and up to $25,000/yr can offset ordinary (W-2) income if you actively participate and your MAGI is under $100k (phasing out to $0 by $150k); unused losses carry forward. On sale, claimed depreciation is recaptured at up to 25%, and gains may owe capital-gains tax (a 1031 exchange can defer both). Figures are a year-1 estimate at your 24.0% rate — not tax advice; consult a CPA.
Schools (NCES district)
- District
- Warrensburg R-VI
- NCES district ID
- 2931020
- Math proficiency
- 30% ▼ -11.00%
- Reading proficiency
- 45% ▼ -11.00%
- Median HH income
- $43,760
- Composite
- 31.77/100
- National rank
- #5895
- State rank
- #184 of 324 in MO
Livability — Warrensburg
- Score
- 74/100
- State rank
- #71
- US rank
- #4801
Category grades
Schools grade is shown separately in the Schools card above.
Census & demographics
- Census place
- Warrensburg, MO
- County
- Johnson County · 34,718 people
- City population
- 28,199
- Metro
- Warrensburg, MO
- Population (ZIP)
- 28,199
- Household income
- $61,094
- Rent vs Own
- Severe rent burden
- 855.0
Population outlook (Johnson County) Hauer SSP2
- Today (2025)
- 55,794 people
- By 2030
- 56,861 · +1.9%
- By 2040
- 58,239 · +4.4%
- By 2050
- 59,168 · +6.0%
- By 2075
- 62,222 · +11.5%
- By 2100
- 60,118 · +7.7%
Race, ethnicity, and origin ACS 2023
- Neighborhood character
- Predominantly White (84%)
- Race & ethnicity
- White 84% Two or more races 5% Hispanic / Latino 5% Black 4% Asian 2%
- Common ancestry
- Slovak 2% Italian 2% Serbian 2%
- Foreign-born
- 2% · South Korea
- Languages at home
- 95% English-only · Spanish 2% Other Asian/Pacific 1% Other Indo-European 1%
Political lean MEDSL · Johnson
- 2024 margin
- Solid R (+39.6) · D 29.5% · R 69.1% · Other 1.4%
- 2008→2024 swing
- -27.3pp toward R · 2008: -12.2pp · 2024: -39.6pp
- All cycles
- 2024: R+39.6 2020: R+36.8 2016: R+36.9 2012: R+24.2 2008: R+12.2
Not yet ingested
- Civics
- —
Market trends
- HPI YoY
- ▼ -90.22%
- Current HPI
- 179.7251
- Rent YoY
- ▲ 6.68%
- Metro
- Warrensburg, MO
- State GDP YoY
- ▲ 1.84%
- F500 in state
- 20
Industry mix (Fortune 500 HQ in MO)
| Industry | F500 HQs | Revenue |
|---|---|---|
| Healthcare | 1 | $163B |
|
||
| Insurance | 1 | $21B |
|
||
| Industrial Technology | 1 | $17B |
|
||
| Retail | 1 | $16B |
|
||
| Industrial Distribution | 1 | $10B |
|
||
| Utilities | 1 | $9B |
|
||
Price history
+24.0% since first listed15 events — show timeline
- 2026-06-09 Price Changed $89,900 Heartland MLS as Distributed by MLS Grid
- 2026-04-29 Listed $99,900 Heartland MLS as Distributed by MLS Grid
- 2025-07-31 Listing Removed — Heartland MLS as Distributed by MLS Grid
- 2025-05-07 Relisted — Heartland MLS as Distributed by MLS Grid
- 2025-04-09 Pending — Heartland MLS as Distributed by MLS Grid
- 2025-03-06 Relisted — Heartland MLS as Distributed by MLS Grid
- 2024-10-15 Pending — Heartland MLS as Distributed by MLS Grid
- 2024-07-15 Listed $102,000 Heartland MLS as Distributed by MLS Grid
- 2021-03-01 Listing Removed — Heartland MLS as Distributed by MLS Grid
- 2020-02-24 Listed $88,900 Heartland MLS as Distributed by MLS Grid
- 2006-03-24 Sold (MLS) — Heartland MLS as Distributed by MLS Grid
- 2006-03-01 Sold (Public Records) — Public Records
- 2006-03-01 Sold (Public Records) — Public Records
- 2003-08-15 Listed $72,500 Heartland MLS as Distributed by MLS Grid
- 1993-11-01 Sold (Public Records) — Public Records
Property tax history
+2.8%/yrLatest (2025): $1,049 · +7.1% YoY. Source: county tax records.
Cash-flow waterfall
monthlySold comps — $/sqft
last 12 mo · ≤1 miLoading sold comps…