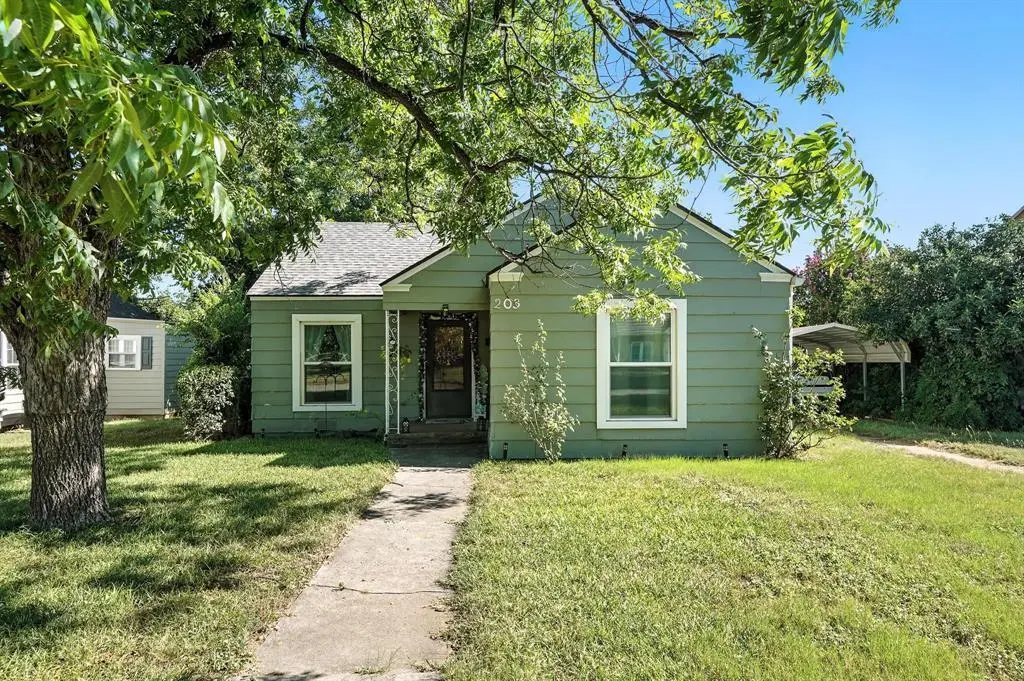
203 Miami St · Coleman, TX
Flood risk No data
- FEMA flood zone
- —
- Chance of flooding over 30 yrs
- —
- Est. flood insurance / yr
- —
Fire risk No data
- Est. fire insurance / yr
- —
Heat risk No data
- Hot days now (above threshold)
- —
- Hot days in 30 yrs
- —
Wind risk No data
- Chance of severe wind over 30 yrs
- —
Air-quality risk No data
- Unhealthy air days now
- —
- Unhealthy air days in 30 yrs
- —
Risk factors via First Street. Map © Google.
Why this score? — see what drove the C grade
The composite is a weighted blend of 9 inputs, each scored 0–100. Each bar is that input's sub-score; the figure is the points it added to the 100-point composite (weight × sub-score).
- Cash flow +15.5/30.0
- ARV discount +11.9/15.0
- Appreciation +7.8/10.0
- DSCR +4.8/10.0
- 1% rule +3.6/10.0
- Livability +3.4/5.0
- Schools +3.3/10.0
- Rent growth +2.5/5.0
- Condition / age +2.5/5.0
$119,000
🖨 Deal sheet 📄 Offer letter ✓ Due diligence
Listing remarks MLS
Welcome to this charming 3-bedroom, 2-bath home nestled in a quaint, established neighborhood in Coleman. From the moment you arrive, the large mature tree in the front yard adds timeless curb appeal and a touch of natural beauty that makes the home feel instantly welcoming. Step inside to discover a spacious living area perfect for relaxing or hosting gatherings, along with a designated dining area that’s just right for family meals or entertaining friends. The kitchen offers a practical layout with ample cabinet and counter space, making meal prep easy and efficient. All three bedrooms are generously sized, providing flexibility for restful retreats, guest rooms, or even a home office. Out back, enjoy a comfortable sitting area — ideal for morning coffee or evening conversations — overlooking a large grassy yard that’s perfect for play, gardening, or weekend barbecues. A detached garage adds extra convenience, offering parking, storage, or workshop possibilities. Located in a peaceful, well-established Coleman neighborhood known for its friendly charm and sense of community, this home beautifully combines functionality, character, and the potential to truly make it your own. Come see how it could be the perfect fit for your next chapter!
Key facts
- Spacious living area
- Large grassy yard
- Ample cabinet space
Tags
Neighborhood map
What this means for you Summary
Snapshot
- This is a 3-bed/2.0-bath single-family listed at $119k.
Deal economics
- At list price, monthly cash flow is $47 ($566/yr) — positive.
- The deal already cash-flows at list — no discount required.
- To meet the 1% rule (rent ≥ 1% of price), the offer needs to be $103k (13.8% below list).
- Recommended offer: $103k (13.8% below list) — sets the bar for 1% rule.
- Cap rate 6.8% vs local median 4.5% in Coleman — top-decile yield for the area; either an underpriced asset or a hidden risk that comps aren't pricing in. Stress-test before assuming the spread holds.
Location & tenants
- Location reads 68/100 on livability (#454 in TX) — a middle-class / working-renter tenant base. Strengths: crime A+, cost of living A+, housing A+; Watch: health & safety D+, schools F, amenities F.
- Coleman ISD (town): math 42% / reading 39% proficiency, ranked #439 of 826 in TX (top 53%) — families likely to look elsewhere, expect single-tenant / working-renter base with shorter leases.
- Market conditions: 119 active listings in the ZIP; 5 units permitted in Coleman County in 2024 (0 in 5+ unit buildings).
Forward outlook
- In year one you build about $8k of equity ($823 loan paydown + $7k appreciation (5.7% local appreciation)).
- Coleman County population projected at -28% by 2050 — secular population decline; favor cash flow + early exit over multi-decade hold.
- At projected returns (5.7% appreciation + 3.0% rent growth), your $33k cash investment doubles in ~4 years — after that, you're playing with house money.
- By year 5, paydown + projected appreciation supports a ~$33k cash-out refi (75% LTV) — recoverable capital for the next deal without selling this one.
Negotiation context
- It's been on market 325 days — a 12% lower offer ($105k) is reasonable based on typical stale-listing flexibility.
Risks & watch-outs
- Watch-outs: built in 1950 — expect roof / HVAC / electrical / plumbing capex.
Questions for the listing agent
- It's been on market 325 days. Have you received any prior offers? Is the seller open to a 14% concession, seller financing, or rate buy-down credit?
- Built in 1950 — when were the roof, HVAC, electrical panel, plumbing, and water heater last replaced?
- Why hasn't it sold? Are there any deal-killer items the seller is aware of (foundation, flood, title, zoning, code violations)?
- Is there a deadline driving the sale (1031 exchange, divorce, estate, relocation)? That informs how much negotiation room exists.
- Schools are F-rated, which usually means shorter tenancies and higher turnover. Who's the typical renter profile here, and what's been the actual vacancy rate?
- What's the average days-on-market for RENTAL listings here right now (not sales)? A rising rental-DOM trend means longer vacancies and softer asking-rent achievability than the comps imply.
- What's the recent tenant-quality profile in this submarket — average credit score on applications, eviction rate, late-payment / NSF rate, and stable-employment percentage? A property-management company in the area should have these aggregated.
- How much new for-sale + rental construction is in the pipeline within 1–3 miles? Heavy new supply typically softens prices + rents 12–24 months out; constrained supply supports both.
Investment metrics
- 1% rule
- 0.86% ✗
- Cap rate
- 6.77%
- Cash-on-cash
- 1.70%
- DSCR
- 1.08
- GRM
- 9.7
CMA / ARV
- ARV (median comp)
- $131,768
- List price
- $119,000
- Delta
- -9.69%
- Verdict
- FAIR
- Comps
- 20 within 1.0 mi
Show comp detail 12 sales within ~0.75 mi
| Address | Dist | Beds/Ba | Sqft | Sold | Price | $/sf | Match |
|---|---|---|---|---|---|---|---|
| 203 Hollywood St | 0.12mi | 3/2.0 | 1,284 (-4%) | 10mo | $117,000 | $91 | 80 |
| 608 E 8th St | 0.24mi | 3/2.0 | 1,260 (-6%) | 4mo | $155,500 | $123 | 76 |
| 216 E 9th St | 0.26mi | 3/2.0 | 1,380 (+3%) | 8mo | $149,900 | $109 | 76 |
| 109 Miami St | 0.14mi | 3/2.0 | 1,502 (+12%) | 2mo | $71,500 | $48 | 71 |
| 200 Roselawn | 0.12mi | 4/2.0 (+1) | 1,448 (+8%) | 11mo | $142,000 | $98 | 66 |
| 129 Roselawn St | 0.14mi | 3/1.0 | 1,156 (-14%) | 4mo | $139,900 | $121 | 64 |
| 601 E 1st St | 0.68mi | 3/2.0 | 1,355 (+1%) | 9mo | $169,375 | $125 | 59 |
| 1510 S Colorado St | 0.33mi | 2/1.0 (-1) | 1,204 (-10%) | 12mo | $199,999 | $166 | 49 |
| 917 E 3rd St | 0.71mi | 3/2.0 | 1,472 (+10%) | 1mo | $292,400 | $199 | 49 |
| 1115 S Colorado St | 0.50mi | 2/1.0 (-1) | 1,179 (-12%) | 5mo | $62,500 | $53 | 44 |
| 213 W 14th St | 0.44mi | 3/1.0 | 1,148 (-14%) | 12mo | $59,900 | $52 | 42 |
| 214 E 20th St | 0.57mi | 3/2.0 | 1,144 (-14%) | 12mo | $135,000 | $118 | 40 |
Match score weights: distance 35% · size 25% · config 20% · recency 20%. Top-matched comps best support the ARV.
Projected returns pro-forma
5.66% appreciation · 3.0% rent growth · sell at horizon
- IRR
- 15.9%
- Equity multiple
- 2.05×
- Total profit
- $34,958
- Equity at exit
- $72,272
- IRR
- 16.1%
- Equity multiple
- 4.03×
- Total profit
- $101,111
- Equity at exit
- $128,926
Cash invested: $33,320 (down + closing). Projections, not guarantees.
Landlord ↔ Tenant lean methodology
- Overall (STATE)
- 87 Strongly Landlord-Friendly
- State Texas
- 87 Strongly Landlord-Friendly · R+5
- County
- — inherits STATE
- City
- — inherits STATE
ZIP-level market 76834
- Home prices YoY
- 4.8%
- Active inventory
- 119
- Price-to-rent
- 9.7×
Monthly cashflow live
- Estimated rent
- $1,026 medium interval (Pro) →
- Mortgage (P&I)
- −$624
- Tax from tax record
- −$90 /mo · $1,074/yr
- Insurance
- −$50
- HOA
- −$0
- Vacancy / Maint / Mgmt
- −$215
- Net cashflow
- $47
Break-even live
UW: 25.0% down · 7.5% · 30yr · 1.5% tax · 5.0% vac · 8.0% maint · 8.0% mgmt
Financing live
Cash to close
- Down payment
- $29,750
- Closing costs
- $3,570
- Reserves months
- —
- Total cash needed
- —
Loan-product check · same deal, 3 products live
Conventional
25% down · 7.5% · 30yr
- Down + closing
- —
- Monthly P&I
- —
- Monthly cashflow
- —
- DSCR
- —
- Eligible?
- —
Personal DTI + credit; lowest rate.
DSCR
20% down · 8.5% · 30yr
- Down + closing
- —
- Monthly P&I
- —
- Monthly cashflow
- —
- DSCR
- —
- Eligible?
- —
No personal income docs; deal must DSCR.
Hard money
10% down · 12.0% · 12mo
- Down + closing
- —
- Monthly P&I
- —
- Monthly cashflow
- —
- DSCR
- —
- Eligible?
- —
Short-term bridge; refi at stabilization.
Listing history 16 events
-
2026-06-18days on market $119,000 Active 325 DOM
-
2026-06-17days on market $119,000 Active 324 DOM
-
2026-06-16days on market $119,000 Active 323 DOM
-
2026-06-15days on market $119,000 Active 322 DOM
-
2026-06-13days on market $119,000 Active 320 DOM
-
2026-06-12days on market $119,000 Active 319 DOM
-
2026-06-09days on market $119,000 Active 316 DOM
-
2026-06-08days on market $119,000 Active 315 DOM
-
2026-06-08days on market $119,000 Active 314 DOM
-
2026-06-07days on market $119,000 Active 313 DOM
-
2026-06-03days on market $119,000 Active 310 DOM
-
2026-06-02days on market $119,000 Active 309 DOM
-
2026-06-01days on market $119,000 Active 308 DOM
-
2026-05-31days on market $119,000 Active 307 DOM
-
2025-08-29price $119,000 1287-char remark
Show marketing remark (1287 chars)
Welcome to this charming 3-bedroom, 2-bath home nestled in a quaint, established neighborhood in Coleman. From the moment you arrive, the large mature tree in the front yard adds timeless curb appeal and a touch of natural beauty that makes the home feel instantly welcoming. Step inside to discover a spacious living area perfect for relaxing or hosting gatherings, along with a designated dining area that’s just right for family meals or entertaining friends. The kitchen offers a practical layout with ample cabinet and counter space, making meal prep easy and efficient. All three bedrooms are generously sized, providing flexibility for restful retreats, guest rooms, or even a home office. Out back, enjoy a comfortable sitting area — ideal for morning coffee or evening conversations — overlooking a large grassy yard that’s perfect for play, gardening, or weekend barbecues. A detached garage adds extra convenience, offering parking, storage, or workshop possibilities. Located in a peaceful, well-established Coleman neighborhood known for its friendly charm and sense of community, this home beautifully combines functionality, character, and the potential to truly make it your own. Come see how it could be the perfect fit for your next chapter!
-
2025-07-28$129,500 Active 1287-char remark
Show marketing remark (1287 chars)
Welcome to this charming 3-bedroom, 2-bath home nestled in a quaint, established neighborhood in Coleman. From the moment you arrive, the large mature tree in the front yard adds timeless curb appeal and a touch of natural beauty that makes the home feel instantly welcoming. Step inside to discover a spacious living area perfect for relaxing or hosting gatherings, along with a designated dining area that’s just right for family meals or entertaining friends. The kitchen offers a practical layout with ample cabinet and counter space, making meal prep easy and efficient. All three bedrooms are generously sized, providing flexibility for restful retreats, guest rooms, or even a home office. Out back, enjoy a comfortable sitting area — ideal for morning coffee or evening conversations — overlooking a large grassy yard that’s perfect for play, gardening, or weekend barbecues. A detached garage adds extra convenience, offering parking, storage, or workshop possibilities. Located in a peaceful, well-established Coleman neighborhood known for its friendly charm and sense of community, this home beautifully combines functionality, character, and the potential to truly make it your own. Come see how it could be the perfect fit for your next chapter!
ⓘ Source: listings_history table (triggers on properties + properties_extension) + one-shot
backfill from property_details.listing_events for pre-trigger history.
Tax reassessment forecast TX · Resets to sale price
- Current annual tax
- $1,074 · $90/mo
- Projected year-2 tax
- $2,178 · $181/mo
- Expected delta
- +$1,103/yr (+$92/mo · 102.7%)
ⓘ Screening estimate from a state-policy table — verify with the county assessor before closing.
Nearby sold comps map
Loading sold comps map…
Walkable amenities ~0.75 mi
Loading nearby amenities…
Taxation est. · year 1
- Rental income
- $12,309
- − Mortgage interest
- −$6,666
- − Property taxes
- −$1,074
- − Insurance
- −$595
- − Repairs & maintenance
- −$985
- − Management
- −$985
- − Depreciation
- −$3,462
- Taxable loss
- −$1,457
- Est. tax savings @ 24.0%
- +$350
- After-tax cash flow
- $916/yr
For passive investors: Depreciation is non-cash, so a rental often shows a tax loss while cash-flowing — sheltering income. Rental losses are passive: they offset passive income freely, and up to $25,000/yr can offset ordinary (W-2) income if you actively participate and your MAGI is under $100k (phasing out to $0 by $150k); unused losses carry forward. On sale, claimed depreciation is recaptured at up to 25%, and gains may owe capital-gains tax (a 1031 exchange can defer both). Figures are a year-1 estimate at your 24.0% rate — not tax advice; consult a CPA.
Schools (NCES district)
- District
- Coleman ISD
- NCES district ID
- 4814550
- Math proficiency
- 42% ▲ 3.00%
- Reading proficiency
- 39% ▲ 3.00%
- Median HH income
- $31,765
- Composite
- 33.18/100
- National rank
- #5540
- State rank
- #439 of 826 in TX
Livability — Coleman
- Score
- 68/100
- State rank
- #454
- US rank
- #9173
Category grades
Schools grade is shown separately in the Schools card above.
Census & demographics
- Census place
- Coleman, TX
- Population (ZIP)
- 4,861
Population outlook (Coleman County) Hauer SSP2
- Today (2025)
- 7,321 people
- By 2030
- 6,834 · -6.7%
- By 2040
- 5,968 · -18.5%
- By 2050
- 5,283 · -27.8%
- By 2075
- 4,205 · -42.6%
- By 2100
- 3,405 · -53.5%
Race, ethnicity, and origin ACS 2023
- Neighborhood character
- Predominantly White (76%)
- Race & ethnicity
- White 76% Hispanic / Latino 20% Two or more races 13% Black 3%
- Hispanic origin (detail)
- Mexican 18%
- Common ancestry
- Italian 16% Slovak 8% Serbian 3%
- Foreign-born
- 7% · Canada
- Languages at home
- 79% English-only · Spanish 21%
Political lean MEDSL · Coleman
- 2024 margin
- Solid R (+79.0) · D 10.3% · R 89.3%
- 2008→2024 swing
- -15.1pp toward R · 2008: -64.0pp · 2024: -79.0pp
- All cycles
- 2024: R+79.0 2020: R+77.3 2016: R+76.8 2012: R+73.7 2008: R+64.0
Not yet ingested
- Civics
- —
Market trends
- HPI YoY
- ▲ 5.66%
- Current HPI
- 123.8456
- Rent YoY
- —
- Metro
- —
- State GDP YoY
- ▲ 3.95%
- F500 in state
- 110
Industry mix (Fortune 500 HQ in TX)
| Industry | F500 HQs | Revenue |
|---|---|---|
| Energy | 16 | $1,198B |
|
||
| Technology | 5 | $198B |
|
||
| Engineering / Construction | 4 | $72B |
|
||
| Energy Services | 3 | $60B |
|
||
| Utilities | 3 | $41B |
|
||
| Healthcare | 2 | $330B |
|
||
Price history
-8.1% since first listed2 events — show timeline
- 2025-08-29 Price Changed $119,000 NTREIS
- 2025-07-28 Listed $129,500 NTREIS
Property tax history
+3.0%/yrLatest (2025): $1,074 · +6.3% YoY. Source: county tax records.
Cash-flow waterfall
monthlySold comps — $/sqft
last 12 mo · ≤1 miLoading sold comps…