 🏷️ Likely Rental
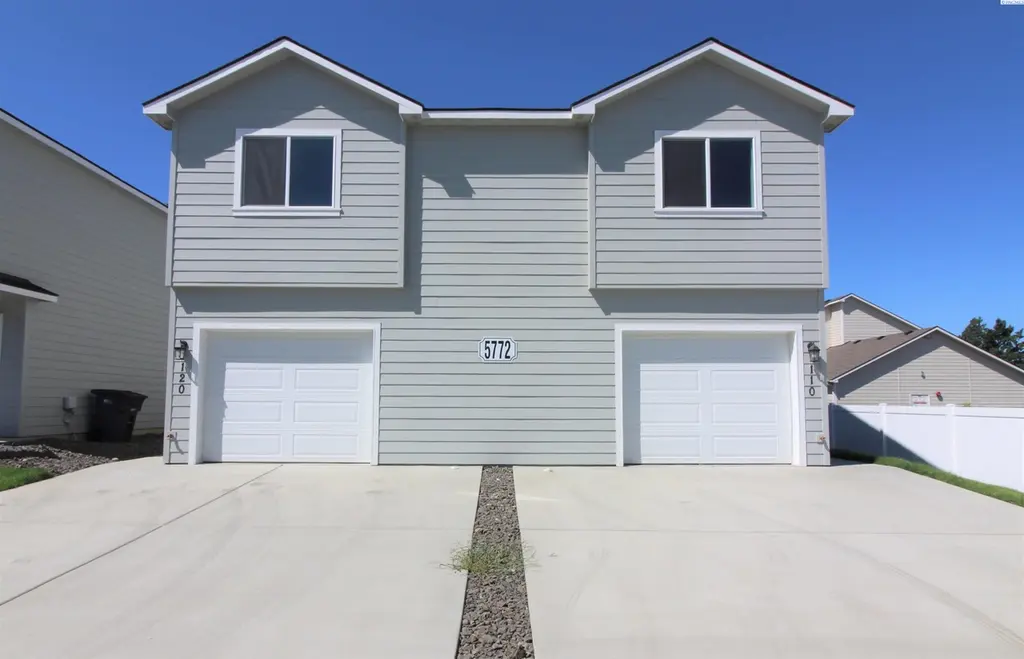
5772 W Albany Pl #120 · Kennewick, WA
Flood risk 1/10 · Minimal
- FEMA flood zone
- X
- Chance of flooding over 30 yrs
- 0.0%
- Est. flood insurance / yr
- $507 – $1,088
Fire risk 4/10 · Minor
- Est. fire insurance / yr
- $604 – $1,122
Heat risk 5/10 · Moderate
- Hot days now (above 98°F)
- 7 days/yr
- Hot days in 30 yrs
- 15 days/yr
Wind risk 1/10 · Minimal
- Chance of severe wind over 30 yrs
- —
Air-quality risk 8/10 · Major
- Unhealthy air days now
- 14 days/yr
- Unhealthy air days in 30 yrs
- 15 days/yr
Risk factors via First Street. Map © Google.
Why this score? — see what drove the D+ grade
The composite is a weighted blend of 9 inputs, each scored 0–100. Each bar is that input's sub-score; the figure is the points it added to the 100-point composite (weight × sub-score).
- Cash flow +15.0/30.0
- ARV discount +7.5/15.0
- 1% rule +5.0/10.0
- DSCR +5.0/10.0
- Schools +4.6/10.0
- Livability +3.9/5.0
- Rent growth +3.3/5.0
- Condition / age +2.5/5.0
- Appreciation +0.0/10.0
$1,795
🖨 Deal sheet 📄 Offer letter ✓ Due diligence
Listing remarks
We do not accept 3rd party applications or viewing requests. 3 Bedrooms, 2 Bath 1354 sqft Townhome in Kennewick This thoughtfully designed two-story residence offers 3 bedrooms, 2.5 bathrooms, and modern finishes throughout. The bright and inviting main level features an open-concept layout with durable hard-surface flooring, large windows, and plenty of natural light. The stylish kitchen is equipped with granite countertops, a subway tile backsplash, stainless steel appliances, and a convenient breakfast bar that's perfect for casual dining or entertaining. Upstairs, the spacious primary suite includes a private en suite bathroom and a walk-in closet. Two additional bedrooms offer comfort
Key facts
- Granite countertops
- Breakfast bar
- Open-concept layout
Tags
Property features AI
Finance
- Other: Information not provided
- Financial info: Information not provided
- HOA & community: Information not provided
Exterior
- Parking: 1 parking space (1 covered); 1-car garage
- Security: Information not provided
- Utilities: Information not provided
- Home design: Townhouse; Residential property; Two levels / 2 stories; New construction
- Construction: Information not provided
- Exterior features: Lot approximately 0.12 acres (5,227.2 sq ft); Zoned single-family residential
Interior
- Kitchen: Information not provided
- Bedrooms: Information not provided
- Flooring: Information not provided
- Bathrooms: 2 full bathrooms
- Heating & cooling: Information not provided
- Interior features: No basement
- Laundry & utility: Information not provided
Neighborhood map
What this means for you Summary
Snapshot
- This is a 3-bed/2.0-bath townhouse listed at $2k.
Deal economics
- At list price, monthly cash flow is $1k ($17k/yr) — positive.
- The deal already cash-flows at list — no discount required.
- Meets the 1% rule at list price ($2k rent vs $2k).
- Recommended offer: $2k (1.5% below list) — sets the bar for market timing.
- Cap rate 938.8% vs local median 3.3% in Kennewick — top-decile yield for the area; either an underpriced asset or a hidden risk that comps aren't pricing in. Stress-test before assuming the spread holds.
Location & tenants
- Location reads 78/100 on livability (#131 in WA, #2,599 nationally) — a middle-class / working-renter tenant base. Strengths: commute A+, housing A+, health & safety A; Watch: schools D+, amenities D+, crime F.
- Kennewick School District (urban): math 43% / reading 58% proficiency, ranked #141 of 291 in WA (top 48%) — acceptable for families but not a draw, mixed tenant base, ~2y average lease.
- Market conditions: Rents rising (+3.4%/yr); 286 active listings in the ZIP; 34 comparable units currently listed for rent nearby; rentals at typical pace (median 21d on market — plan ~3-4 weeks tenant-placement turnaround); 41% of comp listings sitting > 30 days — soft ceiling on asking rent; 1,532 units permitted in Benton County in 2024 (389 in 5+ unit buildings).
- This rent runs 34% of the median local income ($63k/yr) — at the standard rent-burdened threshold; future hikes will face affordability resistance.
Forward outlook
- Local home prices are declining (-3.0%/yr); year-one equity from $12 of loan paydown is wiped out by about $54 of value loss. Plan a longer hold.
- Benton County population projected at +32% by 2050 — long-run rental-demand tailwind backs the buy-and-hold thesis.
- At projected returns (-3.0% appreciation + 3.4% rent growth), your $503 cash investment doubles in ~1 year — after that, you're playing with house money.
Negotiation context
- It's been on market 16 days — a 2% lower offer ($2k) is reasonable based on typical stale-listing flexibility.
Risks & watch-outs
- Climate carrying-cost: extreme-heat days projected 7→15/yr by 2055 (HVAC capex compounding) — expect insurance premiums to compound above CPI over the hold.
Questions for the listing agent
- Is there a deadline driving the sale (1031 exchange, divorce, estate, relocation)? That informs how much negotiation room exists.
- Schools are D-rated, which usually means shorter tenancies and higher turnover. Who's the typical renter profile here, and what's been the actual vacancy rate?
- Crime grade is F in this area — have there been break-ins, vandalism, or insurance claims at this property in the last 3 years? What carrier currently insures it and at what premium?
- The area grade is low — what's the realistic commute time and amenity access for the typical tenant pool here? Any planned neighborhood developments (good or bad) we should know about?
- What's the average days-on-market for RENTAL listings here right now (not sales)? A rising rental-DOM trend means longer vacancies and softer asking-rent achievability than the comps imply.
- What's the recent tenant-quality profile in this submarket — average credit score on applications, eviction rate, late-payment / NSF rate, and stable-employment percentage? A property-management company in the area should have these aggregated.
- How much new for-sale + rental construction is in the pipeline within 1–3 miles? Heavy new supply typically softens prices + rents 12–24 months out; constrained supply supports both.
Investment metrics
- 1% rule
- 99.24% ✓
- Cap rate
- 938.81%
- Cash-on-cash
- 3330.41%
- DSCR
- 149.18
- GRM
- 0.1
CMA / ARV
- ARV (on-the-fly)
- $319,544
- Comps found
- 11
Show comp detail 11 sales within ~0.75 mi
| Address | Dist | Beds/Ba | Sqft | Sold | Price | $/sf | Match |
|---|---|---|---|---|---|---|---|
| 9 N Jefferson Pl #110 | 0.04mi | 3/2.5 | 1,408 (+4%) | 17mo | $1,745 | $1 | 76 |
| 80 S Dawes St Unit C St Unit C | 0.39mi | 3/2.5 | 1,258 (-7%) | 0mo | $303,000 | $241 | 68 |
| 21 N Jefferson Pl #120 | 0.04mi | 3/2.5 | 1,495 (+10%) | 18mo | $1,745 | $1 | 64 |
| 48 S Dawes St | 0.38mi | 3/2.5 | 1,490 (+10%) | 1mo | $313,000 | $210 | 63 |
| 100 S Dawes St , Unit D St | 0.40mi | 3/2.5 | 1,258 (-7%) | 7mo | $310,000 | $246 | 62 |
| 54 S Dawes St | 0.38mi | 3/2.0 | 1,440 (+6%) | 17mo | $340,000 | $236 | 57 |
| 60 S Dawes St | 0.40mi | 3/2.0 | 1,440 (+6%) | 17mo | $345,000 | $240 | 56 |
| 547 N Grant St | 0.36mi | 2/2.0 (-1) | 1,280 (-6%) | 18mo | $310,000 | $242 | 54 |
| 28 S Dawes St | 0.40mi | 3/2.5 | 1,490 (+10%) | 15mo | $332,000 | $223 | 51 |
| 40 S Dawes St | 0.38mi | 3/2.5 | 1,490 (+10%) | 22mo | $310,000 | $208 | 45 |
| 550 N Grant St | 0.37mi | 2/2.0 (-1) | 1,156 (-15%) | 12mo | $307,000 | $266 | 43 |
Match score weights: distance 35% · size 25% · config 20% · recency 20%. Top-matched comps best support the ARV.
Projected returns pro-forma
-3.0% appreciation · 3.39% rent growth · sell at horizon
- IRR
- —
- Equity multiple
- 178.63×
- Total profit
- $89,279
- Equity at exit
- $268
- IRR
- —
- Equity multiple
- 389.28×
- Total profit
- $195,151
- Equity at exit
- $155
Cash invested: $503 (down + closing). Projections, not guarantees.
Landlord ↔ Tenant lean methodology
- Overall (STATE)
- 28 Tenant-Leaning
- State Washington
- 28 Tenant-Leaning · D+8
- County
- — inherits STATE
- City
- — inherits STATE
ZIP-level market 99336
- Rents YoY
- 3.4%
- Active inventory
- 286
- Price-to-rent
- 0.1×
Monthly cashflow live
- Estimated rent
- $1,781 high interval (Pro) →
- Mortgage (P&I)
- −$9
- Tax est. 1.5%
- −$2 /mo · $27/yr
- Insurance
- −$1
- HOA
- −$0
- Vacancy / Maint / Mgmt
- −$374
- Net cashflow
- $1,395
Break-even live
UW: 25.0% down · 7.5% · 30yr · 1.5% tax · 5.0% vac · 8.0% maint · 8.0% mgmt
Financing live
Cash to close
- Down payment
- $449
- Closing costs
- $54
- Reserves months
- —
- Total cash needed
- —
Loan-product check · same deal, 3 products live
Conventional
25% down · 7.5% · 30yr
- Down + closing
- —
- Monthly P&I
- —
- Monthly cashflow
- —
- DSCR
- —
- Eligible?
- —
Personal DTI + credit; lowest rate.
DSCR
20% down · 8.5% · 30yr
- Down + closing
- —
- Monthly P&I
- —
- Monthly cashflow
- —
- DSCR
- —
- Eligible?
- —
No personal income docs; deal must DSCR.
Hard money
10% down · 12.0% · 12mo
- Down + closing
- —
- Monthly P&I
- —
- Monthly cashflow
- —
- DSCR
- —
- Eligible?
- —
Short-term bridge; refi at stabilization.
Rent comps 34 comps
| Address | Beds | Baths | Sqft | Rent | $/sqft | DOM | Units | Dist |
|---|---|---|---|---|---|---|---|---|
| 33 N Jefferson Pl Unit 110 Kennewick, WA | 3.0 | 2.5 | 1536 | $1,950 | $1.27 | 43d | 1 | 0.05mi |
| 5702 W Kennewick Pl #110 Kennewick, WA | 3.0 | 2.5 | 1435 | $1,695 | $1.18 | 13d | 1 | 0.10mi |
| 100 N Irving Pl Kennewick, WA | 1.0–3.0 | 1.0–1.5 | 939 | $1,750 | $1.86 | 13d | 11 | 0.14mi |
| 100 N Irving Pl Unit H101 Kennewick, WA | 3.0 | 1.5 | 1120 | $1,699 | $1.52 | 44d | 1 | 0.14mi |
| 100 N Irving Pl Unit K101 Kennewick, WA | 3.0 | 1.5 | 1120 | $1,700 | $1.52 | 44d | 1 | 0.14mi |
| 5100 W Clearwater Ave Kennewick, WA | 1.0–3.0 | 1.0–2.0 | 1068 | $1,843 | $1.72 | 13d | 6 | 0.43mi |
| 24 S Quay St Unit 3 Kennewick, WA | 3.0 | 1.5 | 1128 | $1,625 | $1.44 | 13d | 1 | 0.51mi |
| 6809 W Kennewick Ave Unit C Kennewick, WA | 2.0 | 1.0 | 1043 | $1,250 | $1.20 | 43d | 1 | 0.58mi |
| 318 N Arthur St Kennewick, WA | 2.0–3.0 | 2.0 | 1113 | $1,975 | $1.77 | 13d | 1 | 0.64mi |
| 460 N Arthur St Kennewick, WA | 2.0 | 1.0–2.0 | 749 | $1,700 | $2.27 | 13d | 7 | 0.65mi |
| 445 N Volland St Kennewick, WA | 1.0–2.0 | 1.0 | 735 | $1,294 | $1.76 | 13d | 7 | 0.80mi |
| 720 N Arthur St Kennewick, WA | 3.0 | 1.5 | 1200 | $1,545 | $1.29 | 13d | 9 | 0.82mi |
| 4711 W Metaline Ave Kennewick, WA | 1.0–2.0 | 1.0 | 777 | $1,525 | $1.96 | 21d | 7 | 0.90mi |
| 1102 N Cleveland St Unit D Kennewick, WA | 2.0 | 1.0 | 936 | $1,250 | $1.34 | 43d | 1 | 0.93mi |
| 4421 W Hood Ave Kennewick, WA | 2.0 | 1.5 | 942 | $1,412 | $1.50 | 13d | 3 | 0.94mi |
| 440 N Volland St Kennewick, WA | 1.0–3.0 | 1.0–1.5 | 958 | $1,600 | $1.67 | 13d | 7 | 0.98mi |
| E 6th Ave Kennewick, WA | 2.0 | 1.0 | 1100 | $1,500 | $1.36 | 43d | 1 | 1.00mi |
| 609 N Tweedt St Kennewick, WA | 2.0 | 1.0 | 950 | $1,295 | $1.36 | 13d | 1 | 1.01mi |
| 108 S Tweedt Pl Kennewick, WA | 2.0 | 2.0 | 1258 | $1,795 | $1.43 | 43d | 1 | 1.01mi |
| 4215 W 2nd Ave Kennewick, WA | 3.0 | 2.0 | 1348 | $2,595 | $1.93 | 43d | 1 | 1.02mi |
| 801 N Tweedt St Kennewick, WA | 1.0–2.0 | 1.0 | 779 | $1,350 | $1.73 | 21d | 3 | 1.08mi |
| 717 S Union St Kennewick, WA | 3.0 | 1.0 | 1340 | $1,895 | $1.41 | 43d | 1 | 1.09mi |
| 1148 N Yost St Kennewick, WA | 3.0 | 2.5 | 1324 | $1,863 | $1.41 | 21d | 1 | 1.10mi |
| 4108 W Albany Ave Unit A-D Kennewick, WA | 2.0 | 1.5 | 945 | $1,395 | $1.48 | 43d | 1 | 1.12mi |
| 1216 N Williams St Unit B Kennewick, WA | 2.0 | 1.5 | 1080 | $1,700 | $1.57 | 43d | 1 | 1.21mi |
| 3910 W Kennewick Ave Unit 3910 Kennewick, WA | 3.0 | 1.5 | 1645 | $1,800 | $1.09 | 43d | 1 | 1.26mi |
| 3703 W Kennewick Ave Kennewick, WA | 1.0–2.0 | 1.0 | 782 | $1,594 | $2.04 | 13d | 8 | 1.32mi |
| 7803 W Deschutes Ave Kennewick, WA | 1.0–3.0 | 1.0–2.0 | 925 | $2,010 | $2.17 | 13d | 13 | 1.35mi |
| 3887 W 7th Ave Unit B-230 Kennewick, WA | 3.0 | 2.0 | 1262 | $1,850 | $1.47 | 21d | 1 | 1.40mi |
| 12 S Morain St Kennewick, WA | 1.0–3.0 | 1.0 | 604 | $1,599 | $2.65 | 13d | 3 | 1.40mi |
| 502 S Florida Pl Kennewick, WA | 2.0 | 1.0 | 1003 | $1,850 | $1.84 | 43d | 1 | 1.40mi |
| 3708 W 6th Ave Unit B Kennewick, WA | 2.0 | 1.0 | 918 | $1,325 | $1.44 | 43d | 1 | 1.41mi |
| 400 S Morain St #7 Kennewick, WA | 3.0 | 2.5 | 1100 | $1,500 | $1.36 | 21d | 1 | 1.45mi |
| 7960 W 10th Ave Kennewick, WA | 1.0–2.0 | 1.0–2.0 | 946 | $2,345 | $2.48 | 13d | 9 | 1.46mi |
Listing history 13 events
-
2026-06-18days on market $1,795 Active 16 DOM
-
2026-06-17days on market $1,795 Active 15 DOM
-
2026-06-16days on market $1,795 Active 14 DOM
-
2026-06-15days on market $1,795 Active 13 DOM
-
2026-06-14days on market $1,795 Active 11 DOM
-
2026-06-13days on market $1,795 Active 10 DOM
-
2026-06-10days on market $1,795 Active 8 DOM
-
2026-06-09days on market $1,795 Active 7 DOM
-
2026-06-08days on market $1,795 Active 6 DOM
-
2026-06-07days on market $1,795 Active 5 DOM
-
2026-06-05days on market $1,795 Active 2 DOM
-
2026-06-03remarks 699-char remark
-
2026-06-03$1,795 Active 1 DOM
ⓘ Source: listings_history table (triggers on properties + properties_extension) + one-shot
backfill from property_details.listing_events for pre-trigger history.
Climate risk First Street
- Flood 1/10 Low FEMA zone X · 0% chance over 30 yrs
- Wildfire 4/10 Moderate
- Heat 5/10 Major 7 d/yr ≥98°F today · 15 d/yr by 30 yrs out
- Wind 1/10 Low
- Air quality 8/10 Severe 14 unhealthy d/yr today · 15 by 30 yrs out
Nearby sold comps map
Loading sold comps map…
Walkable amenities ~0.75 mi
Loading nearby amenities…
Taxation est. · year 1
- Rental income
- $21,377
- − Mortgage interest
- −$101
- − Property taxes
- −$27
- − Insurance
- −$9
- − Repairs & maintenance
- −$1,710
- − Management
- −$1,710
- − Depreciation
- −$52
- Taxable income
- $17,768
- Est. tax owed @ 24.0%
- −$4,264
- After-tax cash flow
- $12,474/yr
For passive investors: Depreciation is non-cash, so a rental often shows a tax loss while cash-flowing — sheltering income. Rental losses are passive: they offset passive income freely, and up to $25,000/yr can offset ordinary (W-2) income if you actively participate and your MAGI is under $100k (phasing out to $0 by $150k); unused losses carry forward. On sale, claimed depreciation is recaptured at up to 25%, and gains may owe capital-gains tax (a 1031 exchange can defer both). Figures are a year-1 estimate at your 24.0% rate — not tax advice; consult a CPA.
Schools (NCES district)
- District
- Kennewick School District
- NCES district ID
- 5303930
- Math proficiency
- 43% ▼ -1.00%
- Reading proficiency
- 58% ▬ 0.00%
- Median HH income
- $54,191
- Composite
- 45.56/100
- National rank
- #5667
- State rank
- #141 of 291 in WA
Livability — Kennewick
- Score
- 78/100
- State rank
- #131
- US rank
- #2599
Category grades
Schools grade is shown separately in the Schools card above.
Census & demographics
- Census place
- Kennewick, WA
- County
- Benton County · 186,895 people
- City population
- 104,655
- Metro
- Kennewick-Richland, WA
- Population (ZIP)
- 50,735
- Household income
- $62,527
- Rent vs Own
- Severe rent burden
- 2605.0
Population outlook (Benton County) Hauer SSP2
- Today (2025)
- 219,421 people
- By 2030
- 233,813 · +6.6%
- By 2040
- 262,134 · +19.5%
- By 2050
- 290,100 · +32.2%
- By 2075
- 363,525 · +65.7%
- By 2100
- 418,667 · +90.8%
Race, ethnicity, and origin ACS 2023
- Neighborhood character
- Diverse neighborhood (Simpson 0.56)
- Race & ethnicity
- White 55% Hispanic / Latino 37% Two or more races 15% Black 3% Asian 2% Native American 1%
- Hispanic origin (detail)
- Mexican 31% Cuban 2%
- Common ancestry
- Portuguese 4% Slovak 3% Romanian 1%
- Foreign-born
- 16% · Canada, Jamaica
- Languages at home
- 68% English-only · Spanish 29% Arabic 1%
Political lean MEDSL · Benton
- 2024 margin
- Strong R (+21.9) · D 37.7% · R 59.6% · Other 2.7%
- 2008→2024 swing
- +4.2pp toward D · 2008: -26.1pp · 2024: -21.9pp
- All cycles
- 2024: R+21.9 2020: R+21.0 2016: R+26.6 2012: R+27.0 2008: R+26.1
Not yet ingested
- Civics
- —
Market trends
- HPI YoY
- ▼ -408.26%
- Current HPI
- 256.1143
- Rent YoY
- ▲ 3.39%
- Metro
- Kennewick-Richland, WA
- State GDP YoY
- ▲ 4.65%
- F500 in state
- 22
Industry mix (Fortune 500 HQ in WA)
| Industry | F500 HQs | Revenue |
|---|---|---|
| Retail | 2 | $269B |
|
||
| Technology / Retail | 1 | $638B |
|
||
| Technology | 1 | $245B |
|
||
| Telecommunications | 1 | $38B |
|
||
| Food / Beverage | 1 | $36B |
|
||
| Automotive / Trucks | 1 | $34B |
|
||
Price history
1 event — show timeline
- 2026-06-01 Listed $1,795 PACMLS
Cash-flow waterfall
monthlySold comps — $/sqft
last 12 mo · ≤1 miLoading sold comps…