None · Williamsburg, FL
Flood risk No data
- FEMA flood zone
- —
- Chance of flooding over 30 yrs
- —
- Est. flood insurance / yr
- —
Fire risk No data
- Est. fire insurance / yr
- —
Heat risk No data
- Hot days now (above threshold)
- —
- Hot days in 30 yrs
- —
Wind risk No data
- Chance of severe wind over 30 yrs
- —
Air-quality risk No data
- Unhealthy air days now
- —
- Unhealthy air days in 30 yrs
- —
Risk factors via First Street. Map © Google.
Why this score? — see what drove the B grade
The composite is a weighted blend of 9 inputs, each scored 0–100. Each bar is that input's sub-score; the figure is the points it added to the 100-point composite (weight × sub-score).
- Cash flow +30.0/30.0
- DSCR +10.0/10.0
- 1% rule +8.9/10.0
- ARV discount +7.5/15.0
- Appreciation +5.1/10.0
- Livability +4.2/5.0
- Schools +4.1/10.0
- Condition / age +2.5/5.0
- Rent growth +1.7/5.0
$110,000
🖨 Deal sheet 📄 Offer letter ✓ Due diligence
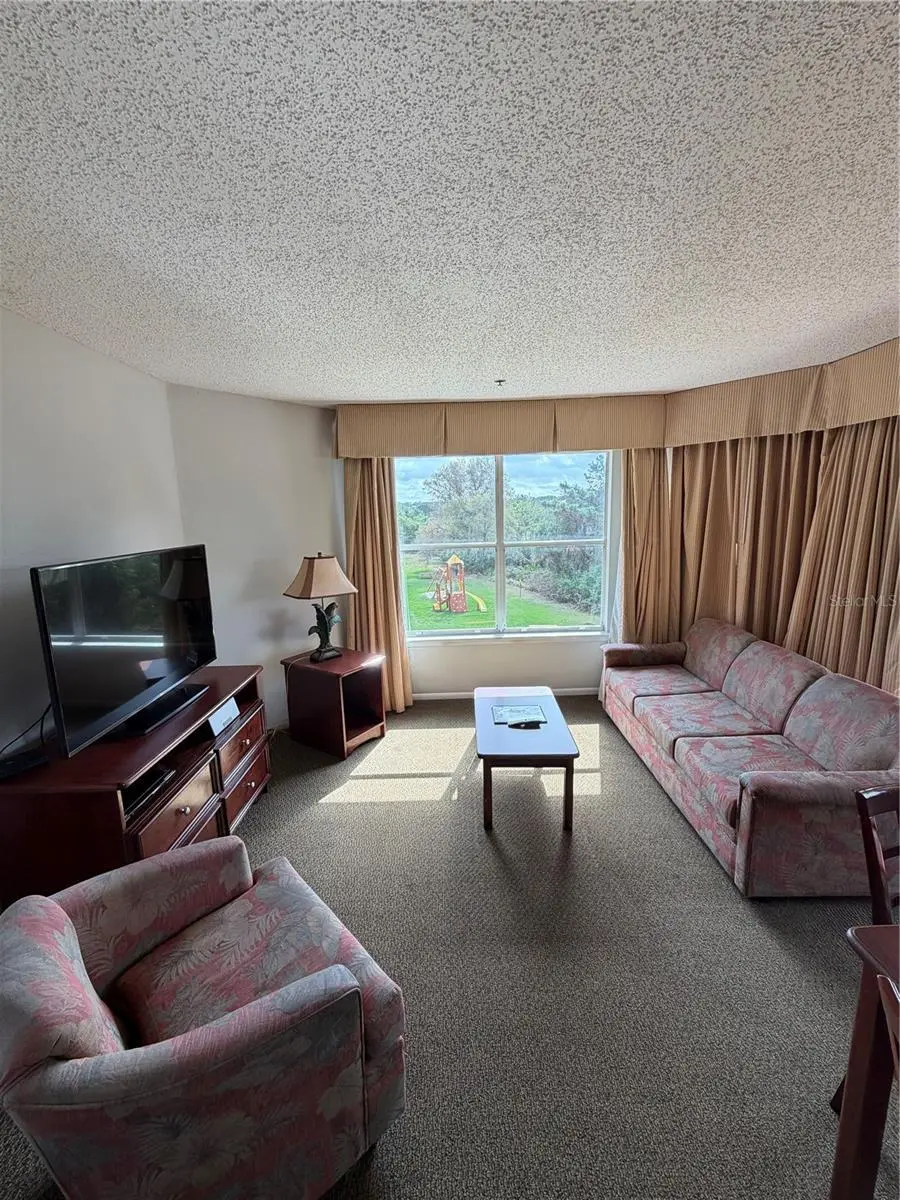
Listing remarks
Turnkey Investment Opportunity in Prime Orlando Location! Beautifully maintained condo located in the highly desirable area of Orlando, just minutes from world-renowned attractions, shopping, dining, and major highways. This well-appointed unit offers a functional layout with comfortable living space, abundant natural light, and a private balcony perfect for relaxing. Ideal for investors or end users, the property is fully equipped and ready for immediate use. Enjoy access to resort-style amenities and a prime location that attracts consistent demand year-round. Whether you’re looking for a vacation property or income-producing asset, this is an excellent opportunity in the heart of C
Key facts
- Private balcony
- Prime location
- $49 HOA
Tags
Property features AI
Finance
- Other: Property type: Residential (Condo - Hotel); Zoning: P-D; Furnished; Total acreage approximately 0.34 acres; Asphalt road surface; Total rooms: 5; Living area about 546 square feet; Total stories in building: 4
- HOA & community: Parc Corniche Condominium Association; HOA fee $594 annually ($49.50 monthly); Association fee required; Community features: Airport/Runway, Park; Pets not allowed
Exterior
- Parking: 1-car garage
- Utilities: Public water; No sewer (listed as none); Cable available; Electricity available
- Home design: Residential condo-hotel; One level; Faces west; Located on 3rd floor (unit on 3rd floor)
- Construction: Block and concrete construction; Shingle roof; Concrete perimeter foundation and slab
- Exterior features: Balcony; Outdoor shower; Exterior lighting; Sidewalks
Interior
- Kitchen: Cooktop; Range; Microwave; Dishwasher; Refrigerator; Electric water heater
- Bedrooms: 1 bedroom
- Flooring: Carpet; Ceramic tile
- Bathrooms: 1 full bathroom
- Heating & cooling: Central heating (electric); Central air conditioning
- Interior features: Ceiling fans; Living room/dining room combo; Building has elevator
- Laundry & utility: Laundry located outside
Neighborhood map
What this means for you Summary
Snapshot
- This is a 1-bed/1.0-bath condo listed at $110k.
Deal economics
- At list price, monthly cash flow is $439 ($5k/yr) — positive.
- The deal already cash-flows at list — no discount required.
- Meets the 1% rule at list price ($2k rent vs $110k).
- Recommended offer: $103k (6.0% below list) — sets the bar for market timing.
- Cap rate 11.1% vs local median 3.9% in Williamsburg — top-decile yield for the area; either an underpriced asset or a hidden risk that comps aren't pricing in. Stress-test before assuming the spread holds.
Location & tenants
- Location reads 85/100 on livability (#29 in FL, #608 nationally) — a professional / high-income tenant draw. Strengths: housing A+, health & safety A+, crime A; Watch: amenities D, schools F.
- Orange (suburban): math 46% / reading 51% proficiency, ranked #43 of 73 in FL (top 59%) — families likely to look elsewhere, expect single-tenant / working-renter base with shorter leases.
- Market conditions: Rents falling (-3.2%/yr); 275 active listings in the ZIP; 14 comparable units currently listed for rent nearby; rentals leasing fast (median 3d on market — plan ~1-2 weeks tenant-placement turnaround); 8,053 units permitted in Orange County in 2024 (3,133 in 5+ unit buildings).
Forward outlook
- In year one you build about $1k of equity ($761 loan paydown + $326 appreciation (0.3% local appreciation)).
- Orange County population projected at +52% by 2050 — long-run rental-demand tailwind backs the buy-and-hold thesis.
- At projected returns (0.3% appreciation + 0.0% rent growth), your $31k cash investment doubles in ~5 years — after that, you're playing with house money.
Negotiation context
- It's been on market 80 days — a 6% lower offer ($103k) is reasonable based on typical stale-listing flexibility.
Questions for the listing agent
- It's been on market 80 days. Have you received any prior offers? Is the seller open to a 6% concession, seller financing, or rate buy-down credit?
- What does the HOA fee cover, when was the last increase, and are there any pending special assessments or reserve-fund shortfalls?
- Any open or pending special assessments — roof, HVAC, plumbing, elevator, façade? What's the per-unit balance and payoff schedule, and is the seller paying it off at close or rolling it to the buyer?
- Why hasn't it sold? Are there any deal-killer items the seller is aware of (foundation, flood, title, zoning, code violations)?
- Is there a deadline driving the sale (1031 exchange, divorce, estate, relocation)? That informs how much negotiation room exists.
- Schools are F-rated, which usually means shorter tenancies and higher turnover. Who's the typical renter profile here, and what's been the actual vacancy rate?
- What's the average days-on-market for RENTAL listings here right now (not sales)? A rising rental-DOM trend means longer vacancies and softer asking-rent achievability than the comps imply.
- What's the recent tenant-quality profile in this submarket — average credit score on applications, eviction rate, late-payment / NSF rate, and stable-employment percentage? A property-management company in the area should have these aggregated.
- How much new apartment / multifamily construction is in the pipeline within 1–3 miles? Heavy new supply (>2% of stock underway) typically softens rents 12–24 months out; light construction supports rent growth.
Investment metrics
- 1% rule
- 1.39% ✓
- Cap rate
- 11.08%
- Cash-on-cash
- 17.11%
- DSCR
- 1.76
- GRM
- 6.0
CMA / ARV
No comps found within radius.
Projected returns pro-forma
0.3% appreciation · 0.0% rent growth · sell at horizon
- IRR
- 14.9%
- Equity multiple
- 1.71×
- Total profit
- $21,835
- Equity at exit
- $33,583
- IRR
- 17.1%
- Equity multiple
- 2.75×
- Total profit
- $53,989
- Equity at exit
- $41,703
Cash invested: $30,800 (down + closing). Projections, not guarantees.
Landlord ↔ Tenant lean methodology
- Overall (STATE)
- 87 Strongly Landlord-Friendly
- State Florida
- 87 Strongly Landlord-Friendly · R+3
- County
- — inherits STATE
- City
- — inherits STATE
ZIP-level market 32821
- Home prices YoY
- 0.1%
- Rents YoY
- -3.2%
- Active inventory
- 275
- Price-to-rent
- 6.0×
Monthly cashflow live
- Estimated rent
- $1,533 high interval (Pro) →
- Mortgage (P&I)
- −$577
- Tax from tax record
- −$100 /mo · $1,202/yr
- Insurance
- −$46
- HOA
- −$49
- Vacancy / Maint / Mgmt
- −$322
- Net cashflow
- $439
Break-even live
UW: 25.0% down · 7.5% · 30yr · 1.5% tax · 5.0% vac · 8.0% maint · 8.0% mgmt
Financing live
Cash to close
- Down payment
- $27,500
- Closing costs
- $3,300
- Reserves months
- —
- Total cash needed
- —
Loan-product check · same deal, 3 products live
Conventional
25% down · 7.5% · 30yr
- Down + closing
- —
- Monthly P&I
- —
- Monthly cashflow
- —
- DSCR
- —
- Eligible?
- —
Personal DTI + credit; lowest rate.
DSCR
20% down · 8.5% · 30yr
- Down + closing
- —
- Monthly P&I
- —
- Monthly cashflow
- —
- DSCR
- —
- Eligible?
- —
No personal income docs; deal must DSCR.
Hard money
10% down · 12.0% · 12mo
- Down + closing
- —
- Monthly P&I
- —
- Monthly cashflow
- —
- DSCR
- —
- Eligible?
- —
Short-term bridge; refi at stabilization.
Rent comps 14 comps
| Address | Beds | Baths | Sqft | Rent | $/sqft | DOM | Units | Dist |
|---|---|---|---|---|---|---|---|---|
| 6600 Banner Lake Cir Orlando, FL | 1.0–3.0 | 1.0–2.0 | 975 | $1,199 | $1.23 | 1d | 18 | 0.32mi |
| 11508 Westwood Blvd #313 Orlando, FL | 1.0 | 1.0 | 715 | $2,800 | $3.92 | 23d | 1 | 0.54mi |
| 6902 Villa De Costa Dr Orlando, FL | 2.0 | 2.0 | 738 | $1,500 | $2.03 | 13d | 1 | 0.56mi |
| 6820 Axis West Cir Orlando, FL | 1.0–3.0 | 1.0–2.0 | 1033 | $1,845 | $1.79 | 2d | 18 | 0.81mi |
| 6801 Integra Cove Blvd Orlando, FL | 3.0 | 1.0–2.0 | 966 | $1,921 | $1.99 | 2d | 30 | 0.82mi |
| 6739 Mission Club Blvd Orlando, FL | 1.0–3.0 | 1.0–2.0 | 947 | $1,305 | $1.38 | 1d | 24 | 0.96mi |
| 6260 Juniper Pine Way Orlando, FL | 1.0–3.0 | 1.0–2.0 | 1094 | $1,753 | $1.60 | 2d | 32 | 1.08mi |
| 6701 Westwood Blvd Orlando, FL | 1.0–2.0 | 1.0–2.0 | 735 | $1,099 | $1.50 | 2d | 6 | 1.09mi |
| 7010 Bayfront Scenic Dr Orlando, FL | 1.0–2.0 | 1.0–2.0 | 903 | $1,725 | $1.91 | 2d | 21 | 1.22mi |
| 12515 Lake Square Cir Orlando, FL | 1.0–3.0 | 1.0–2.0 | 1087 | $1,475 | $1.36 | 1d | 21 | 1.33mi |
| 7511 Solstice Cir Orlando, FL | 3.0 | 1.0–2.0 | 1168 | $2,110 | $1.81 | 2d | 36 | 1.35mi |
| 11115 S Beach Cir Orlando, FL | 1.0–3.0 | 1.0–2.0 | 1116 | $1,814 | $1.63 | 1d | 50 | 1.39mi |
| 7119 Sand Lake Reserve Dr Orlando, FL | 1.0–3.0 | 1.0–2.0 | 1041 | $1,780 | $1.71 | 1d | 17 | 1.40mi |
| 10535 Hamilton Dawn St Orlando, FL | 1.0–2.0 | 1.0–2.0 | 936 | $1,663 | $1.78 | 2d | 22 | 1.40mi |
HOA detail condo
- Monthly dues
- $49 · $588/yr
- Assessments
- None detected in remarks — confirm with the listing agent.
Listing history 15 events
-
2026-06-18days on market $110,000 Active 80 DOM
-
2026-06-17days on market $110,000 Active 79 DOM
-
2026-06-16days on market $110,000 Active 78 DOM
-
2026-06-15days on market $110,000 Active 77 DOM
-
2026-06-13days on market $110,000 Active 75 DOM
-
2026-06-13days on market $110,000 Active 74 DOM
-
2026-06-09days on market $110,000 Active 71 DOM
-
2026-06-08days on market $110,000 Active 70 DOM
-
2026-06-07days on market $110,000 Active 69 DOM
-
2026-06-04days on market $110,000 Active 66 DOM
-
2026-06-03days on market $110,000 Active 65 DOM
-
2026-06-02days on market $110,000 Active 64 DOM
-
2026-06-02days on market $110,000 Active 63 DOM
-
2026-05-31days on market $110,000 Active 62 DOM
-
2026-03-30$110,000 Active
ⓘ Source: listings_history table (triggers on properties + properties_extension) + one-shot
backfill from property_details.listing_events for pre-trigger history.
Tax reassessment forecast FL · Resets to sale price
- Current annual tax
- $1,202 · $100/mo
- Projected year-2 tax
- $1,202 · $100/mo
- Expected delta
- $0/yr ($0/mo · 0.0%)
ⓘ Screening estimate from a state-policy table — verify with the county assessor before closing.
Nearby sold comps map
Loading sold comps map…
Walkable amenities ~0.75 mi
Loading nearby amenities…
Taxation est. · year 1
- Rental income
- $18,395
- − Mortgage interest
- −$6,162
- − Property taxes
- −$1,202
- − Insurance
- −$550
- − Repairs & maintenance
- −$1,472
- − Management
- −$1,472
- − HOA
- −$588
- − Depreciation
- −$3,200
- Taxable income
- $3,750
- Est. tax owed @ 24.0%
- −$900
- After-tax cash flow
- $4,370/yr
For passive investors: Depreciation is non-cash, so a rental often shows a tax loss while cash-flowing — sheltering income. Rental losses are passive: they offset passive income freely, and up to $25,000/yr can offset ordinary (W-2) income if you actively participate and your MAGI is under $100k (phasing out to $0 by $150k); unused losses carry forward. On sale, claimed depreciation is recaptured at up to 25%, and gains may owe capital-gains tax (a 1031 exchange can defer both). Figures are a year-1 estimate at your 24.0% rate — not tax advice; consult a CPA.
Schools (NCES district)
- District
- Orange
- NCES district ID
- 1201440
- Math proficiency
- 46% ▼ -9.00%
- Reading proficiency
- 51% ▼ -2.00%
- Median HH income
- $49,350
- Composite
- 41.47/100
- National rank
- #3461
- State rank
- #43 of 73 in FL
Livability — Williamsburg
- Score
- 85/100
- State rank
- #29
- US rank
- #608
Category grades
Schools grade is shown separately in the Schools card above.
Census & demographics
- County
- Orange County · 1,471,359 people
- Metro
- Orlando-Kissimmee-Sanford, FL
- Population (ZIP)
- 26,161
- Household income
- $69,348
- Rent vs Own
- Severe rent burden
- 1840.0
Population outlook (Orange County) Hauer SSP2
- Today (2025)
- 1,618,226 people
- By 2030
- 1,787,404 · +10.5%
- By 2040
- 2,125,621 · +31.4%
- By 2050
- 2,454,016 · +51.6%
- By 2075
- 3,173,711 · +96.1%
- By 2100
- 3,607,781 · +122.9%
Race, ethnicity, and origin ACS 2023
- Neighborhood character
- Diverse neighborhood (Simpson 0.65)
- Race & ethnicity
- White 43% Hispanic / Latino 41% Two or more races 19% Black 6% Asian 3% Pacific Islander 1% Native American 1%
- Hispanic origin (detail)
- Mexican 3% Puerto Rican 11% Cuban 1% Dominican 4%
- Common ancestry
- Romanian 3% Lithuanian 2% Estonian 2%
- Foreign-born
- 29% · Canada, Jamaica, China
- Languages at home
- 58% English-only · Spanish 32% Other Indo-European 4% Other Asian/Pacific 2%
Political lean MEDSL · Orange
- 2024 margin
- D (+13.6) · D 56.1% · R 42.5% · Other 1.3%
- 2008→2024 swing
- -5.0pp toward R · 2008: 18.6pp · 2024: 13.6pp
- All cycles
- 2024: D+13.6 2020: D+23.1 2016: D+24.6 2012: D+18.2 2008: D+18.6
Not yet ingested
- Civics
- —
Market trends
- HPI YoY
- ▲ 0.30%
- Current HPI
- 300.2268
- Rent YoY
- ▼ -3.20%
- Metro
- Orlando-Kissimmee-Sanford, FL
- State GDP YoY
- ▲ 3.28%
- F500 in state
- 36
Industry mix (Fortune 500 HQ in FL)
| Industry | F500 HQs | Revenue |
|---|---|---|
| Industrial Technology | 2 | $29B |
|
||
| Insurance | 2 | $17B |
|
||
| Retail | 1 | $60B |
|
||
| Technology Distribution | 1 | $58B |
|
||
| Homebuilding | 1 | $35B |
|
||
| Technology Manufacturing | 1 | $35B |
|
||
Price history
1 event — show timeline
- 2026-03-30 Listed $110,000 Stellar MLS as Distributed by MLS Grid
Property tax history
+5.9%/yrLatest (2025): $1,202 · +0.0% YoY. Source: county tax records.
Cash-flow waterfall
monthlySold comps — $/sqft
last 12 mo · ≤1 miLoading sold comps…