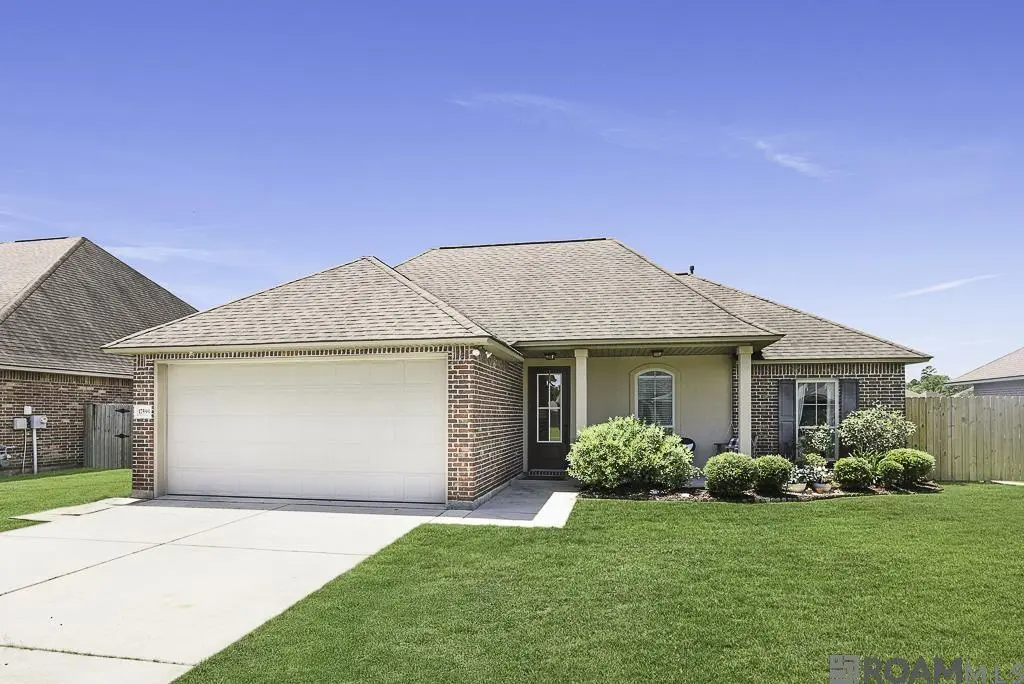
17599 Golden Eagle Dr · Prairieville, LA
Flood risk 1/10 · Minimal
- FEMA flood zone
- X
- Chance of flooding over 30 yrs
- 0.0%
- Est. flood insurance / yr
- $507 – $1,088
Fire risk 1/10 · Minimal
- Est. fire insurance / yr
- $1,269 – $2,357
Heat risk 8/10 · Major
- Hot days now (above 108°F)
- 7 days/yr
- Hot days in 30 yrs
- 22 days/yr
Wind risk 9/10 · Severe
- Chance of severe wind over 30 yrs
- 99.0%
Air-quality risk 2/10 · Minimal
- Unhealthy air days now
- 2 days/yr
- Unhealthy air days in 30 yrs
- 2 days/yr
Risk factors via First Street. Map © Google.
Why this score? — see what drove the C- grade
The composite is a weighted blend of 9 inputs, each scored 0–100. Each bar is that input's sub-score; the figure is the points it added to the 100-point composite (weight × sub-score).
- Cash flow +17.6/30.0
- ARV discount +9.2/15.0
- DSCR +5.5/10.0
- Schools +4.7/10.0
- 1% rule +4.2/10.0
- Livability +3.5/5.0
- Rent growth +3.4/5.0
- Condition / age +2.5/5.0
- Appreciation +0.0/10.0
$269,900
🖨 Deal sheet (PDF) 📄 Offer letter ✓ Due diligence
Listing remarks MLS
Welcome home to this beautifully maintained 4-bedroom residence in the desirable Eagles Landing subdivision in Prairieville. This inviting home offers charming curb appeal with sidewalks and curb-and-gutter, setting the tone for a welcoming community atmosphere. Step inside to an open floor plan with tall ceilings, recessed lighting, and elegant architectural details, including an accent wall with arched entryways. The spacious living area is highlighted by a cozy gas-log fireplace, laminate wood flooring, crown molding, and a wall of windows that fills the home with natural light. The kitchen features richly stained wood cabinetry, granite countertops, a custom tile backsplash, a gas cooktop, and stainless steel appliances. Just off the kitchen, the dining area provides the perfect space for hosting family gatherings or entertaining guests. The private master suite offers a relaxing retreat with a tray ceiling, while the en suite bath features double vanities, his-and-hers walk-in closets, a large soaking tub, and a separate shower. Enjoy outdoor living at its finest with an extended covered patio, plus an additional open patio overlooking the private, fully fenced backyard, ideal for relaxing evenings or weekend get-togethers. This home combines comfort, style, and functionality. Subdivision offers curb and gutter streets plus subdivision sidewalks and a COMMUNITY POOL. Pool has tanning deck area & swimming area. There's also a bathhouse, green space and a playground.Schedule your private showing today!
Key facts
- Open floor plan
- Charming curb appeal
- Granite countertops
Tags
Property features AI
Finance
- Other: Subdivision: Eagles Landing; Directions available
- HOA & community: Homeowners association with annual fee (approximately $400/year); HOA covers grounds maintenance; Community amenities: clubhouse, pool, playground, sidewalks
Exterior
- Parking: Attached garage with garage door opener (2 parking spaces total)
- Utilities: Public water; Cable connected
- Home design: Single-family residence (detached)
- Construction: Vinyl siding, frame, and brick construction; Shingle roof; Slab foundation; Built on a level lot (72 x 150 frontage)
- Exterior features: Lighting; Covered patio and porch; Full privacy wood fence; Level lot
Interior
- Kitchen: Gas cooktop; Range; Oven; Dishwasher; Microwave; Disposal; Stainless steel appliances
- Flooring: Tile; Ceramic tile; Laminate
- Bathrooms: 2 full bathrooms
- Heating & cooling: Central heating; Central air; Ceiling fans
- Interior features: Crown molding; High ceilings; Gas log fireplace (1)
- Laundry & utility: Washer hookup inside; Electric dryer hookup
Neighborhood map
What this means for you Summary
Snapshot
- This is a 4-bed/2.0-bath single-family listed at $270k.
Deal economics
- At list price, monthly cash flow is $212 ($3k/yr) — positive.
- The deal already cash-flows at list — no discount required.
- To meet the 1% rule (rent ≥ 1% of price), the offer needs to be $248k (8.3% below list).
- Recommended offer: $248k (8.3% below list) — sets the bar for 1% rule.
- Cap rate 7.2% vs local median 4.3% in Prairieville — top-decile yield for the area; either an underpriced asset or a hidden risk that comps aren't pricing in. Stress-test before assuming the spread holds.
Location & tenants
- Location reads 69/100 on livability (#70 in LA) — a middle-class / working-renter tenant base. Strengths: schools A+, employment A+, housing A+; Watch: amenities F, commute F, health & safety F.
- Ascension Parish (suburban): math 48% / reading 58% proficiency, ranked #7 of 98 in LA (top 7%) — acceptable for families but not a draw, mixed tenant base, ~2y average lease.
- Market conditions: Rents rising (+3.5%/yr); 496 active listings in the ZIP; 2 comparable units currently listed for rent nearby; solid renter incomes; 579 units permitted in Ascension Parish in 2024 (0 in 5+ unit buildings).
Forward outlook
- Local home prices are declining (-3.0%/yr); year-one equity from $2k of loan paydown is wiped out by about $8k of value loss. Plan a longer hold.
- Ascension County population projected at +43% by 2050 — long-run rental-demand tailwind backs the buy-and-hold thesis.
Negotiation context
- It's been on market 16 days — a 2% lower offer ($266k) is reasonable based on typical stale-listing flexibility.
- 7 sale attempts since 10y ago with the ask held roughly flat each time — persistent listings suggest the price (not the market) is what's stuck; bring a comps-based counter.
Risks & watch-outs
- Climate carrying-cost: severe wind risk, 99% chance of damaging wind over 30y; extreme-heat days projected 7→22/yr by 2055 (HVAC capex compounding) — expect insurance premiums to compound above CPI over the hold.
Questions for the listing agent
- What does the HOA fee cover, when was the last increase, and are there any pending special assessments or reserve-fund shortfalls?
- Is there a deadline driving the sale (1031 exchange, divorce, estate, relocation)? That informs how much negotiation room exists.
- Schools are A-rated — typically a magnet for longer-tenancy family renters. What's the average tenant stay here, and is there a school-zone premium baked into asking?
- What's the average days-on-market for RENTAL listings here right now (not sales)? A rising rental-DOM trend means longer vacancies and softer asking-rent achievability than the comps imply.
- What's the recent tenant-quality profile in this submarket — average credit score on applications, eviction rate, late-payment / NSF rate, and stable-employment percentage? A property-management company in the area should have these aggregated.
- How much new for-sale + rental construction is in the pipeline within 1–3 miles? Heavy new supply typically softens prices + rents 12–24 months out; constrained supply supports both.
Investment metrics
- 1% rule
- 0.92% ✗
- Cap rate
- 7.24%
- Cash-on-cash
- 3.37%
- DSCR
- 1.15
- GRM
- 9.1
CMA / ARV
- ARV (on-the-fly)
- $280,350
- Comps found
- 12
Show comp detail 12 sales within ~0.75 mi
| Address | Dist | Beds/Ba | Sqft | Sold | Price | $/sf | Match |
|---|---|---|---|---|---|---|---|
| 17604 Hoods Ridge Dr | 0.13mi | 3/2.0 (-1) | 1,476 (-8%) | 0mo | $269,900 | $183 | 76 |
| 17657 Golden Eagle Dr | 0.11mi | 3/2.0 (-1) | 1,707 (+7%) | 8mo | $230,000 | $135 | 72 |
| 42021 Majestic Hunter Ave | 0.21mi | 4/2.0 | 1,830 (+14%) | 4mo | $277,000 | $151 | 64 |
| 42192 Eagles View Ln | 0.29mi | 3/2.0 (-1) | 1,785 (+11%) | 0mo | $310,000 | $174 | 62 |
| 18059 Kenner Dr | 0.39mi | 3/2.0 (-1) | 1,650 (+3%) | 12mo | $270,000 | $164 | 62 |
| 17596 Simpson Rd | 0.33mi | 3/2.0 (-1) | 1,687 (+5%) | 12mo | $275,000 | $163 | 60 |
| 17346 Hillstone Dr | 0.59mi | 3/2.0 (-1) | 1,599 (-0%) | 12mo | $290,000 | $181 | 57 |
| 17372 E Autumn Dr | 0.66mi | 4/2.0 | 1,622 (+1%) | 12mo | $284,900 | $176 | 57 |
| 18049 Diaz Rd | 0.52mi | 3/2.0 (-1) | 1,755 (+10%) | 3mo | $340,000 | $194 | 52 |
| 18077 Wilkes Dr | 0.46mi | 3/2.0 (-1) | 1,784 (+11%) | 8mo | $340,000 | $191 | 48 |
| 41145 1st Colonial St | 0.75mi | 3/2.0 (-1) | 1,470 (-8%) | 1mo | $220,000 | $150 | 46 |
| 41409 Stonebrook Ave | 0.67mi | 3/2.0 (-1) | 1,823 (+14%) | 11mo | $319,000 | $175 | 32 |
Match score weights: distance 35% · size 25% · config 20% · recency 20%. Top-matched comps best support the ARV.
Projected returns pro-forma
-3.0% appreciation · 3.47% rent growth · sell at horizon
- IRR
- -10.5%
- Equity multiple
- 0.62×
- Total profit
- $-29,063
- Equity at exit
- $40,243
- IRR
- -0.6%
- Equity multiple
- 0.96×
- Total profit
- $-3,161
- Equity at exit
- $23,336
Cash invested: $75,572 (down + closing). Projections, not guarantees.
Landlord ↔ Tenant lean methodology
- Overall (STATE)
- 90 Strongly Landlord-Friendly
- State Louisiana
- 90 Strongly Landlord-Friendly · R+12
- County
- — inherits STATE
- City
- — inherits STATE
ZIP-level market 70769
- Rents YoY
- 3.5%
- Active inventory
- 496
- Price-to-rent
- 9.1×
Monthly cashflow live
- Estimated rent
- $2,476 medium interval (Pro) →
- Mortgage (P&I)
- −$1,415
- Tax from tax record
- −$182 /mo · $2,188/yr
- Insurance
- −$112
- HOA
- −$33
- Vacancy / Maint / Mgmt
- −$520
- Net cashflow
- $212
Break-even live
Sensitivity live
| Price | -10% $365 | -5% $289 | +0% $212 | +5% $136 | +10% $60 |
|---|---|---|---|---|---|
| Rent | -10% $17 | -5% $115 | +0% $212 | +5% $310 | +10% $408 |
| Rate | -1.0pp $348 | -0.5pp $281 | base $212 | +0.5pp $143 | +1.0pp $71 |
UW: 25.0% down · 7.5% · 30yr · 1.5% tax · 5.0% vac · 8.0% maint · 8.0% mgmt
Financing live
Cash to close
- Down payment
- $67,475
- Closing costs
- $8,097
- Reserves months
- —
- Total cash needed
- —
Loan-product check · same deal, 3 products live
Conventional
25% down · 7.5% · 30yr
- Down + closing
- —
- Monthly P&I
- —
- Monthly cashflow
- —
- DSCR
- —
- Eligible?
- —
Personal DTI + credit; lowest rate.
DSCR
20% down · 8.5% · 30yr
- Down + closing
- —
- Monthly P&I
- —
- Monthly cashflow
- —
- DSCR
- —
- Eligible?
- —
No personal income docs; deal must DSCR.
Hard money
10% down · 12.0% · 12mo
- Down + closing
- —
- Monthly P&I
- —
- Monthly cashflow
- —
- DSCR
- —
- Eligible?
- —
Short-term bridge; refi at stabilization.
Rent comps 2 comps
| Address | Beds | Baths | Sqft | Rent | $/sqft | DOM | Units | Dist |
|---|---|---|---|---|---|---|---|---|
| 17414 Berkshire Dr Prairieville, LA | 3.0 | 2.0 | 1575 | $1,900 | $1.21 | 24d | 1 | 0.97mi |
| 17455 Berkshire Dr Prairieville, LA | 3.0 | 2.0 | 1279 | $1,850 | $1.45 | 45d | 1 | 1.02mi |
HOA detail
- Monthly dues
- $33 · $396/yr
- Likely covers
- gaspool
Listing history 11 events
-
2026-06-21days on market $269,900 Active 16 DOM
-
2026-06-18days on market $269,900 Active 13 DOM
-
2026-06-17days on market $269,900 Active 12 DOM
-
2026-06-16days on market $269,900 Active 11 DOM
-
2026-06-15days on market $269,900 Active 10 DOM
-
2026-06-14pricedays on market $269,900 Active 8 DOM
-
2026-06-10days on market $275,000 Active 5 DOM
-
2026-06-09days on market $275,000 Active 4 DOM
-
2026-06-08days on market $275,000 Active 3 DOM
-
2026-06-07remarks 699-char remark
-
2026-06-07$275,000 Active 2 DOM
ⓘ Source: listings_history table (triggers on properties + properties_extension) + one-shot
backfill from property_details.listing_events for pre-trigger history.
Tax reassessment forecast LA · Resets to sale price
- Current annual tax
- $2,188 · $182/mo
- Projected year-2 tax
- $2,188 · $182/mo
- Expected delta
- $0/yr ($0/mo · 0.0%)
ⓘ Screening estimate from a state-policy table — verify with the county assessor before closing.
Climate risk First Street
- Flood 1/10 Low FEMA zone X · 0% chance over 30 yrs
- Wildfire 1/10 Low
- Heat 8/10 Severe 7 d/yr ≥108°F today · 22 d/yr by 30 yrs out
- Wind 9/10 Extreme 99% chance of damaging wind over 30 yrs
- Air quality 2/10 Low 2 unhealthy d/yr today · 2 by 30 yrs out
Nearby sold comps map
Loading sold comps map…
Walkable amenities ~0.75 mi
Loading nearby amenities…
Taxation est. · year 1
- Rental income
- $29,706
- − Mortgage interest
- −$15,119
- − Property taxes
- −$2,188
- − Insurance
- −$1,350
- − Repairs & maintenance
- −$2,377
- − Management
- −$2,377
- − HOA
- −$396
- − Depreciation
- −$7,852
- Taxable loss
- −$1,950
- Est. tax savings @ 24.0%
- +$468
- After-tax cash flow
- $3,018/yr
For passive investors: Depreciation is non-cash, so a rental often shows a tax loss while cash-flowing — sheltering income. Rental losses are passive: they offset passive income freely, and up to $25,000/yr can offset ordinary (W-2) income if you actively participate and your MAGI is under $100k (phasing out to $0 by $150k); unused losses carry forward. On sale, claimed depreciation is recaptured at up to 25%, and gains may owe capital-gains tax (a 1031 exchange can defer both). Figures are a year-1 estimate at your 24.0% rate — not tax advice; consult a CPA.
Schools (NCES district)
- District
- Ascension Parish
- NCES district ID
- 2200090
- Math proficiency
- 48% ▼ -31.00%
- Reading proficiency
- 58% ▼ -25.00%
- Median HH income
- $68,423
- Composite
- 47.0/100
- National rank
- #2347
- State rank
- #7 of 98 in LA
Livability — Prairieville
- Score
- 69/100
- State rank
- #70
- US rank
- #8507
Category grades
Schools grade is shown separately in the Schools card above.
Census & demographics
- County
- Ascension Parish · 98,362 people
- City population
- 49,278
- Metro
- Baton Rouge, LA
- Population (ZIP)
- 49,278
- Household income
- $109,404
- Rent vs Own
- Severe rent burden
- 91.0
Population outlook (Ascension County) Hauer SSP2
- Today (2025)
- 145,480 people
- By 2030
- 158,329 · +8.8%
- By 2040
- 183,741 · +26.3%
- By 2050
- 207,615 · +42.7%
- By 2075
- 260,244 · +78.9%
- By 2100
- 289,576 · +99.0%
Race, ethnicity, and origin ACS 2023
- Neighborhood character
- Predominantly White (73%)
- Race & ethnicity
- White 73% Black 15% Two or more races 6% Hispanic / Latino 6% Asian 1%
- Hispanic origin (detail)
- Mexican 2%
- Common ancestry
- Lithuanian 16% Italian 1% Slovak 1%
- Foreign-born
- 4% · Canada
- Languages at home
- 93% English-only · Spanish 4% Other Indo-European 1%
Political lean MEDSL · Ascension
- 2024 margin
- Solid R (+34.0) · D 32.2% · R 66.1% · Other 1.7%
- 2008→2024 swing
- +1.7pp toward D · 2008: -35.7pp · 2024: -34.0pp
- All cycles
- 2024: R+34.0 2020: R+32.5 2016: R+36.0 2012: R+34.3 2008: R+35.7
Not yet ingested
- Civics
- —
Market trends
- HPI YoY
- ▼ -111.56%
- Current HPI
- 144.2267
- Rent YoY
- ▲ 3.47%
- Metro
- Baton Rouge, LA
- State GDP YoY
- ▲ 3.29%
- F500 in state
- 10
Industry mix (Fortune 500 HQ in LA)
| Industry | F500 HQs | Revenue |
|---|---|---|
| Telecommunications | 2 | $23B |
|
||
| Utilities | 1 | $12B |
|
||
| Wholesale / Distribution | 1 | $5B |
|
||
| Advertising | 1 | $2B |
|
||
Price history
+39.9% since first listed15 events — show timeline
- 2026-06-05 Listed $275,000 GBRMLS
- 2026-06-05 Listed $275,000 AcadianaMLS
- 2022-01-24 Sold (Public Records) $240,000 Public Records
- 2022-01-21 Sold (MLS) — GBRMLS
- 2021-12-27 Pending — GBRMLS
- 2021-12-22 Listed $250,000 AcadianaMLS
- 2021-12-22 Listed $250,000 GBRMLS
- 2017-03-31 Sold (MLS) — GBRMLS
- 2017-02-01 Pending — GBRMLS
- 2017-01-24 Price Changed $196,500 GBRMLS
- 2016-10-03 Price Changed $198,900 GBRMLS
- 2016-09-21 Relisted — GBRMLS
- 2016-08-23 Pending — GBRMLS
- 2016-07-27 Listed $197,900 GBRMLS
- 2016-07-27 Listed $196,500 AcadianaMLS
Property tax history
+34.1%/yrLatest (2025): $2,188 · -1.8% YoY. Source: county tax records.
Cash-flow waterfall
monthlySold comps — $/sqft
last 12 mo · ≤1 miLoading sold comps…