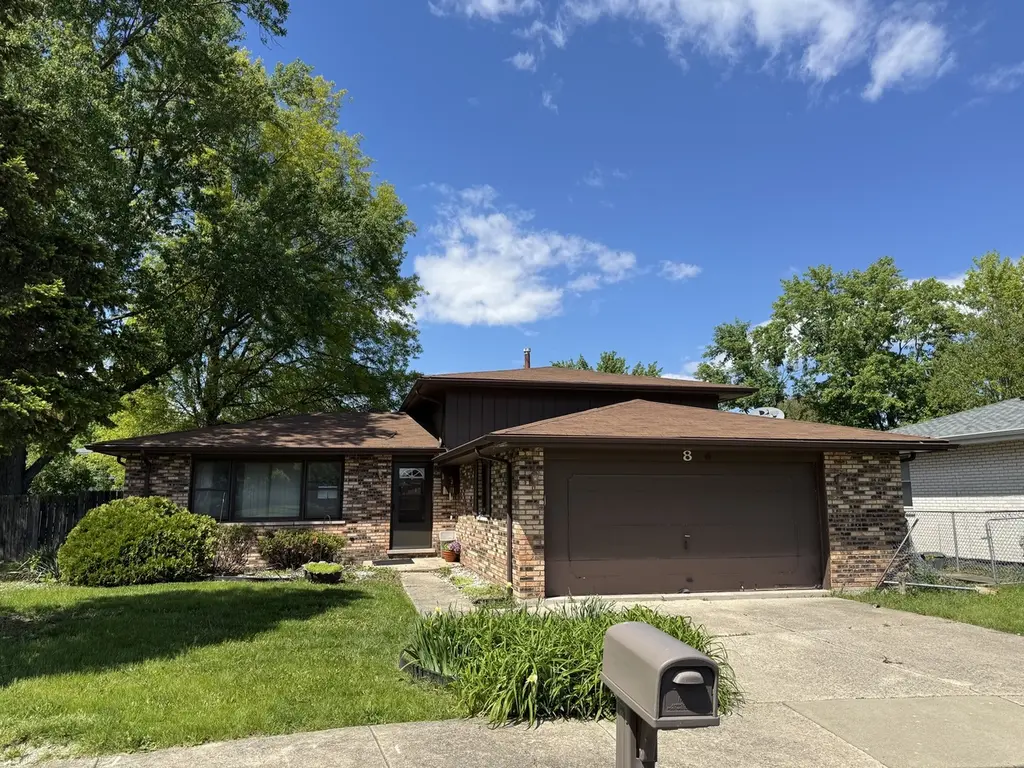
8 Rich Ct · Park Forest, IL
Flood risk 1/10 · Minimal
- FEMA flood zone
- X (unshaded)
- Chance of flooding over 30 yrs
- 0.0%
- Est. flood insurance / yr
- $473 – $860
Fire risk 1/10 · Minimal
- Est. fire insurance / yr
- $804 – $1,492
Heat risk 3/10 · Minor
- Hot days now (above 101°F)
- 7 days/yr
- Hot days in 30 yrs
- 16 days/yr
Wind risk 2/10 · Minimal
- Chance of severe wind over 30 yrs
- —
Air-quality risk 2/10 · Minimal
- Unhealthy air days now
- 1 days/yr
- Unhealthy air days in 30 yrs
- 1 days/yr
Risk factors via First Street. Map © Google.
Why this score? — see what drove the B- grade
The composite is a weighted blend of 9 inputs, each scored 0–100. Each bar is that input's sub-score; the figure is the points it added to the 100-point composite (weight × sub-score).
- Cash flow +30.0/30.0
- 1% rule +10.0/10.0
- DSCR +10.0/10.0
- ARV discount +7.5/15.0
- Livability +3.9/5.0
- Rent growth +2.5/5.0
- Condition / age +2.5/5.0
- Schools +0.9/10.0
- Appreciation +0.0/10.0
$89,900
🖨 Deal sheet (PDF) 📄 Offer letter ✓ Due diligence
Listing remarks
Investors and Rehabbers this appealing 3bd/2bth split-level single-family located in beautiful Park Forest. This home offers a blend of classic charm and comfortable living w/ convenient attached garage. SOLD "AS IS". .. this property is an REO and will not last!!! Offer should be your highest and best.
Key facts
- 6,000 sq ft lot
- 2 garage spots
- Built 1978
Neighborhood map
What this means for you Summary
Snapshot
- This is a 3-bed/2.0-bath single-family listed at $90k.
Deal economics
- At list price, monthly cash flow is $1k ($14k/yr) — positive.
- The deal already cash-flows at list — no discount required.
- Meets the 1% rule at list price ($2k rent vs $90k).
- Recommended offer: $87k (3.0% below list) — sets the bar for market timing.
- Cap rate 21.5% vs local median 9.5% in Park Forest — top-decile yield for the area; either an underpriced asset or a hidden risk that comps aren't pricing in. Stress-test before assuming the spread holds.
Location & tenants
- Location reads 78/100 on livability (#148 in IL, #2,726 nationally) — a middle-class / working-renter tenant base. Strengths: commute A+, cost of living A+, housing A+; Watch: amenities F.
- Rich Twp Hsd 227 (suburban): math 5% / reading 12% proficiency, ranked #577 of 620 in IL (top 93%) — low school quality limits family demand, transient renter base, plan for 1-2y turnover.
- Zoned schools: Michelle Obama Sch of Technology (484 students, 0% FRL).
- Market conditions: 106 active listings in the ZIP; 18 comparable units currently listed for rent nearby; rentals at typical pace (median 22d on market — plan ~3-4 weeks tenant-placement turnaround); 6,272 units permitted in Cook County in 2024 (4,658 in 5+ unit buildings).
- This rent runs 43% of the median local income ($62k/yr) — at the standard rent-burdened threshold; future hikes will face affordability resistance.
Forward outlook
- Local home prices are declining (-3.0%/yr); year-one equity from $622 of loan paydown is wiped out by about $3k of value loss. Plan a longer hold.
- At projected returns (-3.0% appreciation + 3.0% rent growth), your $25k cash investment doubles in ~3 years — after that, you're playing with house money.
Negotiation context
- It's been on market 37 days — a 3% lower offer ($87k) is reasonable based on typical stale-listing flexibility.
- 3 sale attempts; this cycle's ask has dropped $10k (10%) from the opening price — seller is motivated, your offer sets the floor, not the list.
Questions for the listing agent
- It's been on market 37 days. Have you received any prior offers? Is the seller open to a 3% concession, seller financing, or rate buy-down credit?
- Built in 1978 — when were the roof, HVAC, electrical panel, plumbing, and water heater last replaced?
- Is there a deadline driving the sale (1031 exchange, divorce, estate, relocation)? That informs how much negotiation room exists.
- Schools are D-rated, which usually means shorter tenancies and higher turnover. Who's the typical renter profile here, and what's been the actual vacancy rate?
- What's the average days-on-market for RENTAL listings here right now (not sales)? A rising rental-DOM trend means longer vacancies and softer asking-rent achievability than the comps imply.
- What's the recent tenant-quality profile in this submarket — average credit score on applications, eviction rate, late-payment / NSF rate, and stable-employment percentage? A property-management company in the area should have these aggregated.
- How much new for-sale + rental construction is in the pipeline within 1–3 miles? Heavy new supply typically softens prices + rents 12–24 months out; constrained supply supports both.
Investment metrics
- 1% rule
- 2.48% ✓
- Cap rate
- 21.51%
- Cash-on-cash
- 54.35%
- DSCR
- 3.42
- GRM
- 3.4
CMA / ARV
- ARV (on-the-fly)
- $187,488
- Comps found
- 12
Show comp detail 12 sales within ~0.75 mi
| Address | Dist | Beds/Ba | Sqft | Sold | Price | $/sf | Match |
|---|---|---|---|---|---|---|---|
| 340 Sauk Trl | 0.14mi | 3/2.0 | 1,576 (+4%) | 1mo | $180,000 | $114 | 86 |
| 4 Lakewood Ct | 0.07mi | 4/2.0 (+1) | 1,556 (+3%) | 2mo | $205,000 | $132 | 85 |
| 289 Westwood Dr | 0.07mi | 3/1.5 | 1,664 (+10%) | 1mo | $95,102 | $57 | 77 |
| 356 Waverly St | 0.26mi | 3/2.0 | 1,419 (-6%) | 2mo | $120,000 | $85 | 76 |
| 109 Wilson St | 0.47mi | 3/2.0 | 1,525 (+1%) | 1mo | $233,500 | $153 | 76 |
| 354 Westgate Dr | 0.36mi | 3/1.5 | 1,470 (-3%) | 2mo | $75,000 | $51 | 75 |
| 351 Waverly St | 0.21mi | 3/2.0 | 1,671 (+10%) | 0mo | $149,000 | $89 | 72 |
| 339 Blackhawk Dr | 0.40mi | 3/2.0 | 1,417 (-6%) | 1mo | $234,200 | $165 | 70 |
| 287 Mohawk St | 0.35mi | 3/1.0 | 1,408 (-7%) | 1mo | $175,000 | $124 | 67 |
| 245 Miami St | 0.54mi | 3/1.0 | 1,363 (-10%) | 2mo | $139,000 | $102 | 52 |
| 397 Oswego St | 0.69mi | 4/2.0 (+1) | 1,398 (-8%) | 2mo | $199,000 | $142 | 48 |
| 409 Winnemac St | 0.55mi | 4/2.0 (+1) | 1,736 (+15%) | 3mo | $229,900 | $132 | 42 |
Match score weights: distance 35% · size 25% · config 20% · recency 20%. Top-matched comps best support the ARV.
Projected returns pro-forma
-3.0% appreciation · 3.0% rent growth · sell at horizon
- IRR
- 52.5%
- Equity multiple
- 3.31×
- Total profit
- $58,076
- Equity at exit
- $13,404
- IRR
- 57.8%
- Equity multiple
- 6.73×
- Total profit
- $144,206
- Equity at exit
- $7,773
Cash invested: $25,172 (down + closing). Projections, not guarantees.
Landlord ↔ Tenant lean methodology
- Overall (STATE)
- 43 Moderately Tenant-Leaning
- State Illinois
- 43 Moderately Tenant-Leaning · D+7
- County
- — inherits STATE
- City
- — inherits STATE
ZIP-level market 60466
- Home prices YoY
- -21.1%
- Active inventory
- 106
- Price-to-rent
- 3.4×
Monthly cashflow live
- Estimated rent
- $2,230 high interval (Pro) →
- Mortgage (P&I)
- −$471
- Tax est. 1.5%
- −$112 /mo · $1,348/yr
- Insurance
- −$37
- HOA
- −$0
- Vacancy / Maint / Mgmt
- −$468
- Net cashflow
- $1,140
Break-even live
Sensitivity live
| Price | -10% $1,202 | -5% $1,171 | +0% $1,140 | +5% $1,109 | +10% $1,078 |
|---|---|---|---|---|---|
| Rent | -10% $964 | -5% $1,052 | +0% $1,140 | +5% $1,228 | +10% $1,316 |
| Rate | -1.0pp $1,185 | -0.5pp $1,163 | base $1,140 | +0.5pp $1,117 | +1.0pp $1,093 |
UW: 25.0% down · 7.5% · 30yr · 1.5% tax · 5.0% vac · 8.0% maint · 8.0% mgmt
Financing live
Cash to close
- Down payment
- $22,475
- Closing costs
- $2,697
- Reserves months
- —
- Total cash needed
- —
Loan-product check · same deal, 3 products live
Conventional
25% down · 7.5% · 30yr
- Down + closing
- —
- Monthly P&I
- —
- Monthly cashflow
- —
- DSCR
- —
- Eligible?
- —
Personal DTI + credit; lowest rate.
DSCR
20% down · 8.5% · 30yr
- Down + closing
- —
- Monthly P&I
- —
- Monthly cashflow
- —
- DSCR
- —
- Eligible?
- —
No personal income docs; deal must DSCR.
Hard money
10% down · 12.0% · 12mo
- Down + closing
- —
- Monthly P&I
- —
- Monthly cashflow
- —
- DSCR
- —
- Eligible?
- —
Short-term bridge; refi at stabilization.
Rent comps 18 comps
| Address | Beds | Baths | Sqft | Rent | $/sqft | DOM | Units | Dist |
|---|---|---|---|---|---|---|---|---|
| 400 Watseka St Park Forest, IL | 4.0 | 2.0 | 1161 | $2,161 | $1.86 | 18d | 1 | 0.51mi |
| 372 Oswego St Park Forest, IL | 4.0 | 1.0 | 1200 | $2,600 | $2.17 | 26d | 1 | 0.74mi |
| 411 Huron St Park Forest, IL | 3.0 | 1.0 | 1092 | $2,200 | $2.01 | 1d | 1 | 0.76mi |
| 4014 Euclid Ln Richton Park, IL | 2.0 | 1.0 | 1100 | $2,100 | $1.91 | 24d | 1 | 0.91mi |
| 4014 Euclid Ln Richton Park, IL | 3.0 | 1.0 | 1100 | $2,100 | $1.91 | 14d | 1 | 0.91mi |
| 4014 Euclid Ln Richton Park, IL | 2.0 | 1.0 | 1100 | $2,100 | $1.91 | 9d | 1 | 0.91mi |
| 11 Fir St Park Forest, IL | 1.0–3.0 | 1.0 | 1026 | $2,069 | $2.02 | 0d | 1 | 0.93mi |
| 111 Nashua St Park Forest, IL | 4.0 | 1.5 | 1500 | $2,500 | $1.67 | 26d | 1 | 0.97mi |
| 3324 Western Ave Park Forest, IL | 1.0–3.0 | 1.0 | 1026 | $1,995 | $1.94 | 0d | 11 | 1.02mi |
| 19 Apple Ln Park Forest, IL | 3.0 | 1.0 | 1541 | $2,300 | $1.49 | 14d | 1 | 1.04mi |
| 336 Oakwood St Park Forest, IL | 3.0 | 2.0 | 2083 | $2,800 | $1.34 | 12d | 1 | 1.04mi |
| 490 Shabbona Dr Park Forest, IL | 3.0 | 1.0 | 1300 | $1,895 | $1.46 | 5d | 1 | 1.08mi |
| 441 Talala St Park Forest, IL | 4.0 | 2.0 | 1740 | $2,500 | $1.44 | 26d | 1 | 1.09mi |
| 194 Monee Rd Park Forest, IL | 3.0 | 1.0 | 1092 | $1,971 | $1.80 | 24d | 1 | 1.21mi |
| 4200 Arlington Dr Richton Park, IL | 3.0 | 2.0 | 1595 | $2,061 | $1.29 | 22d | 1 | 1.26mi |
| 235 Tampa St Park Forest, IL | 3.0 | 1.0 | 1092 | $2,000 | $1.83 | 26d | 1 | 1.26mi |
| 3838 216th Pl Matteson, IL | 2.0 | 2.0 | 1160 | $1,996 | $1.72 | 22d | 1 | 1.26mi |
| 3538 212th Pl Matteson, IL | 3.0 | 1.0 | 1209 | $2,000 | $1.65 | 26d | 1 | 1.49mi |
Listing history 27 events
-
2026-06-21days on market $89,900 Active 37 DOM
-
2026-06-18days on market $89,900 Active 34 DOM
-
2026-06-18price $89,900 Active 33 DOM
-
2026-06-17days on market $99,900 Active 33 DOM
-
2026-06-16days on market $99,900 Active 32 DOM
-
2026-06-15days on market $99,900 Active 31 DOM
-
2026-06-13days on market $99,900 Active 29 DOM
-
2026-06-09days on market $99,900 Active 25 DOM
-
2026-06-08days on market $99,900 Active 24 DOM
-
2026-06-07days on market $99,900 Active 23 DOM
-
2026-06-04days on market $99,900 Active 20 DOM
-
2026-06-03days on market $99,900 Active 19 DOM
-
2026-06-02days on market $99,900 Active 18 DOM
-
2026-06-01days on market $99,900 Active 17 DOM
-
2026-05-31days on market $99,900 Active 16 DOM
-
2026-05-15$99,900 Active
-
2026-02-27historical
-
2026-02-13status Active
-
2026-02-13price
-
2025-11-09historical Contingent - Continue to Show
-
2025-10-19price
-
2025-10-03Active
-
2001-12-11soldstatus $135,000
-
1995-10-11soldstatus $112,500
-
1985-10-03soldstatus $80,000
-
1985-09-01soldstatus $79,900
-
1979-01-04soldstatus $56,000
ⓘ Source: listings_history table (triggers on properties + properties_extension) + one-shot
backfill from property_details.listing_events for pre-trigger history.
Climate risk First Street
- Flood 1/10 Low FEMA zone X (unshaded) · 0% chance over 30 yrs
- Wildfire 1/10 Low
- Heat 3/10 Moderate 7 d/yr ≥101°F today · 16 d/yr by 30 yrs out
- Wind 2/10 Low
- Air quality 2/10 Low 1 unhealthy d/yr today · 1 by 30 yrs out
Nearby sold comps map
Loading sold comps map…
Walkable amenities ~0.75 mi
Loading nearby amenities…
Taxation est. · year 1
- Rental income
- $26,754
- − Mortgage interest
- −$5,036
- − Property taxes
- −$1,348
- − Insurance
- −$450
- − Repairs & maintenance
- −$2,140
- − Management
- −$2,140
- − Depreciation
- −$2,615
- Taxable income
- $13,025
- Est. tax owed @ 24.0%
- −$3,126
- After-tax cash flow
- $10,555/yr
For passive investors: Depreciation is non-cash, so a rental often shows a tax loss while cash-flowing — sheltering income. Rental losses are passive: they offset passive income freely, and up to $25,000/yr can offset ordinary (W-2) income if you actively participate and your MAGI is under $100k (phasing out to $0 by $150k); unused losses carry forward. On sale, claimed depreciation is recaptured at up to 25%, and gains may owe capital-gains tax (a 1031 exchange can defer both). Figures are a year-1 estimate at your 24.0% rate — not tax advice; consult a CPA.
Schools (NCES district)
- District
- Rich Twp Hsd 227
- NCES district ID
- 1733420
- Math proficiency
- 5% ▼ -3.00%
- Reading proficiency
- 12% ▬ 0.00%
- Median HH income
- $56,056
- Composite
- 8.93/100
- National rank
- #9885
- State rank
- #577 of 620 in IL
Livability — Park Forest
- Score
- 78/100
- State rank
- #148
- US rank
- #2726
Category grades
Schools grade is shown separately in the Schools card above.
Census & demographics
- Census place
- Park Forest, IL
- County
- Cook County · 4,486,803 people
- City population
- 21,461
- Metro
- Chicago-Naperville-Elgin, IL-IN-WI
- Population (ZIP)
- 21,461
- Household income
- $61,654
- Rent vs Own
- Severe rent burden
- 900.0
Population outlook (Cook County) Hauer SSP2
- Today (2025)
- 5,347,519 people
- By 2030
- 5,357,703 · +0.2%
- By 2040
- 5,324,924 · -0.4%
- By 2050
- 5,230,762 · -2.2%
- By 2075
- 4,785,735 · -10.5%
- By 2100
- 4,188,836 · -21.7%
Race, ethnicity, and origin ACS 2023
- Neighborhood character
- Predominantly Black (69%)
- Race & ethnicity
- Black 69% White 19% Hispanic / Latino 9% Two or more races 3% Native American 1%
- Hispanic origin (detail)
- Mexican 8%
- Common ancestry
- Romanian 2% Iranian 1% Italian 1%
- Foreign-born
- 6% · Canada
- Languages at home
- 90% English-only · Spanish 7% French/Haitian/Cajun 1% Russian/Polish/Slavic 1%
Political lean MEDSL · Cook
- 2024 margin
- Solid D (+42.0) · D 70.4% · R 28.4% · Other 1.2%
- 2008→2024 swing
- -11.4pp toward R · 2008: 53.4pp · 2024: 42.0pp
- All cycles
- 2024: D+42.0 2020: D+50.3 2016: D+53.0 2012: D+49.4 2008: D+53.4
Not yet ingested
- Civics
- —
Market trends
- HPI YoY
- ▼ -58.87%
- Current HPI
- 219.9692
- Rent YoY
- —
- Metro
- Chicago-Naperville-Elgin, IL-IN-WI
- State GDP YoY
- ▲ 1.59%
- F500 in state
- 60
Industry mix (Fortune 500 HQ in IL)
| Industry | F500 HQs | Revenue |
|---|---|---|
| Insurance | 4 | $201B |
|
||
| Consumer Goods | 4 | $87B |
|
||
| Industrial Machinery | 3 | $64B |
|
||
| Healthcare | 2 | $55B |
|
||
| Retail / Pharmacy | 1 | $148B |
|
||
| Agriculture / Food | 1 | $86B |
|
||
Price history
+78.4% since first listed12 events — show timeline
- 2026-05-15 Listed $99,900 MRED as Distributed by MLS Grid
- 2026-02-27 Listing Removed — MRED as Distributed by MLS Grid
- 2026-02-13 Relisted — MRED as Distributed by MLS Grid
- 2026-02-13 Price Changed — MRED as Distributed by MLS Grid
- 2025-11-09 Contingent — MRED as Distributed by MLS Grid
- 2025-10-19 Price Changed — MRED as Distributed by MLS Grid
- 2025-10-03 Listed — MRED as Distributed by MLS Grid
- 2001-12-11 Sold (Public Records) $135,000 Public Records
- 1995-10-11 Sold (Public Records) $112,500 Public Records
- 1985-10-03 Sold (Public Records) $80,000 Public Records
- 1985-09-01 Sold (Public Records) $79,900 Public Records
- 1979-01-04 Sold (Public Records) $56,000 Public Records
Property tax history
+7.1%/yrLatest (2023): $12,444 · -5.6% YoY. Source: county tax records.
Cash-flow waterfall
monthlySold comps — $/sqft
last 12 mo · ≤1 miLoading sold comps…