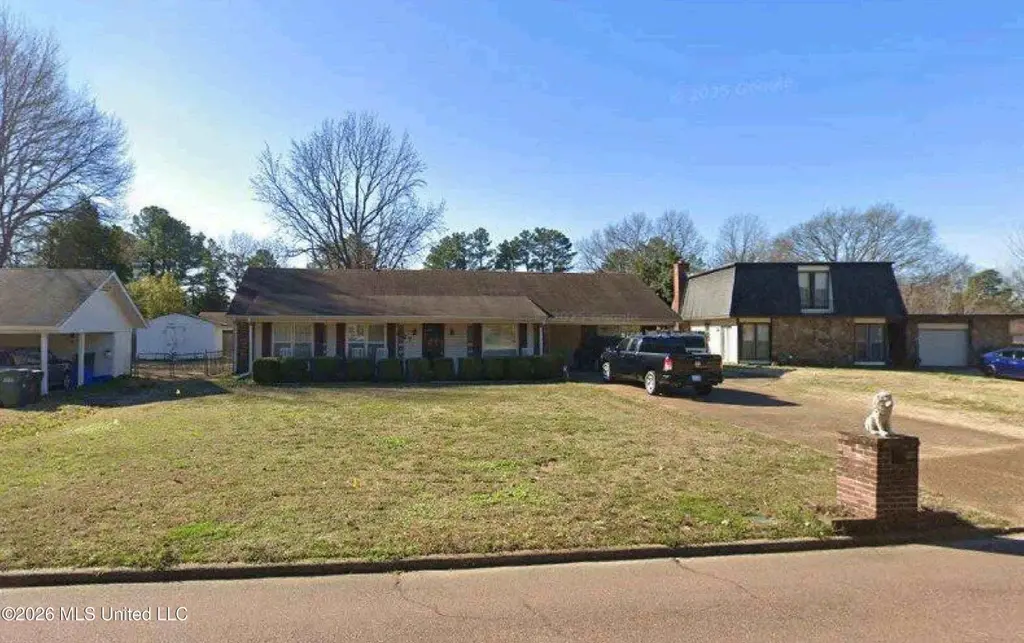
827 Dinwiddie Cv · Southaven, MS
Flood risk 1/10 · Minimal
- FEMA flood zone
- X (unshaded)
- Chance of flooding over 30 yrs
- 0.0%
- Est. flood insurance / yr
- $507 – $1,088
Fire risk 1/10 · Minimal
- Est. fire insurance / yr
- $1,241 – $2,305
Heat risk 6/10 · Moderate
- Hot days now (above 109°F)
- 7 days/yr
- Hot days in 30 yrs
- 21 days/yr
Wind risk 4/10 · Minor
- Chance of severe wind over 30 yrs
- 21.0%
Air-quality risk 2/10 · Minimal
- Unhealthy air days now
- 2 days/yr
- Unhealthy air days in 30 yrs
- 2 days/yr
Risk factors via First Street. Map © Google.
Why this score? — see what drove the B+ grade
The composite is a weighted blend of 9 inputs, each scored 0–100. Each bar is that input's sub-score; the figure is the points it added to the 100-point composite (weight × sub-score).
- Cash flow +30.0/30.0
- ARV discount +15.0/15.0
- DSCR +10.0/10.0
- 1% rule +8.9/10.0
- Schools +4.0/10.0
- Rent growth +3.3/5.0
- Livability +3.2/5.0
- Condition / age +2.5/5.0
- Appreciation +0.0/10.0
$120,000
🖨 Deal sheet 📄 Offer letter ✓ Due diligence
Listing remarks MLS
LOVELY HOME IN PEACEFUL COVE OFFERS 3 BR 2 BA-LR DR COMBO. EAT-IN- KITCHEN-BIG DEN W/FP. HAS BEEN UPDATED-LG SEPT. LAUNDRY ROOM. 27X11 SUNROOM W/HEAT & AIR UNIT. LOTS OF CLOSET SPACE. MUST SEE TO APPRECIATE. LOTS OF SPACE FOR YOUR MONEY.
Key facts
- 0.24 acre lot
- 2 garage spots
- Built 1971
Property features AI
Finance
- Other: Property listed as a fixer; Living area reported as 1,613 (assessor)
- Financial info: Financial details not provided
- HOA & community: Community features: see remarks
Exterior
- Parking: Attached carport; Carport (2 spaces); Driveway; 2 garage spaces
- Security: Carbon monoxide detector(s); Fire alarm
- Utilities: Public water; Public sewer; Electricity available
- Home design: Single-family house; One level
- Construction: Vinyl, brick and siding exterior; Brick/mortar foundation; Three-tab shingle roof; Built year from public records
- Exterior features: Front porch; Rain gutters; Back yard fencing; City lot
Interior
- Kitchen: Disposal
- Bedrooms: Bedrooms information not provided
- Flooring: Carpet; Laminate
- Bathrooms: 2 full bathrooms
- Heating & cooling: Central electric heating; Central air conditioning
- Interior features: Ceiling fans; Track lighting; Deadbolt locks; Storm doors; Fireplace(s) serving den, dining room and living room; Disposal
- Laundry & utility: Laundry information not provided
Neighborhood map
What this means for you Summary
Snapshot
- This is a 3-bed/2.0-bath single-family listed at $120k.
Deal economics
- At list price, monthly cash flow is $492 ($6k/yr) — positive.
- The deal already cash-flows at list — no discount required.
- Meets the 1% rule at list price ($2k rent vs $120k).
- Cap rate 11.2% vs local median 5.2% in Southaven — top-decile yield for the area; either an underpriced asset or a hidden risk that comps aren't pricing in. Stress-test before assuming the spread holds.
Location & tenants
- Location reads 65/100 on livability (#107 in MS) — a middle-class / working-renter tenant base. Strengths: cost of living A+, housing A+; Watch: amenities F, commute F, health & safety F.
- Desoto County School District (suburban): math 48% / reading 42% proficiency, ranked #20 of 130 in MS (top 15%) — families likely to look elsewhere, expect single-tenant / working-renter base with shorter leases.
- Zoned schools: Southaven Elementary (math 20% / reading 23%, grade F, #239 of 375 statewide, top 64%, 684 students, 100% FRL); Southaven Middle School (math 33% / reading 25%, grade F, #90 of 179 statewide, top 52%, 1,456 students, 100% FRL); Southaven High School (math 26% / reading 35%, grade F, #88 of 197 statewide, top 45%, 1,850 students, 100% FRL) — zoned schools average 100% FRL vs 43% district-wide (56 pts higher); higher-poverty schools than district average — tighter screening recommended.
- Zoned-school proficiency averages 27% at this address vs 45% district-wide (-18 pts) — the specific schools serving this property underperform the Desoto County School District average; the district grade overstates school quality for this exact location.
- Market conditions: Rents rising (+3.2%/yr); 193 active listings in the ZIP; 36 comparable units currently listed for rent nearby; rentals at typical pace (median 24d on market — plan ~3-4 weeks tenant-placement turnaround); 1,155 units permitted in DeSoto County in 2024 (0 in 5+ unit buildings).
- This rent runs 32% of the median local income ($62k/yr) — at the standard rent-burdened threshold; future hikes will face affordability resistance.
Forward outlook
- Local home prices are declining (-3.0%/yr); year-one equity from $830 of loan paydown is wiped out by about $4k of value loss. Plan a longer hold.
- DeSoto County population projected at +33% by 2050 — long-run rental-demand tailwind backs the buy-and-hold thesis.
- At projected returns (-3.0% appreciation + 3.2% rent growth), your $34k cash investment doubles in ~7 years — after that, you're playing with house money.
Negotiation context
- Only 1 days on market — expect competitive offers; lowballing is unlikely to land.
- 3 sale attempts since 25y ago with the ask held roughly flat each time — persistent listings suggest the price (not the market) is what's stuck; bring a comps-based counter.
Risks & watch-outs
- Climate carrying-cost: extreme-heat days projected 7→21/yr by 2055 (HVAC capex compounding) — expect insurance premiums to compound above CPI over the hold.
Questions for the listing agent
- Built in 1971 — when were the roof, HVAC, electrical panel, plumbing, and water heater last replaced?
- Is there a deadline driving the sale (1031 exchange, divorce, estate, relocation)? That informs how much negotiation room exists.
- Schools are D-rated, which usually means shorter tenancies and higher turnover. Who's the typical renter profile here, and what's been the actual vacancy rate?
- What's the average days-on-market for RENTAL listings here right now (not sales)? A rising rental-DOM trend means longer vacancies and softer asking-rent achievability than the comps imply.
- What's the recent tenant-quality profile in this submarket — average credit score on applications, eviction rate, late-payment / NSF rate, and stable-employment percentage? A property-management company in the area should have these aggregated.
- How much new for-sale + rental construction is in the pipeline within 1–3 miles? Heavy new supply typically softens prices + rents 12–24 months out; constrained supply supports both.
Investment metrics
- 1% rule
- 1.39% ✓
- Cap rate
- 11.21%
- Cash-on-cash
- 17.57%
- DSCR
- 1.78
- GRM
- 6.0
CMA / ARV
- ARV (on-the-fly)
- $225,820
- Comps found
- 12
Show comp detail 12 sales within ~0.75 mi
| Address | Dist | Beds/Ba | Sqft | Sold | Price | $/sf | Match |
|---|---|---|---|---|---|---|---|
| 827 Dinwiddie Cv | 0.00mi | 3/2.0 | 1,613 (0%) | 1mo | $120,000 | $74 | 100 |
| 8718 Carriage Cv | 0.45mi | 3/2.5 | 1,600 (-1%) | 2mo | $245,000 | $153 | 74 |
| 1242 Brandywine Dr | 0.49mi | 3/1.5 | 1,650 (+2%) | 1mo | $219,900 | $133 | 70 |
| 7881 Chesterfield Dr | 0.55mi | 3/2.0 | 1,563 (-3%) | 2mo | $219,000 | $140 | 67 |
| 1383 Ranger Dr | 0.64mi | 3/2.0 | 1,576 (-2%) | 2mo | $219,900 | $140 | 65 |
| 8590 W Cedar Cir | 0.47mi | 3/2.0 | 1,500 (-7%) | 4mo | $209,900 | $140 | 63 |
| 8667 Chesterfield Dr | 0.32mi | 3/2.0 | 1,804 (+12%) | 4mo | $164,900 | $91 | 61 |
| 8699 Chesterfield Dr | 0.35mi | 3/2.0 | 1,851 (+15%) | 2mo | $219,900 | $119 | 58 |
| 1690 Desoto Cv | 0.60mi | 3/2.0 | 1,750 (+8%) | 3mo | $265,000 | $151 | 55 |
| 1408 Bennington Dr | 0.68mi | 3/3.0 | 1,700 (+5%) | 1mo | $249,901 | $147 | 54 |
| 8682 Millbranch Rd | 0.36mi | 4/2.0 (+1) | 1,853 (+15%) | 2mo | $275,000 | $148 | 52 |
| 7734 S Chesterfield Dr | 0.69mi | 3/2.0 | 1,770 (+10%) | 3mo | $235,000 | $133 | 49 |
Match score weights: distance 35% · size 25% · config 20% · recency 20%. Top-matched comps best support the ARV.
Projected returns pro-forma
-3.0% appreciation · 3.2% rent growth · sell at horizon
- IRR
- 9.2%
- Equity multiple
- 1.36×
- Total profit
- $12,244
- Equity at exit
- $17,892
- IRR
- 18.6%
- Equity multiple
- 2.56×
- Total profit
- $52,493
- Equity at exit
- $10,375
Cash invested: $33,600 (down + closing). Projections, not guarantees.
Landlord ↔ Tenant lean methodology
- Overall (STATE)
- 90 Strongly Landlord-Friendly
- State Mississippi
- 90 Strongly Landlord-Friendly · R+11
- County
- — inherits STATE
- City
- — inherits STATE
ZIP-level market 38671
- Home prices YoY
- -18.2%
- Rents YoY
- 3.2%
- Active inventory
- 193
- Price-to-rent
- 6.0×
Monthly cashflow live
- Estimated rent
- $1,672 high interval (Pro) →
- Mortgage (P&I)
- −$629
- Tax est. 1.5%
- −$150 /mo · $1,800/yr
- Insurance
- −$50
- HOA
- −$0
- Vacancy / Maint / Mgmt
- −$351
- Net cashflow
- $492
Break-even live
UW: 25.0% down · 7.5% · 30yr · 1.5% tax · 5.0% vac · 8.0% maint · 8.0% mgmt
Financing live
Cash to close
- Down payment
- $30,000
- Closing costs
- $3,600
- Reserves months
- —
- Total cash needed
- —
Loan-product check · same deal, 3 products live
Conventional
25% down · 7.5% · 30yr
- Down + closing
- —
- Monthly P&I
- —
- Monthly cashflow
- —
- DSCR
- —
- Eligible?
- —
Personal DTI + credit; lowest rate.
DSCR
20% down · 8.5% · 30yr
- Down + closing
- —
- Monthly P&I
- —
- Monthly cashflow
- —
- DSCR
- —
- Eligible?
- —
No personal income docs; deal must DSCR.
Hard money
10% down · 12.0% · 12mo
- Down + closing
- —
- Monthly P&I
- —
- Monthly cashflow
- —
- DSCR
- —
- Eligible?
- —
Short-term bridge; refi at stabilization.
Rent comps 36 comps
| Address | Beds | Baths | Sqft | Rent | $/sqft | DOM | Units | Dist |
|---|---|---|---|---|---|---|---|---|
| 842 Farmington Dr N Southaven, MS | 3.0 | 2.0 | 1400 | $1,595 | $1.14 | 4d | 1 | 0.10mi |
| 8209 Claiborne Dr Southaven, MS | 3.0 | 2.0 | 2052 | $1,950 | $0.95 | 21d | 1 | 0.37mi |
| 8254 Pinebrook Dr Southaven, MS | 3.0 | 1.0 | 1095 | $1,385 | $1.26 | 43d | 1 | 0.43mi |
| 8694 Yorktown Dr Southaven, MS | 3.0 | 2.0 | 1556 | $1,703 | $1.09 | 43d | 1 | 0.52mi |
| 1210 Rasco Rd W Southaven, MS | 3.0 | 2.0 | 1638 | $1,695 | $1.03 | 4d | 1 | 0.52mi |
| 1344 Brandywine Dr Southaven, MS | 4.0 | 2.0 | 1473 | $1,595 | $1.08 | 11d | 1 | 0.56mi |
| 8282 Fayette Cv Southaven, MS | 3.0 | 1.5 | 1297 | $1,545 | $1.19 | 14d | 1 | 0.68mi |
| 1416 Moss Point Dr Southaven, MS | 3.0 | 1.0 | 1197 | $1,533 | $1.28 | 43d | 1 | 0.71mi |
| 8082 Whitebrook Dr Southaven, MS | 3.0 | 1.0 | 1100 | $1,495 | $1.36 | 23d | 1 | 0.76mi |
| 1319 Stateline Rd W Southaven, MS | 3.0 | 1.5 | 1189 | $1,395 | $1.17 | 4d | 1 | 0.77mi |
| 8297 Baldwyn Cv Southaven, MS | 3.0 | 1.0 | 1065 | $1,323 | $1.24 | 23d | 1 | 0.79mi |
| 1449 Ticonderoga Dr Southaven, MS | 4.0 | 1.5 | 1447 | $1,623 | $1.12 | 23d | 1 | 0.80mi |
| 98 Stonebrook Cv Southaven, MS | 4.0 | 2.0 | 1451 | $1,500 | $1.03 | 43d | 1 | 0.81mi |
| 4896 Lochinvar Dr Southaven, MS | 3.0 | 1.5 | 1112 | $1,081 | $0.97 | 21d | 1 | 0.81mi |
| 5572 Lochinvar Dr Southaven, MS | 3.0 | 1.0 | 1065 | $1,090 | $1.02 | 43d | 1 | 0.81mi |
| 8328 Dottley Dr Southaven, MS | 3.0 | 2.0 | 1184 | $1,573 | $1.33 | 43d | 1 | 0.82mi |
| 8280 Hastings Cv Southaven, MS | 3.0 | 1.5 | 1184 | $1,350 | $1.14 | 21d | 1 | 0.85mi |
| 7560 Chesteridge Ave Southaven, MS | 1.0–3.0 | 1.0–2.0 | 887 | $1,475 | $1.66 | 1d | 7 | 0.85mi |
| 7661 Ragland Pl Southaven, MS | 3.0 | 2.0 | 1242 | $1,793 | $1.44 | 43d | 1 | 0.89mi |
| 7658 Davis Pkwy Southaven, MS | 3.0 | 3.0 | 1513 | $1,995 | $1.32 | 17d | 1 | 0.90mi |
| 1732 Carla Cv Southaven, MS | 4.0 | 1.5 | 1196 | $1,600 | $1.34 | 4d | 1 | 0.94mi |
| 7605 Davis Pkwy Southaven, MS | 3.0 | 2.0 | 1351 | $1,710 | $1.27 | 23d | 1 | 0.96mi |
| 8228 Brooksville Cv Southaven, MS | 3.0 | 2.0 | 1576 | $1,695 | $1.08 | 4d | 1 | 1.04mi |
| 1000 Sutton Pl Horn Lake, MS | 2.0 | 2.0 | 1100 | $1,540 | $1.40 | 44d | 1 | 1.07mi |
| 1842 Brookhaven Dr Southaven, MS | 3.0 | 1.0 | 1200 | $1,395 | $1.16 | 4d | 1 | 1.11mi |
| 1748 Newington Cv Southaven, MS | 3.0 | 1.5 | 1124 | $1,500 | $1.33 | 23d | 1 | 1.18mi |
| 7711 Iris Cv Southaven, MS | 3.0 | 2.0 | 1284 | $1,710 | $1.33 | 2d | 1 | 1.24mi |
| 1766 Dorchester Dr Southaven, MS | 3.0 | 2.0 | 1200 | $1,585 | $1.32 | 23d | 1 | 1.24mi |
| 8349 Cedarbrush Dr Southaven, MS | 3.0 | 1.5 | 1200 | $1,395 | $1.16 | 43d | 1 | 1.26mi |
| 1984 Custer Dr Southaven, MS | 3.0 | 2.0 | 1131 | $1,523 | $1.35 | 43d | 1 | 1.28mi |
| 7594 Rockingham Dr Southaven, MS | 3.0 | 1.5 | 1680 | $1,665 | $0.99 | 43d | 1 | 1.31mi |
| 8278 Lake Shore Dr W Southaven, MS | 4.0 | 2.0 | 1584 | $1,750 | $1.10 | 14d | 1 | 1.37mi |
| 8061 Creekwood Cir W Southaven, MS | 2.0 | 1.5 | 1300 | $1,550 | $1.19 | 17d | 1 | 1.42mi |
| 8495 Charleston Dr Southaven, MS | 3.0 | 1.5 | 1450 | $1,345 | $0.93 | 14d | 1 | 1.43mi |
| 7456 Overlook Dr Southaven, MS | 2.0 | 2.0 | 1212 | $1,550 | $1.28 | 43d | 1 | 1.47mi |
| 494 Windridge Pt Southaven, MS | 3.0 | 2.0 | 1644 | $2,013 | $1.22 | 43d | 1 | 1.50mi |
Listing history 2 events
-
2026-06-02remarks 2-char remark
-
2026-06-02$120,000 Pending 1 DOM
ⓘ Source: listings_history table (triggers on properties + properties_extension) + one-shot
backfill from property_details.listing_events for pre-trigger history.
Climate risk First Street
- Flood 1/10 Low FEMA zone X (unshaded) · 0% chance over 30 yrs
- Wildfire 1/10 Low
- Heat 6/10 Major 7 d/yr ≥109°F today · 21 d/yr by 30 yrs out
- Wind 4/10 Moderate 21% chance of damaging wind over 30 yrs
- Air quality 2/10 Low 2 unhealthy d/yr today · 2 by 30 yrs out
Nearby sold comps map
Loading sold comps map…
Walkable amenities ~0.75 mi
Loading nearby amenities…
Taxation est. · year 1
- Rental income
- $20,068
- − Mortgage interest
- −$6,722
- − Property taxes
- −$1,800
- − Insurance
- −$600
- − Repairs & maintenance
- −$1,605
- − Management
- −$1,605
- − Depreciation
- −$3,491
- Taxable income
- $4,245
- Est. tax owed @ 24.0%
- −$1,019
- After-tax cash flow
- $4,884/yr
For passive investors: Depreciation is non-cash, so a rental often shows a tax loss while cash-flowing — sheltering income. Rental losses are passive: they offset passive income freely, and up to $25,000/yr can offset ordinary (W-2) income if you actively participate and your MAGI is under $100k (phasing out to $0 by $150k); unused losses carry forward. On sale, claimed depreciation is recaptured at up to 25%, and gains may owe capital-gains tax (a 1031 exchange can defer both). Figures are a year-1 estimate at your 24.0% rate — not tax advice; consult a CPA.
Schools (NCES district)
- District
- Desoto County School District
- NCES district ID
- 2801320
- Math proficiency
- 48% ▼ -13.00%
- Reading proficiency
- 42% ▼ -6.00%
- Median HH income
- $59,272
- Composite
- 39.56/100
- National rank
- #3933
- State rank
- #20 of 130 in MS
Livability — Southaven
- Score
- 65/100
- State rank
- #107
- US rank
- #12584
Category grades
Schools grade is shown separately in the Schools card above.
Census & demographics
- Census place
- Southaven, MS
- County
- DeSoto County · 176,513 people
- City population
- 53,755
- Metro
- Memphis, TN-MS-AR
- Population (ZIP)
- 37,319
- Household income
- $61,843
- Rent vs Own
- Severe rent burden
- 1583.0
Population outlook (DeSoto County) Hauer SSP2
- Today (2025)
- 203,338 people
- By 2030
- 217,692 · +7.1%
- By 2040
- 245,320 · +20.6%
- By 2050
- 270,133 · +32.8%
- By 2075
- 323,341 · +59.0%
- By 2100
- 348,742 · +71.5%
Race, ethnicity, and origin ACS 2023
- Neighborhood character
- Diverse neighborhood (Simpson 0.58)
- Race & ethnicity
- White 49% Black 42% Hispanic / Latino 6% Two or more races 4%
- Hispanic origin (detail)
- Mexican 3%
- Common ancestry
- Italian 1% Lithuanian 1% Serbian 1%
- Foreign-born
- 3% · Canada
- Languages at home
- 95% English-only · Spanish 4%
Political lean MEDSL · DeSoto
- 2024 margin
- Strong R (+24.1) · D 36.7% · R 60.8% · Other 2.5%
- 2008→2024 swing
- +14.2pp toward D · 2008: -38.2pp · 2024: -24.1pp
- All cycles
- 2024: R+24.1 2020: R+23.9 2016: R+34.8 2012: R+33.5 2008: R+38.2
Not yet ingested
- Civics
- —
Market trends
- HPI YoY
- ▼ -49.08%
- Current HPI
- 220.7875
- Rent YoY
- ▲ 3.20%
- Metro
- Memphis, TN-MS-AR
- State GDP YoY
- —
- F500 in state
- 0
Price history
+11.6% since first listed7 events — show timeline
- 2026-06-02 Pending — MLSU
- 2026-05-28 Listed $120,000 MLSU
- 2008-01-21 Listing Removed — MLSU
- 2007-10-23 Listed $136,000 MLSU
- 2001-11-13 Sold (Public Records) — Public Records
- 2001-11-13 Sold (MLS) — MLSU
- 2001-09-22 Listed $107,500 MLSU
Property tax history
+0.1%/yrLatest (2025): $195 · -15.7% YoY. Source: county tax records.
Cash-flow waterfall
monthlySold comps — $/sqft
last 12 mo · ≤1 miLoading sold comps…