 Fourplex
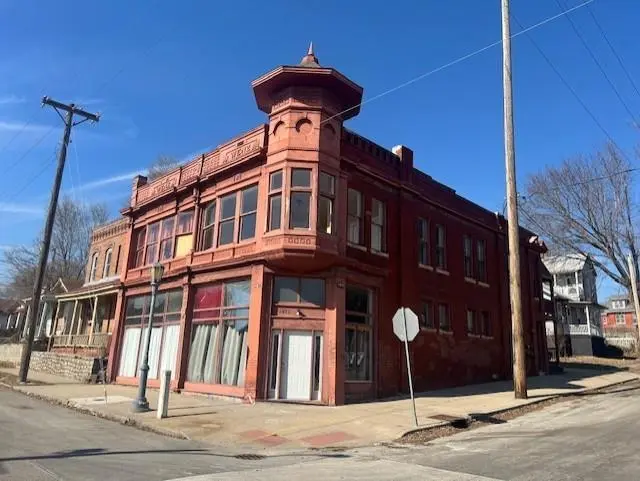
1421 Penn St · St. Joseph, MO
Flood risk 1/10 · Minimal
- FEMA flood zone
- —
- Chance of flooding over 30 yrs
- 0.0%
- Est. flood insurance / yr
- —
Fire risk 1/10 · Minimal
- Est. fire insurance / yr
- $1,054 – $1,958
Heat risk 4/10 · Minor
- Hot days now (above 106°F)
- 7 days/yr
- Hot days in 30 yrs
- 16 days/yr
Wind risk 2/10 · Minimal
- Chance of severe wind over 30 yrs
- —
Air-quality risk 2/10 · Minimal
- Unhealthy air days now
- 1 days/yr
- Unhealthy air days in 30 yrs
- 1 days/yr
Risk factors via First Street. Map © Google.
Why this score? — see what drove the B- grade
The composite is a weighted blend of 9 inputs, each scored 0–100. Each bar is that input's sub-score; the figure is the points it added to the 100-point composite (weight × sub-score).
- Cash flow +30.0/30.0
- 1% rule +10.0/10.0
- DSCR +10.0/10.0
- ARV discount +7.5/15.0
- Schools +2.8/10.0
- Rent growth +2.5/5.0
- Livability +2.5/5.0
- Condition / age +2.5/5.0
- Appreciation +0.0/10.0
$199,995
🖨 Deal sheet 📄 Offer letter ✓ Due diligence
Multi-family units
County records classify this as Multi-Family (5+ Unit). Listing-text estimate: 4 units. estimate disagrees with records
5+ unit building — per-unit beds/baths from public records are typically unavailable; the breakdown below (if shown) is an estimate from the listing text.
Listing remarks MLS
Lots of updates have been done to this all brick fourplex to get it ready to move into your portfolio. This property boasts separate electric meters with all electric units. Corner lot with little yard maintenance cuts back on overhead. The unites offer lots of natural light and gives them a very roomy feel. Put this one on your must see list.
Key facts
- Natural light
- Corner lot
- 3,905 sq ft lot
Tags
Neighborhood map
What this means for you Summary
Snapshot
- This is a 4 × 3-bed/2.5-bath units multifamily listed at $200k.
Deal economics
- At list price, monthly cash flow is $1k ($16k/yr) — positive. Per door: $329/mo.
- The deal already cash-flows at list — no discount required.
- Meets the 1% rule at list price ($3k rent vs $200k).
- Recommended offer: $176k (12.0% below list) — sets the bar for market timing.
- Cap rate 14.2% vs local median 4.7% in St. Joseph — top-decile yield for the area; either an underpriced asset or a hidden risk that comps aren't pricing in. Stress-test before assuming the spread holds.
Location & tenants
- Location reads: area grade B — affects rentability + tenant quality, not the cash-flow math above.
- St. Joseph (urban): math 28% / reading 38% proficiency, ranked #241 of 324 in MO (top 74%) — families likely to look elsewhere, expect single-tenant / working-renter base with shorter leases.
- Market conditions: 89 active listings in the ZIP; 70 units permitted in Buchanan County in 2024 (0 in 5+ unit buildings).
Forward outlook
- Local home prices are declining (-3.0%/yr); year-one equity from $1k of loan paydown is wiped out by about $6k of value loss. Plan a longer hold.
- Buchanan County population projected to shrink 6% by 2050 — rents likely to lag national; underwrite the cash flow, not the appreciation.
- At projected returns (-3.0% appreciation + 3.0% rent growth), your $56k cash investment doubles in ~5 years — after that, you're playing with house money.
Negotiation context
- It's been on market 126 days — a 12% lower offer ($176k) is reasonable based on typical stale-listing flexibility.
- 13 sale attempts since 11y ago; this cycle's ask has dropped $49k (20%) from the opening price — seller is motivated, your offer sets the floor, not the list.
Risks & watch-outs
- Watch-outs: built in 1920 — expect roof / HVAC / electrical / plumbing capex.
Questions for the listing agent
- It's been on market 126 days. Have you received any prior offers? Is the seller open to a 12% concession, seller financing, or rate buy-down credit?
- Can we see the unit-by-unit rent roll, current vacancy, and any below-market leases? What's the average tenancy length?
- What capital expenditures (roof, boiler, parking lot, exteriors) have been made in the last 5 years, and what's planned in the next 2?
- Built in 1920 — when were the roof, HVAC, electrical panel, plumbing, and water heater last replaced?
- Why hasn't it sold? Are there any deal-killer items the seller is aware of (foundation, flood, title, zoning, code violations)?
- Is there a deadline driving the sale (1031 exchange, divorce, estate, relocation)? That informs how much negotiation room exists.
- What's the average days-on-market for RENTAL listings here right now (not sales)? A rising rental-DOM trend means longer vacancies and softer asking-rent achievability than the comps imply.
- What's the recent tenant-quality profile in this submarket — average credit score on applications, eviction rate, late-payment / NSF rate, and stable-employment percentage? A property-management company in the area should have these aggregated.
- How much new apartment / multifamily construction is in the pipeline within 1–3 miles? Heavy new supply (>2% of stock underway) typically softens rents 12–24 months out; light construction supports rent growth.
Investment metrics
- 1% rule
- 1.66% ✓
- Cap rate
- 14.19%
- Cash-on-cash
- 28.21%
- DSCR
- 2.26
- GRM
- 5.0
CMA / ARV
- ARV (median comp)
- $125,494
- List price
- $199,995
- Delta
- 59.37%
- Verdict
- OVERPRICED
- Comps
- 14 within 1.0 mi
Projected returns pro-forma
-3.0% appreciation · 3.0% rent growth · sell at horizon
- IRR
- 22.4%
- Equity multiple
- 1.92×
- Total profit
- $51,448
- Equity at exit
- $29,820
- IRR
- 30.4%
- Equity multiple
- 3.73×
- Total profit
- $152,776
- Equity at exit
- $17,292
Cash invested: $55,999 (down + closing). Projections, not guarantees.
Landlord ↔ Tenant lean methodology
- Overall (STATE)
- 81 Strongly Landlord-Friendly
- State Missouri
- 81 Strongly Landlord-Friendly · R+10
- County
- — inherits STATE
- City
- — inherits STATE
ZIP-level market 64503
- Active inventory
- 89
- Price-to-rent
- 20.1×
Monthly cashflow live
- Estimated rent
- $3,312 medium interval (Pro) →
- Mortgage (P&I)
- −$1,049
- Tax from tax record
- −$168 /mo · $2,013/yr
- Insurance
- −$83
- HOA
- −$0
- Vacancy / Maint / Mgmt
- −$696
- Net cashflow
- $1,317
Break-even live
4-unit breakdown (identical units grouped — click to expand)
| Units | Beds | Baths | Est. rent |
|---|---|---|---|
| 4× units | 3 | 2.5 | $3,312 |
| #1 | 3 | 2.5 | $828 |
| #2 | 3 | 2.5 | $828 |
| #3 | 3 | 2.5 | $828 |
| #4 | 3 | 2.5 | $828 |
| Total (4 units) | $3,312 | ||
UW: 25.0% down · 7.5% · 30yr · 1.5% tax · 5.0% vac · 8.0% maint · 8.0% mgmt
Financing live
Cash to close
- Down payment
- $49,999
- Closing costs
- $6,000
- Reserves months
- —
- Total cash needed
- —
Loan-product check · same deal, 3 products live
Conventional
25% down · 7.5% · 30yr
- Down + closing
- —
- Monthly P&I
- —
- Monthly cashflow
- —
- DSCR
- —
- Eligible?
- —
Personal DTI + credit; lowest rate.
DSCR
20% down · 8.5% · 30yr
- Down + closing
- —
- Monthly P&I
- —
- Monthly cashflow
- —
- DSCR
- —
- Eligible?
- —
No personal income docs; deal must DSCR.
Hard money
10% down · 12.0% · 12mo
- Down + closing
- —
- Monthly P&I
- —
- Monthly cashflow
- —
- DSCR
- —
- Eligible?
- —
Short-term bridge; refi at stabilization.
Listing history 50 events
-
2026-06-19days on market $199,995 Active 126 DOM
-
2026-06-18days on market $199,995 Active 125 DOM
-
2026-06-17days on market $199,995 Active 124 DOM
-
2026-06-16days on market $199,995 Active 123 DOM
-
2026-06-15days on market $199,995 Active 122 DOM
-
2026-06-14days on market $199,995 Active 120 DOM
-
2026-06-12pricedays on market $199,995 Active 119 DOM
-
2026-06-09days on market $214,900 Active 116 DOM
-
2026-06-08days on market $214,900 Active 115 DOM
-
2026-06-07days on market $214,900 Active 114 DOM
-
2026-06-03days on market $214,900 Active 110 DOM
-
2026-06-02days on market $214,900 Active 109 DOM
-
2026-06-01days on market $214,900 Active 108 DOM
-
2026-05-31days on market $214,900 Active 107 DOM
-
2026-05-30days on market $214,900 Active 106 DOM
-
2026-05-07price $224,900 345-char remark
Show marketing remark (345 chars)
Lots of updates have been done to this all brick fourplex to get it ready to move into your portfolio. This property boasts separate electric meters with all electric units. Corner lot with little yard maintenance cuts back on overhead. The unites offer lots of natural light and gives them a very roomy feel. Put this one on your must see list.
-
2026-04-06price $229,900 345-char remark
Show marketing remark (345 chars)
Lots of updates have been done to this all brick fourplex to get it ready to move into your portfolio. This property boasts separate electric meters with all electric units. Corner lot with little yard maintenance cuts back on overhead. The unites offer lots of natural light and gives them a very roomy feel. Put this one on your must see list.
-
2026-04-06price $229,000 345-char remark
Show marketing remark (345 chars)
Lots of updates have been done to this all brick fourplex to get it ready to move into your portfolio. This property boasts separate electric meters with all electric units. Corner lot with little yard maintenance cuts back on overhead. The unites offer lots of natural light and gives them a very roomy feel. Put this one on your must see list.
-
2026-03-16price $239,000 345-char remark
Show marketing remark (345 chars)
Lots of updates have been done to this all brick fourplex to get it ready to move into your portfolio. This property boasts separate electric meters with all electric units. Corner lot with little yard maintenance cuts back on overhead. The unites offer lots of natural light and gives them a very roomy feel. Put this one on your must see list.
-
2026-02-13$249,000 Active 345-char remark
Show marketing remark (345 chars)
Lots of updates have been done to this all brick fourplex to get it ready to move into your portfolio. This property boasts separate electric meters with all electric units. Corner lot with little yard maintenance cuts back on overhead. The unites offer lots of natural light and gives them a very roomy feel. Put this one on your must see list.
-
2025-11-05historical
-
2025-07-21price $239,000
-
2025-06-19price $249,000
-
2025-06-10$259,000 Active
-
2024-05-30historical $775
-
2024-05-18$775
-
2024-03-22historical $800
-
2024-03-18$800
-
2024-02-09historical
-
2024-02-06price $149,000
-
2024-02-06status Active
-
2024-01-14status Pending
-
2023-11-13status Active
-
2023-11-07historical Active Under Contract
-
2023-10-24price $160,000
-
2023-10-17price $174,000
-
2023-10-03status Active
-
2023-09-21status Pending
-
2023-09-15price $179,000
-
2023-08-28$185,000 Active
-
2021-07-15soldstatus Closed
-
2021-07-15soldstatus
-
2021-05-12soldstatus
-
2021-04-15status Pending
-
2020-12-22status Active
-
2020-10-16status Pending
-
2020-10-14status Active
-
2020-07-24status Pending
-
2020-07-17status Pending
-
2020-06-23status Active
ⓘ Source: listings_history table (triggers on properties + properties_extension) + one-shot
backfill from property_details.listing_events for pre-trigger history.
Tax reassessment forecast MO · Resets to sale price
- Current annual tax
- $2,013 · $168/mo
- Projected year-2 tax
- $2,013 · $168/mo
- Expected delta
- $0/yr ($0/mo · 0.0%)
ⓘ Screening estimate from a state-policy table — verify with the county assessor before closing.
Climate risk First Street
- Flood 1/10 Low 0% chance over 30 yrs
- Wildfire 1/10 Low
- Heat 4/10 Moderate 7 d/yr ≥106°F today · 16 d/yr by 30 yrs out
- Wind 2/10 Low
- Air quality 2/10 Low 1 unhealthy d/yr today · 1 by 30 yrs out
Nearby sold comps map
Loading sold comps map…
Walkable amenities ~0.75 mi
Loading nearby amenities…
Taxation est. · year 1
- Rental income
- $39,744
- − Mortgage interest
- −$11,203
- − Property taxes
- −$2,013
- − Insurance
- −$1,000
- − Repairs & maintenance
- −$3,180
- − Management
- −$3,180
- − Depreciation
- −$5,818
- Taxable income
- $13,351
- Est. tax owed @ 24.0%
- −$3,204
- After-tax cash flow
- $12,595/yr
For passive investors: Depreciation is non-cash, so a rental often shows a tax loss while cash-flowing — sheltering income. Rental losses are passive: they offset passive income freely, and up to $25,000/yr can offset ordinary (W-2) income if you actively participate and your MAGI is under $100k (phasing out to $0 by $150k); unused losses carry forward. On sale, claimed depreciation is recaptured at up to 25%, and gains may owe capital-gains tax (a 1031 exchange can defer both). Figures are a year-1 estimate at your 24.0% rate — not tax advice; consult a CPA.
Schools (NCES district)
- District
- St. Joseph
- NCES district ID
- 2927060
- Math proficiency
- 28% ▼ -6.00%
- Reading proficiency
- 38% ▼ -1.00%
- Median HH income
- $43,007
- Composite
- 27.99/100
- National rank
- #6853
- State rank
- #241 of 324 in MO
Livability — St. Joseph
No livability data for this city. (Only ~50 U.S. cities are tracked.)
Census & demographics
- Census place
- St. Joseph, MO
- City population
- 44,382
- Population (ZIP)
- 11,921
Population outlook (Buchanan County) Hauer SSP2
- Today (2025)
- 89,041 people
- By 2030
- 88,401 · -0.7%
- By 2040
- 86,220 · -3.2%
- By 2050
- 83,603 · -6.1%
- By 2075
- 76,750 · -13.8%
- By 2100
- 67,623 · -24.1%
Race, ethnicity, and origin ACS 2023
- Neighborhood character
- Predominantly White (85%)
- Race & ethnicity
- White 85% Two or more races 8% Hispanic / Latino 6% Black 3% Asian 1%
- Hispanic origin (detail)
- Mexican 4% Cuban 1%
- Common ancestry
- Romanian 2% Lithuanian 2% Slovak 1%
- Foreign-born
- 3% · Canada
- Languages at home
- 96% English-only · Spanish 2% Other Indo-European 1%
Political lean MEDSL · Buchanan
- 2024 margin
- Strong R (+28.0) · D 35.2% · R 63.3% · Other 1.5%
- 2008→2024 swing
- -28.2pp toward R · 2008: 0.1pp · 2024: -28.0pp
- All cycles
- 2024: R+28.0 2020: R+24.6 2016: R+26.2 2012: R+8.7 2008: D+0.1
Not yet ingested
- Civics
- —
Market trends
- HPI YoY
- ▼ -128.03%
- Current HPI
- 185.3921
- Rent YoY
- —
- Metro
- —
- State GDP YoY
- ▲ 1.84%
- F500 in state
- 20
Industry mix (Fortune 500 HQ in MO)
| Industry | F500 HQs | Revenue |
|---|---|---|
| Healthcare | 1 | $163B |
|
||
| Insurance | 1 | $21B |
|
||
| Industrial Technology | 1 | $17B |
|
||
| Retail | 1 | $16B |
|
||
| Industrial Distribution | 1 | $10B |
|
||
| Utilities | 1 | $9B |
|
||
Price history
+150.2% since first listed38 events — show timeline
- 2026-05-07 Price Changed $224,900 Heartland MLS as Distributed by MLS Grid
- 2026-04-06 Price Changed $229,900 Heartland MLS as Distributed by MLS Grid
- 2026-04-06 Price Changed $229,000 Heartland MLS as Distributed by MLS Grid
- 2026-03-16 Price Changed $239,000 Heartland MLS as Distributed by MLS Grid
- 2026-02-13 Listed $249,000 Heartland MLS as Distributed by MLS Grid
- 2025-11-05 Listing Removed — Heartland MLS as Distributed by MLS Grid
- 2025-07-21 Price Changed $239,000 Heartland MLS as Distributed by MLS Grid
- 2025-06-19 Price Changed $249,000 Heartland MLS as Distributed by MLS Grid
- 2025-06-10 Listed $259,000 Heartland MLS as Distributed by MLS Grid
- 2024-05-30 Rental Removed $775 RENT.
- 2024-05-18 Listed for Rent $775 RENT.
- 2024-03-22 Rental Removed $800 HMLS
- 2024-03-18 Listed for Rent $800 HMLS
- 2024-02-09 Listing Removed — Heartland MLS as Distributed by MLS Grid
- 2024-02-06 Price Changed $149,000 Heartland MLS as Distributed by MLS Grid
- 2024-02-06 Relisted — Heartland MLS as Distributed by MLS Grid
- 2024-01-14 Pending — Heartland MLS as Distributed by MLS Grid
- 2023-11-13 Relisted — Heartland MLS as Distributed by MLS Grid
- 2023-11-07 Contingent — Heartland MLS as Distributed by MLS Grid
- 2023-10-24 Price Changed $160,000 Heartland MLS as Distributed by MLS Grid
- 2023-10-17 Price Changed $174,000 Heartland MLS as Distributed by MLS Grid
- 2023-10-03 Relisted — Heartland MLS as Distributed by MLS Grid
- 2023-09-21 Pending — Heartland MLS as Distributed by MLS Grid
- 2023-09-15 Price Changed $179,000 Heartland MLS as Distributed by MLS Grid
- 2023-08-28 Listed $185,000 Heartland MLS as Distributed by MLS Grid
- 2021-07-15 Sold (Public Records) — Public Records
- 2021-07-15 Sold (MLS) — Heartland MLS as Distributed by MLS Grid
- 2021-05-12 Sold (Public Records) — Public Records
- 2021-04-15 Pending — Heartland MLS as Distributed by MLS Grid
- 2020-12-22 Relisted — Heartland MLS as Distributed by MLS Grid
- 2020-10-16 Pending — Heartland MLS as Distributed by MLS Grid
- 2020-10-14 Relisted — Heartland MLS as Distributed by MLS Grid
- 2020-07-24 Pending — Heartland MLS as Distributed by MLS Grid
- 2020-07-17 Pending — Heartland MLS as Distributed by MLS Grid
- 2020-06-23 Relisted — Heartland MLS as Distributed by MLS Grid
- 2020-03-18 Listing Removed — Heartland MLS as Distributed by MLS Grid
- 2019-05-28 Listed $123,025 Heartland MLS as Distributed by MLS Grid
- 2015-02-27 Listed $89,900 Heartland MLS as Distributed by MLS Grid
Property tax history
+4.0%/yrLatest (2025): $2,013 · +7.4% YoY. Source: county tax records.
Cash-flow waterfall
monthlySold comps — $/sqft
last 12 mo · ≤1 miLoading sold comps…