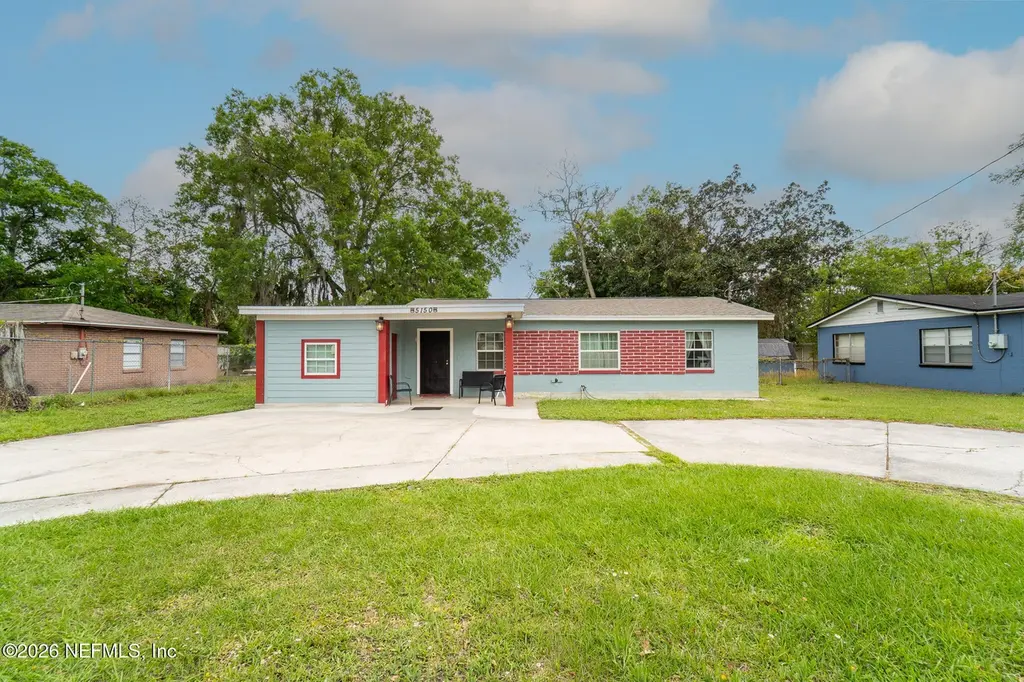
5150 Broadway Ave · Jacksonville, FL
Flood risk 1/10 · Minimal
- FEMA flood zone
- X (unshaded)
- Chance of flooding over 30 yrs
- 0.0%
- Est. flood insurance / yr
- $507 – $1,088
Fire risk 2/10 · Minimal
- Est. fire insurance / yr
- $947 – $1,759
Heat risk 9/10 · Severe
- Hot days now (above 107°F)
- 7 days/yr
- Hot days in 30 yrs
- 20 days/yr
Wind risk 9/10 · Severe
- Chance of severe wind over 30 yrs
- 99.0%
Air-quality risk 5/10 · Moderate
- Unhealthy air days now
- 7 days/yr
- Unhealthy air days in 30 yrs
- 7 days/yr
Risk factors via First Street. Map © Google.
Why this score? — see what drove the D+ grade
The composite is a weighted blend of 9 inputs, each scored 0–100. Each bar is that input's sub-score; the figure is the points it added to the 100-point composite (weight × sub-score).
- Cash flow +15.0/30.0
- Appreciation +6.7/10.0
- DSCR +4.6/10.0
- ARV discount +4.3/15.0
- Livability +4.2/5.0
- Schools +3.9/10.0
- 1% rule +3.3/10.0
- Rent growth +2.9/5.0
- Condition / age +2.5/5.0
$165,000
🖨 Deal sheet 📄 Offer letter ✓ Due diligence
Listing remarks MLS
Great investment property being sold in “As Is” condition. This is a 3 bed room 1.5 bath concrete block home that features living room, family room, Kitchen/dining combo, inside laundry room. Nice back yard. Circular driver that gives more parking. Seller or Broker makes no representations or guarantees. Buyer to verify all information. Employees and family members residing with employees of JPMorgan Chase Bank, N.A, its affiliates or subsidiaries are strictly prohibited from directly or indirectly purchasing any property owned by JPMorgan Chase Bank, N.A. See Document for The seller instruction.
Key facts
- 7,405 sq ft lot
- Built 1952
- Listed 81 days
Property features AI
Finance
- HOA & community: Not a senior community
Exterior
- Parking: Circular driveway
- Utilities: Public sewer; Cable available; Electricity connected; Sewer connected; Water connected
- Home design: Single family residence; Residential use
- Exterior features: Lot approximately 0.17 acres; No private pool
Interior
- Kitchen: Electric range; Microwave; Refrigerator; Dishwasher
- Bedrooms: 3 bedrooms
- Bathrooms: 1 full bathroom
- Heating & cooling: Central heating; Central air
- Interior features: Central heating; Central air
- Laundry & utility: Washer; Dryer
Neighborhood map
What this means for you Summary
Snapshot
- This is a 3-bed/2.0-bath single-family listed at $165k.
Deal economics
- At list price, monthly cash flow is $51 ($607/yr) — positive.
- The deal already cash-flows at list — no discount required.
- To meet the 1% rule (rent ≥ 1% of price), the offer needs to be $137k (17.1% below list).
- Recommended offer: $137k (17.1% below list) — sets the bar for 1% rule.
- Cap rate 6.7% vs local median 4.0% in Jacksonville — top-decile yield for the area; either an underpriced asset or a hidden risk that comps aren't pricing in. Stress-test before assuming the spread holds.
Location & tenants
- Location reads 83/100 on livability (#50 in FL, #911 nationally) — a professional / high-income tenant draw. Strengths: amenities A+, commute A+, housing A+.
- Duval (urban): math 46% / reading 45% proficiency, ranked #48 of 73 in FL (top 66%) — families likely to look elsewhere, expect single-tenant / working-renter base with shorter leases.
- Market conditions: Rents rising (+1.7%/yr); 172 active listings in the ZIP; 40 comparable units currently listed for rent nearby; rentals at typical pace (median 15d on market — plan ~3-4 weeks tenant-placement turnaround); lower-income renter base — watch delinquency; 6,503 units permitted in Duval County in 2024 (1,131 in 5+ unit buildings).
Forward outlook
- In year one you build about $7k of equity ($1k loan paydown + $6k appreciation (3.4% local appreciation)).
- Duval County population projected at +19% by 2050 — long-run rental-demand tailwind backs the buy-and-hold thesis.
- At projected returns (3.4% appreciation + 1.7% rent growth), your $46k cash investment doubles in ~6 years — after that, you're playing with house money.
- By year 6, paydown + projected appreciation supports a ~$36k cash-out refi (75% LTV) — recoverable capital for the next deal without selling this one.
Negotiation context
- It's been on market 81 days — a 6% lower offer ($155k) is reasonable based on typical stale-listing flexibility.
- 3 sale attempts since 12y ago; this cycle's ask has dropped $10k (6%) from the opening price — seller is motivated, your offer sets the floor, not the list.
- Current owner paid $90k; list at $165k implies a 84% gain — meaningful room to come down on a strong offer.
Risks & watch-outs
- Watch-outs: built in 1952 — expect roof / HVAC / electrical / plumbing capex.
- Climate carrying-cost: severe wind risk, 99% chance of damaging wind over 30y; extreme-heat days projected 7→20/yr by 2055 (HVAC capex compounding) — expect insurance premiums to compound above CPI over the hold.
Questions for the listing agent
- It's been on market 81 days. Have you received any prior offers? Is the seller open to a 17% concession, seller financing, or rate buy-down credit?
- Built in 1952 — when were the roof, HVAC, electrical panel, plumbing, and water heater last replaced?
- Why hasn't it sold? Are there any deal-killer items the seller is aware of (foundation, flood, title, zoning, code violations)?
- Is there a deadline driving the sale (1031 exchange, divorce, estate, relocation)? That informs how much negotiation room exists.
- Schools are B-rated — typically a magnet for longer-tenancy family renters. What's the average tenant stay here, and is there a school-zone premium baked into asking?
- The area grade is low — what's the realistic commute time and amenity access for the typical tenant pool here? Any planned neighborhood developments (good or bad) we should know about?
- What's the average days-on-market for RENTAL listings here right now (not sales)? A rising rental-DOM trend means longer vacancies and softer asking-rent achievability than the comps imply.
- What's the recent tenant-quality profile in this submarket — average credit score on applications, eviction rate, late-payment / NSF rate, and stable-employment percentage? A property-management company in the area should have these aggregated.
- How much new for-sale + rental construction is in the pipeline within 1–3 miles? Heavy new supply typically softens prices + rents 12–24 months out; constrained supply supports both.
Investment metrics
- 1% rule
- 0.83% ✗
- Cap rate
- 6.66%
- Cash-on-cash
- 1.31%
- DSCR
- 1.06
- GRM
- 10.1
CMA / ARV
- ARV (on-the-fly)
- $154,056
- Comps found
- 12
Show comp detail 12 sales within ~0.75 mi
| Address | Dist | Beds/Ba | Sqft | Sold | Price | $/sf | Match |
|---|---|---|---|---|---|---|---|
| 5125 Abel Ln | 0.10mi | 4/2.0 (+1) | 1,264 (+8%) | 7mo | $165,000 | $131 | 72 |
| 3425 Greenbrier Dr | 0.48mi | 3/2.0 | 1,224 (+4%) | 1mo | $169,900 | $139 | 70 |
| 3461 Rockwood Dr | 0.38mi | 3/1.0 | 1,222 (+4%) | 2mo | $67,000 | $55 | 70 |
| 3242 Deason Ave | 0.66mi | 3/2.0 | 1,197 (+2%) | 2mo | $223,500 | $187 | 65 |
| 3406 Greenbrier Dr | 0.51mi | 2/1.0 (-1) | 1,184 (+1%) | 2mo | $132,500 | $112 | 65 |
| 5140 Columbus Ave | 0.16mi | 3/1.0 | 1,314 (+12%) | 8mo | $165,000 | $126 | 62 |
| 3334 Mabry Ter | 0.60mi | 2/1.0 (-1) | 1,189 (+1%) | 13mo | $180,000 | $151 | 51 |
| 3315 Sunnybrook Ave N | 0.59mi | 2/1.0 (-1) | 1,212 (+3%) | 10mo | $150,000 | $124 | 50 |
| 718 Melson Ave | 0.71mi | 3/2.0 | 1,287 (+9%) | 6mo | $200,000 | $155 | 46 |
| 3370 Deason Ave | 0.49mi | 3/1.0 | 1,043 (-11%) | 12mo | $110,000 | $105 | 45 |
| 1050 Hood Ave | 0.67mi | 3/1.0 | 1,051 (-11%) | 4mo | $73,000 | $69 | 43 |
| 1056 Hood Ave | 0.68mi | 3/1.0 | 1,024 (-13%) | 2mo | $154,500 | $151 | 41 |
Match score weights: distance 35% · size 25% · config 20% · recency 20%. Top-matched comps best support the ARV.
Projected returns pro-forma
3.41% appreciation · 1.7% rent growth · sell at horizon
- IRR
- 9.2%
- Equity multiple
- 1.54×
- Total profit
- $24,917
- Equity at exit
- $78,056
- IRR
- 10.9%
- Equity multiple
- 2.68×
- Total profit
- $77,414
- Equity at exit
- $123,389
Cash invested: $46,200 (down + closing). Projections, not guarantees.
Landlord ↔ Tenant lean methodology
- Overall (STATE)
- 87 Strongly Landlord-Friendly
- State Florida
- 87 Strongly Landlord-Friendly · R+3
- County
- — inherits STATE
- City
- — inherits STATE
ZIP-level market 32254
- Home prices YoY
- 1.2%
- Rents YoY
- 1.7%
- Active inventory
- 172
- Price-to-rent
- 10.1×
Monthly cashflow live
- Estimated rent
- $1,368 high interval (Pro) →
- Mortgage (P&I)
- −$865
- Tax from tax record
- −$96 /mo · $1,150/yr
- Insurance
- −$69
- HOA
- −$0
- Vacancy / Maint / Mgmt
- −$287
- Net cashflow
- $51
Break-even live
UW: 25.0% down · 7.5% · 30yr · 1.5% tax · 5.0% vac · 8.0% maint · 8.0% mgmt
Financing live
Cash to close
- Down payment
- $41,250
- Closing costs
- $4,950
- Reserves months
- —
- Total cash needed
- —
Loan-product check · same deal, 3 products live
Conventional
25% down · 7.5% · 30yr
- Down + closing
- —
- Monthly P&I
- —
- Monthly cashflow
- —
- DSCR
- —
- Eligible?
- —
Personal DTI + credit; lowest rate.
DSCR
20% down · 8.5% · 30yr
- Down + closing
- —
- Monthly P&I
- —
- Monthly cashflow
- —
- DSCR
- —
- Eligible?
- —
No personal income docs; deal must DSCR.
Hard money
10% down · 12.0% · 12mo
- Down + closing
- —
- Monthly P&I
- —
- Monthly cashflow
- —
- DSCR
- —
- Eligible?
- —
Short-term bridge; refi at stabilization.
Rent comps 40 comps
| Address | Beds | Baths | Sqft | Rent | $/sqft | DOM | Units | Dist |
|---|---|---|---|---|---|---|---|---|
| 5148 Cain Ln Jacksonville, FL | 3.0 | 1.0 | 1104 | $1,306 | $1.18 | 21d | 1 | 0.06mi |
| 5364 Mary Budd Ave Jacksonville, FL | 3.0 | 2.0 | 836 | $1,225 | $1.47 | 3d | 1 | 0.26mi |
| 3433 Brookhaven Dr Jacksonville, FL | 2.0 | 1.0 | 754 | $1,295 | $1.72 | 8d | 1 | 0.41mi |
| 3450 Lowell Ave Jacksonville, FL | 3.0 | 2.0 | 1209 | $1,578 | $1.31 | 24d | 1 | 0.41mi |
| 3350 Sunnybrook Ave N Jacksonville, FL | 2.0 | 1.0 | 900 | $1,095 | $1.22 | 24d | 1 | 0.56mi |
| 3368 Columbus Ave Jacksonville, FL | 2.0 | 1.0 | 955 | $1,300 | $1.36 | 4d | 1 | 0.58mi |
| 3303 Broadway Ave Jacksonville, FL | 3.0 | 2.0 | 1072 | $1,550 | $1.45 | 4d | 1 | 0.62mi |
| 3305 Sunnybrook Ave N Jacksonville, FL | 2.0 | 1.0 | 1012 | $1,021 | $1.01 | 24d | 1 | 0.62mi |
| 3326 W 1st St Jacksonville, FL | 2.0 | 1.0 | 791 | $995 | $1.26 | 24d | 1 | 0.76mi |
| 1021 Woodstock Ave Jacksonville, FL | 3.0 | 2.0 | 1012 | $1,495 | $1.48 | 8d | 1 | 0.76mi |
| 1021 Woodstock Ave Jacksonville, FL | 3.0 | 2.0 | 1012 | $1,495 | $1.48 | 24d | 1 | 0.76mi |
| 5405 Leaming Ave Jacksonville, FL | 3.0 | 1.0 | 924 | $1,199 | $1.30 | 17d | 1 | 0.95mi |
| 3012 Imperial St Jacksonville, FL | 3.0 | 1.0 | 1089 | $1,395 | $1.28 | 24d | 1 | 0.98mi |
| 1305 Melson Ave Jacksonville, FL | 3.0 | 2.0 | 1224 | $1,399 | $1.14 | 20d | 1 | 1.01mi |
| 3034 Detroit Cir E Jacksonville, FL | 3.0 | 2.0 | 1300 | $1,399 | $1.08 | 24d | 1 | 1.05mi |
| 1037 Detroit St Jacksonville, FL | 3.0 | 2.0 | 912 | $1,250 | $1.37 | 2d | 1 | 1.08mi |
| 3055 2nd Street Cir Jacksonville, FL | 3.0 | 1.5 | 1050 | $1,340 | $1.28 | 17d | 1 | 1.09mi |
| 3101 3rd Street Cir N Jacksonville, FL | 2.0 | 1.0 | 870 | $1,150 | $1.32 | 8d | 1 | 1.15mi |
| 3688 Dillon St Jacksonville, FL | 3.0 | 2.0 | 1230 | $1,421 | $1.16 | 24d | 1 | 1.16mi |
| 1227 Dena St Jacksonville, FL | 3.0 | 1.0 | 1033 | $1,325 | $1.28 | 24d | 1 | 1.16mi |
| 2851 Sophia St Jacksonville, FL | 2.0 | 1.0 | 846 | $1,000 | $1.18 | 24d | 3 | 1.25mi |
| 2862 W 1st St Unit 1 Jacksonville, FL | 2.0 | 1.0 | 800 | $895 | $1.12 | 15d | 1 | 1.26mi |
| 2862 W 1st St Jacksonville, FL | 2.0 | 1.0 | 800 | $895 | $1.12 | 4d | 1 | 1.26mi |
| 912 Huron St Jacksonville, FL | 2.0 | 1.0 | 900 | $1,100 | $1.22 | 15d | 1 | 1.26mi |
| 2913 W 2nd St Jacksonville, FL | 2.0 | 1.0 | 720 | $1,000 | $1.39 | 2d | 1 | 1.28mi |
| 2852 W 1st St Jacksonville, FL | 2.0 | 1.0 | 800 | $895 | $1.12 | 8d | 1 | 1.28mi |
| 2965 Sunset St Jacksonville, FL | 3.0 | 2.0 | 1056 | $1,375 | $1.30 | 4d | 1 | 1.28mi |
| 2965 Sunset St Jacksonville, FL | 3.0 | 1.5 | 1056 | $1,375 | $1.30 | 8d | 1 | 1.28mi |
| 1612 Alfen St Jacksonville, FL | 3.0 | 1.5 | 945 | $1,113 | $1.18 | 8d | 1 | 1.29mi |
| 4718 Ramona Blvd Jacksonville, FL | 3.0 | 1.0 | 1085 | $1,595 | $1.47 | 24d | 1 | 1.31mi |
| 3515 Dignan St Jacksonville, FL | 3.0 | 1.0 | 915 | $1,036 | $1.13 | 3d | 1 | 1.33mi |
| 853 Mikael Ave Jacksonville, FL | 3.0 | 2.0 | 1025 | $1,600 | $1.56 | 24d | 1 | 1.34mi |
| 3550 Edison Ave Jacksonville, FL | 3.0 | 2.0 | 1230 | $1,463 | $1.19 | 4d | 1 | 1.36mi |
| 3352 Dillon St Jacksonville, FL | 3.0 | 2.0 | 1229 | $1,372 | $1.12 | 24d | 1 | 1.36mi |
| 2939 W 6th St Jacksonville, FL | 3.0 | 2.0 | 1269 | $1,225 | $0.97 | 2d | 1 | 1.37mi |
| 2902 W 5th St Jacksonville, FL | 3.0 | 2.0 | 1379 | $1,050 | $0.76 | 8d | 1 | 1.38mi |
| 214 Santa Barbara Ave Jacksonville, FL | 3.0 | 2.0 | 1127 | $1,308 | $1.16 | 15d | 1 | 1.39mi |
| 841 Ontario St Jacksonville, FL | 2.0 | 1.0 | 1000 | $1,285 | $1.28 | 24d | 1 | 1.40mi |
| 628 Meteor St Jacksonville, FL | 3.0 | 1.0 | 1123 | $1,395 | $1.24 | 24d | 1 | 1.40mi |
| 740 Ernona St Jacksonville, FL | 2.0 | 1.0 | 800 | $1,200 | $1.50 | 8d | 1 | 1.43mi |
Listing history 20 events
-
2026-06-16status $165,000 Pending 81 DOM
-
2026-06-15days on market $165,000 Active Under Contract 81 DOM
-
2026-06-13days on market $165,000 Active Under Contract 78 DOM
-
2026-06-10days on market $165,000 Active Under Contract 75 DOM
-
2026-06-08days on market $165,000 Active Under Contract 74 DOM
-
2026-06-07statusdays on market $165,000 Active Under Contract 73 DOM
-
2026-06-03days on market $165,000 Active 69 DOM
-
2026-06-02days on market $165,000 Active 68 DOM
-
2026-06-01days on market $165,000 Active 67 DOM
-
2026-05-31days on market $165,000 Active 66 DOM
-
2026-05-18price $165,000
-
2026-03-26$175,000 Active
-
2018-11-08soldstatus $89,900
-
2018-08-19status Pending
-
2018-08-11$89,900 Active
-
2014-10-17soldstatus $16,000 Sold 616-char remark
Show marketing remark (616 chars)
Great investment property being sold in “As Is” condition. This is a 3 bed room 1.5 bath concrete block home that features living room, family room, Kitchen/dining combo, inside laundry room. Nice back yard. Circular driver that gives more parking. Seller or Broker makes no representations or guarantees. Buyer to verify all information. Employees and family members residing with employees of JPMorgan Chase Bank, N.A, its affiliates or subsidiaries are strictly prohibited from directly or indirectly purchasing any property owned by JPMorgan Chase Bank, N.A. See Document for The seller instruction.
-
2014-10-15status Pending 616-char remark
Show marketing remark (616 chars)
Great investment property being sold in “As Is” condition. This is a 3 bed room 1.5 bath concrete block home that features living room, family room, Kitchen/dining combo, inside laundry room. Nice back yard. Circular driver that gives more parking. Seller or Broker makes no representations or guarantees. Buyer to verify all information. Employees and family members residing with employees of JPMorgan Chase Bank, N.A, its affiliates or subsidiaries are strictly prohibited from directly or indirectly purchasing any property owned by JPMorgan Chase Bank, N.A. See Document for The seller instruction.
-
2014-08-21$19,900 Active 616-char remark
Show marketing remark (616 chars)
Great investment property being sold in “As Is” condition. This is a 3 bed room 1.5 bath concrete block home that features living room, family room, Kitchen/dining combo, inside laundry room. Nice back yard. Circular driver that gives more parking. Seller or Broker makes no representations or guarantees. Buyer to verify all information. Employees and family members residing with employees of JPMorgan Chase Bank, N.A, its affiliates or subsidiaries are strictly prohibited from directly or indirectly purchasing any property owned by JPMorgan Chase Bank, N.A. See Document for The seller instruction.
-
2004-04-30soldstatus $75,000
-
1980-09-01soldstatus $29,000
ⓘ Source: listings_history table (triggers on properties + properties_extension) + one-shot
backfill from property_details.listing_events for pre-trigger history.
Tax reassessment forecast FL · Resets to sale price
- Current annual tax
- $1,150 · $96/mo
- Projected year-2 tax
- $1,370 · $114/mo
- Expected delta
- +$220/yr (+$18/mo · 19.1%)
ⓘ Screening estimate from a state-policy table — verify with the county assessor before closing.
Climate risk First Street
- Flood 1/10 Low FEMA zone X (unshaded) · 0% chance over 30 yrs
- Wildfire 2/10 Low
- Heat 9/10 Extreme 7 d/yr ≥107°F today · 20 d/yr by 30 yrs out
- Wind 9/10 Extreme 99% chance of damaging wind over 30 yrs
- Air quality 5/10 Major 7 unhealthy d/yr today · 7 by 30 yrs out
Nearby sold comps map
Loading sold comps map…
Walkable amenities ~0.75 mi
Loading nearby amenities…
Taxation est. · year 1
- Rental income
- $16,412
- − Mortgage interest
- −$9,243
- − Property taxes
- −$1,150
- − Insurance
- −$825
- − Repairs & maintenance
- −$1,313
- − Management
- −$1,313
- − Depreciation
- −$4,800
- Taxable loss
- −$2,232
- Est. tax savings @ 24.0%
- +$536
- After-tax cash flow
- $1,142/yr
For passive investors: Depreciation is non-cash, so a rental often shows a tax loss while cash-flowing — sheltering income. Rental losses are passive: they offset passive income freely, and up to $25,000/yr can offset ordinary (W-2) income if you actively participate and your MAGI is under $100k (phasing out to $0 by $150k); unused losses carry forward. On sale, claimed depreciation is recaptured at up to 25%, and gains may owe capital-gains tax (a 1031 exchange can defer both). Figures are a year-1 estimate at your 24.0% rate — not tax advice; consult a CPA.
Schools (NCES district)
- District
- Duval
- NCES district ID
- 1200480
- Math proficiency
- 46% ▼ -11.00%
- Reading proficiency
- 45% ▼ -4.00%
- Median HH income
- $48,987
- Composite
- 38.97/100
- National rank
- #4076
- State rank
- #48 of 73 in FL
Livability — Jacksonville
- Score
- 83/100
- State rank
- #50
- US rank
- #911
Category grades
Schools grade is shown separately in the Schools card above.
Census & demographics
- Census place
- Jacksonville, FL
- County
- Duval County · 1,015,274 people
- City population
- 979,034
- Metro
- Jacksonville, FL
- Population (ZIP)
- 13,927
- Household income
- $34,953
- Rent vs Own
- Severe rent burden
- 882.0
Population outlook (Duval County) Hauer SSP2
- Today (2025)
- 1,013,010 people
- By 2030
- 1,059,228 · +4.6%
- By 2040
- 1,141,439 · +12.7%
- By 2050
- 1,205,258 · +19.0%
- By 2075
- 1,324,282 · +30.7%
- By 2100
- 1,319,620 · +30.3%
Race, ethnicity, and origin ACS 2023
- Neighborhood character
- Diverse neighborhood (Simpson 0.56)
- Race & ethnicity
- Black 60% White 28% Two or more races 7% Hispanic / Latino 5%
- Hispanic origin (detail)
- Puerto Rican 1%
- Common ancestry
- Slovak 1% Hispanic 1% Lithuanian 1%
- Foreign-born
- 4% · Canada
- Languages at home
- 94% English-only · Spanish 4% French/Haitian/Cajun 2%
Political lean MEDSL · Duval
- 2024 margin
- Toss-up / Even · D 48.7% · R 50.1% · Other 1.2%
- 2008→2024 swing
- +0.4pp no change · 2008: -1.9pp · 2024: -1.5pp
- All cycles
- 2024: R+1.5 2020: D+3.8 2016: R+1.5 2012: R+3.6 2008: R+1.9
Not yet ingested
- Civics
- —
Market trends
- HPI YoY
- ▲ 3.41%
- Current HPI
- 282.2981
- Rent YoY
- ▲ 1.70%
- Metro
- Jacksonville, FL
- State GDP YoY
- ▲ 3.28%
- F500 in state
- 36
Industry mix (Fortune 500 HQ in FL)
| Industry | F500 HQs | Revenue |
|---|---|---|
| Industrial Technology | 2 | $29B |
|
||
| Insurance | 2 | $17B |
|
||
| Retail | 1 | $60B |
|
||
| Technology Distribution | 1 | $58B |
|
||
| Homebuilding | 1 | $35B |
|
||
| Technology Manufacturing | 1 | $35B |
|
||
Price history
+469.0% since first listed10 events — show timeline
- 2026-05-18 Price Changed $165,000 realMLS
- 2026-03-26 Listed $175,000 realMLS
- 2018-11-08 Sold (Public Records) $89,900 Public Records
- 2018-08-19 Pending — realMLS
- 2018-08-11 Listed $89,900 realMLS
- 2014-10-17 Sold (MLS) $16,000 realMLS
- 2014-10-15 Pending — realMLS
- 2014-08-21 Listed $19,900 realMLS
- 2004-04-30 Sold (Public Records) $75,000 Public Records
- 1980-09-01 Sold (Public Records) $29,000 Public Records
Property tax history
+4.2%/yrLatest (2025): $1,150 · +21.4% YoY. Source: county tax records.
Cash-flow waterfall
monthlySold comps — $/sqft
last 12 mo · ≤1 miLoading sold comps…