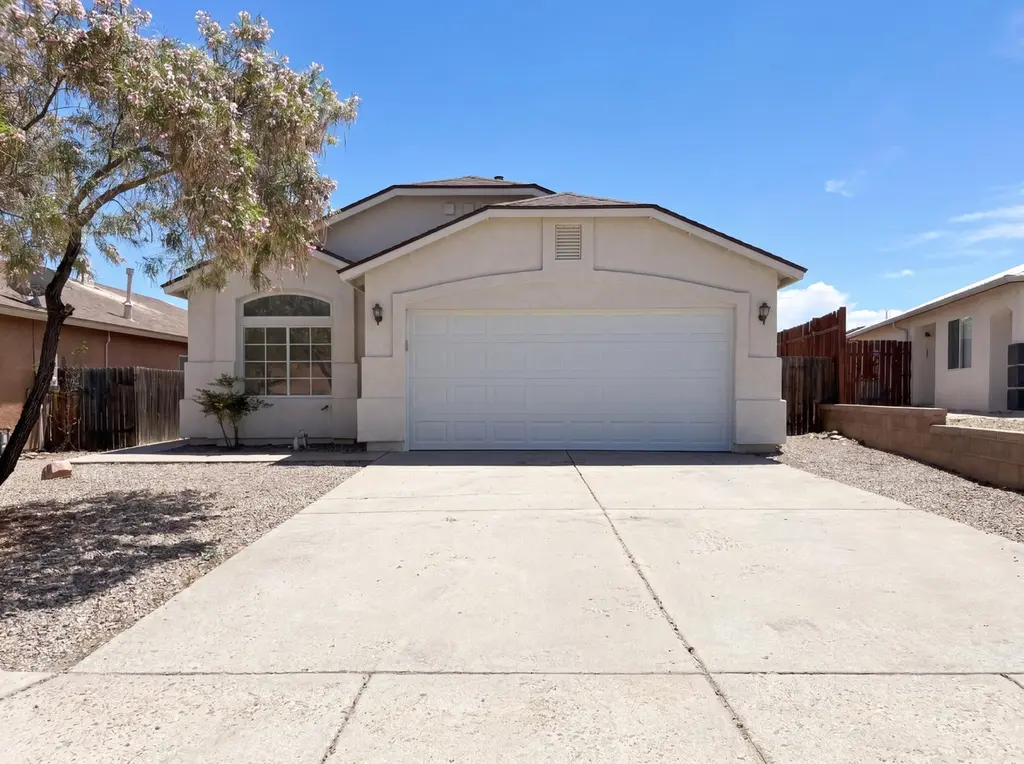
6948 Angela Dr NE · Rio Rancho, NM
Flood risk 1/10 · Minimal
- FEMA flood zone
- X (unshaded)
- Chance of flooding over 30 yrs
- 0.0%
- Est. flood insurance / yr
- $507 – $1,088
Fire risk 4/10 · Minor
- Est. fire insurance / yr
- $706 – $1,312
Heat risk 4/10 · Minor
- Hot days now (above 96°F)
- 7 days/yr
- Hot days in 30 yrs
- 18 days/yr
Wind risk 1/10 · Minimal
- Chance of severe wind over 30 yrs
- —
Air-quality risk 3/10 · Minor
- Unhealthy air days now
- 2 days/yr
- Unhealthy air days in 30 yrs
- 3 days/yr
Risk factors via First Street. Map © Google.
Why this score? — see what drove the D- grade
The composite is a weighted blend of 9 inputs, each scored 0–100. Each bar is that input's sub-score; the figure is the points it added to the 100-point composite (weight × sub-score).
- Cash flow +10.7/30.0
- Schools +5.2/10.0
- ARV discount +4.9/15.0
- Rent growth +4.2/5.0
- Livability +3.6/5.0
- DSCR +3.1/10.0
- Condition / age +2.5/5.0
- 1% rule +2.1/10.0
- Appreciation +0.0/10.0
$290,000
🖨 Deal sheet 📄 Offer letter ✓ Due diligence
Listing remarks
Meet 6948 Angela Dr NE, recently updated with a new roof and fresh interior paint throughout. The kitchen includes all stainless steel appliances, and a partial flooring replacement complements the overall refreshed interior. The primary bathroom features double sinks. Outside, a functional patio extends to a fenced in backyard. This residence is a blend of modern updates and practical comfort, ready for you. . Included 100-Day Home Warranty with buyer activation
Key facts
- Double sinks
- Functional patio
- Fresh interior paint
Tags
Property features AI
Exterior
- Parking: Attached 2-car garage
- Utilities: Electricity connected; Natural gas connected; Public sewer; Public water
- Home design: Single-story; Faces north
- Construction: Built by Longford; Frame, stucco, and rock exterior; Composition roof
- Exterior features: Back yard fencing; Lot approximately 0.11 acres; Zoned R-1; Resale condition
Interior
- Kitchen: Dishwasher; Microwave
- Flooring: Carpet; Tile
- Bathrooms: 2 full bathrooms
- Heating & cooling: Forced air heating; Natural gas heating
- Interior features: Main level primary bedroom; Metal windows
- Laundry & utility: Washer hookup; Electric dryer hookup; Gas dryer hookup
Neighborhood map
What this means for you Summary
Snapshot
- This is a 3-bed/2.0-bath single-family listed at $290k.
Deal economics
- At list price, monthly cash flow is $-139 ($-2k/yr) — negative.
- To cash-flow at today's rent, offer at most $265k (8.5% below list).
- To meet the 1% rule (rent ≥ 1% of price), the offer needs to be $207k (28.6% below list).
- Recommended offer: $207k (28.6% below list) — sets the bar for 1% rule.
- Cap rate 5.7% vs local median 3.6% in Rio Rancho — top-decile yield for the area; either an underpriced asset or a hidden risk that comps aren't pricing in. Stress-test before assuming the spread holds.
Location & tenants
- Location reads 71/100 on livability (#17 in NM) — a middle-class / working-renter tenant base. Strengths: housing A+, cost of living A; Watch: schools C-, amenities D, commute F.
- Rio Rancho Public Schools (suburban): math 48% / reading 73% proficiency, ranked #4 of 29 in NM (top 14%) — acceptable for families but not a draw, mixed tenant base, ~2y average lease.
- Market conditions: Rents rising fast (+6.9%/yr); 1315 active listings in the ZIP; 2 comparable units currently listed for rent nearby; solid renter incomes; 1,278 units permitted in Sandoval County in 2024 (216 in 5+ unit buildings).
Forward outlook
- Local home prices are declining (-3.0%/yr); year-one equity from $2k of loan paydown is wiped out by about $9k of value loss. Plan a longer hold.
- Sandoval County population projected at +15% by 2050 — long-run rental-demand tailwind backs the buy-and-hold thesis.
Negotiation context
- Only 8 days on market — expect competitive offers; lowballing is unlikely to land.
- 2 sale attempts since 8y ago with the ask held roughly flat each time — persistent listings suggest the price (not the market) is what's stuck; bring a comps-based counter.
Questions for the listing agent
- What do current leases actually rent for vs. the listed asking? Can we see a recent rent roll and the last 12 months of T-12 income?
- Is there a deadline driving the sale (1031 exchange, divorce, estate, relocation)? That informs how much negotiation room exists.
- The area grade is low — what's the realistic commute time and amenity access for the typical tenant pool here? Any planned neighborhood developments (good or bad) we should know about?
- What's the average days-on-market for RENTAL listings here right now (not sales)? A rising rental-DOM trend means longer vacancies and softer asking-rent achievability than the comps imply.
- What's the recent tenant-quality profile in this submarket — average credit score on applications, eviction rate, late-payment / NSF rate, and stable-employment percentage? A property-management company in the area should have these aggregated.
- How much new for-sale + rental construction is in the pipeline within 1–3 miles? Heavy new supply typically softens prices + rents 12–24 months out; constrained supply supports both.
Investment metrics
- 1% rule
- 0.71% ✗
- Cap rate
- 5.72%
- Cash-on-cash
- -2.05%
- DSCR
- 0.91
- GRM
- 11.7
CMA / ARV
- ARV (on-the-fly)
- $274,347
- Comps found
- 6
Show comp detail 6 sales within ~0.75 mi
| Address | Dist | Beds/Ba | Sqft | Sold | Price | $/sf | Match |
|---|---|---|---|---|---|---|---|
| 4705 Trenton Hills Dr NE | 0.47mi | 3/2.0 | 1,130 (+0%) | 1mo | $318,000 | $281 | 77 |
| 6924 Angela Dr NE | 0.05mi | 3/2.0 | 1,170 (+4%) | 19mo | $250,000 | $214 | 76 |
| 6904 Glen Hills Dr NE | 0.17mi | 3/2.0 | 1,281 (+14%) | 7mo | $295,000 | $230 | 63 |
| 7019 Clark Hills Dr NE | 0.19mi | 3/2.0 | 1,254 (+11%) | 21mo | $315,000 | $251 | 55 |
| 7160 Labrador Dr NE | 0.54mi | 3/2.0 | 1,152 (+2%) | 21mo | $279,900 | $243 | 54 |
| 7005 Christopher Ct NE | 0.63mi | 3/2.0 | 1,267 (+12%) | 1mo | $275,000 | $217 | 49 |
Match score weights: distance 35% · size 25% · config 20% · recency 20%. Top-matched comps best support the ARV.
Projected returns pro-forma
-3.0% appreciation · 6.88% rent growth · sell at horizon
- IRR
- -16.0%
- Equity multiple
- 0.41×
- Total profit
- $-47,542
- Equity at exit
- $43,240
- IRR
- -2.5%
- Equity multiple
- 0.80×
- Total profit
- $-15,891
- Equity at exit
- $25,074
Cash invested: $81,200 (down + closing). Projections, not guarantees.
Landlord ↔ Tenant lean methodology
- Overall (STATE)
- 55 Moderately Landlord-Leaning
- State New Mexico
- 55 Moderately Landlord-Leaning · D+3
- County
- — inherits STATE
- City
- — inherits STATE
ZIP-level market 87144
- Home prices YoY
- -30.8%
- Rents YoY
- 6.9%
- Active inventory
- 1315
- Price-to-rent
- 11.7×
Monthly cashflow live
- Estimated rent
- $2,071 medium interval (Pro) →
- Mortgage (P&I)
- −$1,521
- Tax from tax record
- −$133 /mo · $1,594/yr
- Insurance
- −$121
- HOA
- −$0
- Vacancy / Maint / Mgmt
- −$435
- Net cashflow
- $-139
Break-even live
UW: 25.0% down · 7.5% · 30yr · 1.5% tax · 5.0% vac · 8.0% maint · 8.0% mgmt
Financing live
Cash to close
- Down payment
- $72,500
- Closing costs
- $8,700
- Reserves months
- —
- Total cash needed
- —
Loan-product check · same deal, 3 products live
Conventional
25% down · 7.5% · 30yr
- Down + closing
- —
- Monthly P&I
- —
- Monthly cashflow
- —
- DSCR
- —
- Eligible?
- —
Personal DTI + credit; lowest rate.
DSCR
20% down · 8.5% · 30yr
- Down + closing
- —
- Monthly P&I
- —
- Monthly cashflow
- —
- DSCR
- —
- Eligible?
- —
No personal income docs; deal must DSCR.
Hard money
10% down · 12.0% · 12mo
- Down + closing
- —
- Monthly P&I
- —
- Monthly cashflow
- —
- DSCR
- —
- Eligible?
- —
Short-term bridge; refi at stabilization.
Rent comps 2 comps
| Address | Beds | Baths | Sqft | Rent | $/sqft | DOM | Units | Dist |
|---|---|---|---|---|---|---|---|---|
| 4401 Safelite Blvd NE Rio Rancho, NM | 1.0–3.0 | 1.0–2.0 | 900 | $1,810 | $2.01 | 1d | 4 | 0.87mi |
| 4401 Safelite Blvd NE Rio Rancho, NM | 1.0–3.0 | 1.0–2.0 | 900 | $1,810 | $2.01 | 43d | 4 | 0.87mi |
Listing history 9 events
-
2026-06-18days on market $290,000 Active 8 DOM
-
2026-06-17days on market $290,000 Active 7 DOM
-
2026-06-16status $290,000 Active 6 DOM
-
2026-06-13statusdays on market $290,000 Pending 6 DOM
-
2026-06-10days on market $290,000 Active 5 DOM
-
2026-06-09days on market $290,000 Active 4 DOM
-
2026-06-08days on market $290,000 Active 3 DOM
-
2026-06-07remarks 467-char remark
-
2026-06-07$290,000 Active 2 DOM
ⓘ Source: listings_history table (triggers on properties + properties_extension) + one-shot
backfill from property_details.listing_events for pre-trigger history.
Tax reassessment forecast NM · Resets to sale price
- Current annual tax
- $1,594 · $133/mo
- Projected year-2 tax
- $2,320 · $193/mo
- Expected delta
- +$726/yr (+$60/mo · 45.5%)
ⓘ Screening estimate from a state-policy table — verify with the county assessor before closing.
Climate risk First Street
- Flood 1/10 Low FEMA zone X (unshaded) · 0% chance over 30 yrs
- Wildfire 4/10 Moderate
- Heat 4/10 Moderate 7 d/yr ≥96°F today · 18 d/yr by 30 yrs out
- Wind 1/10 Low
- Air quality 3/10 Moderate 2 unhealthy d/yr today · 3 by 30 yrs out
Nearby sold comps map
Loading sold comps map…
Walkable amenities ~0.75 mi
Loading nearby amenities…
Taxation est. · year 1
- Rental income
- $24,847
- − Mortgage interest
- −$16,245
- − Property taxes
- −$1,594
- − Insurance
- −$1,450
- − Repairs & maintenance
- −$1,988
- − Management
- −$1,988
- − Depreciation
- −$8,436
- Taxable loss
- −$6,854
- Est. tax savings @ 24.0%
- +$1,645
- After-tax cash flow
- $-20/yr
For passive investors: Depreciation is non-cash, so a rental often shows a tax loss while cash-flowing — sheltering income. Rental losses are passive: they offset passive income freely, and up to $25,000/yr can offset ordinary (W-2) income if you actively participate and your MAGI is under $100k (phasing out to $0 by $150k); unused losses carry forward. On sale, claimed depreciation is recaptured at up to 25%, and gains may owe capital-gains tax (a 1031 exchange can defer both). Figures are a year-1 estimate at your 24.0% rate — not tax advice; consult a CPA.
Schools (NCES district)
- District
- Rio Rancho Public Schools
- NCES district ID
- 3500010
- Math proficiency
- 48% ▲ 38.00%
- Reading proficiency
- 73% ▲ 48.00%
- Median HH income
- $59,410
- Composite
- 52.29/100
- National rank
- #1595
- State rank
- #4 of 29 in NM
Livability — Rio Rancho
- Score
- 71/100
- State rank
- #17
- US rank
- #7253
Category grades
Schools grade is shown separately in the Schools card above.
Census & demographics
- Census place
- Rio Rancho, NM
- County
- Sandoval County · 110,336 people
- City population
- 110,336
- Metro
- Albuquerque, NM
- Population (ZIP)
- 51,837
- Household income
- $94,550
- Rent vs Own
- Severe rent burden
- 528.0
Population outlook (Sandoval County) Hauer SSP2
- Today (2025)
- 155,072 people
- By 2030
- 161,714 · +4.3%
- By 2040
- 171,831 · +10.8%
- By 2050
- 178,536 · +15.1%
- By 2075
- 192,517 · +24.1%
- By 2100
- 197,952 · +27.7%
Race, ethnicity, and origin ACS 2023
- Neighborhood character
- Diverse neighborhood (Simpson 0.61)
- Race & ethnicity
- White 44% Hispanic / Latino 44% Two or more races 24% Native American 4% Black 3% Asian 1%
- Hispanic origin (detail)
- Mexican 23% Puerto Rican 1%
- Common ancestry
- Slovak 3% Lithuanian 3% Italian 2%
- Foreign-born
- 5% · Canada
- Languages at home
- 80% English-only · Spanish 16%
Political lean MEDSL · Sandoval
- 2024 margin
- Lean D (+5.8) · D 51.8% · R 46.0% · Other 2.2%
- 2008→2024 swing
- -7.0pp toward R · 2008: 12.8pp · 2024: 5.8pp
- All cycles
- 2024: D+5.8 2020: D+8.4 2016: D+2.7 2012: D+5.1 2008: D+12.8
Not yet ingested
- Civics
- —
Market trends
- HPI YoY
- ▼ -95.68%
- Current HPI
- 215.124
- Rent YoY
- ▲ 6.88%
- Metro
- Albuquerque, NM
- State GDP YoY
- —
- F500 in state
- 0
Price history
+93.5% since first listed5 events — show timeline
- 2026-06-05 Listed $290,000 Southwest MLS
- 2026-05-20 Sold (Public Records) — Public Records
- 2018-10-27 Delisted — Southwest MLS
- 2018-09-20 Pending — Southwest MLS
- 2018-09-14 Listed $149,900 Southwest MLS
Property tax history
+1.0%/yrLatest (2024): $1,594 · +3.1% YoY. Source: county tax records.
Cash-flow waterfall
monthlySold comps — $/sqft
last 12 mo · ≤1 miLoading sold comps…