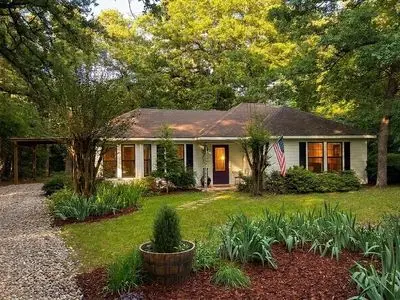
129 Valleywood Gln · Holly Lake Ranch, TX
Flood risk 1/10 · Minimal
- FEMA flood zone
- X (unshaded)
- Chance of flooding over 30 yrs
- 0.0%
- Est. flood insurance / yr
- $507 – $1,088
Fire risk 5/10 · Moderate
- Est. fire insurance / yr
- $1,222 – $2,270
Heat risk 7/10 · Major
- Hot days now (above 110°F)
- 7 days/yr
- Hot days in 30 yrs
- 25 days/yr
Wind risk 6/10 · Moderate
- Chance of severe wind over 30 yrs
- 51.0%
Air-quality risk 2/10 · Minimal
- Unhealthy air days now
- 1 days/yr
- Unhealthy air days in 30 yrs
- 1 days/yr
Risk factors via First Street. Map © Google.
Why this score? — see what drove the D+ grade
The composite is a weighted blend of 9 inputs, each scored 0–100. Each bar is that input's sub-score; the figure is the points it added to the 100-point composite (weight × sub-score).
- Cash flow +15.2/30.0
- Appreciation +6.5/10.0
- ARV discount +6.1/15.0
- DSCR +4.7/10.0
- 1% rule +3.8/10.0
- Schools +3.6/10.0
- Livability +3.3/5.0
- Rent growth +2.5/5.0
- Condition / age +2.5/5.0
$190,000
🖨 Deal sheet 📄 Offer letter ✓ Due diligence
Listing remarks
Discover the charm of tranquil living at 129 Valleywood Glen. This delightful cottage-style home offers a cozy and inviting retreat, perfectly situated in the heart of the desirable Holly Lake Ranch community. Property Overview This charming cottage design emphasizes comfort and character. The home features two bedrooms and one well-appointed bathroom. Designed with versatility in mind, the layout offers excellent potential for an easy conversion to a 2-bathroom home, allowing for increased functionality and future equity growth. The home also boasts a convenient carport and a flexible dining space that is perfectly suited for entertaining guests. Outdoor Living & amp; Entertaining The
Key facts
- Vegetable gardens
- Hand painted details
- Covered back patio
Tags
Neighborhood map
What this means for you Summary
Snapshot
- This is a 2-bed/3.0-bath single-family listed at $190k.
Deal economics
- At list price, monthly cash flow is $65 ($786/yr) — positive.
- The deal already cash-flows at list — no discount required.
- To meet the 1% rule (rent ≥ 1% of price), the offer needs to be $167k (12.1% below list).
- Recommended offer: $167k (12.1% below list) — sets the bar for 1% rule.
- Cap rate 6.7% vs local median 3.8% in Holly Lake Ranch — top-decile yield for the area; either an underpriced asset or a hidden risk that comps aren't pricing in. Stress-test before assuming the spread holds.
Location & tenants
- Location reads 66/100 on livability (#597 in TX) — a middle-class / working-renter tenant base. Strengths: crime A+, cost of living A+, housing A+; Watch: schools D-, amenities F, commute F.
- Hawkins ISD (rural): math 42% / reading 43% proficiency, ranked #339 of 826 in TX (top 41%) — families likely to look elsewhere, expect single-tenant / working-renter base with shorter leases.
- Market conditions: 216 active listings in the ZIP; 72 units permitted in Wood County in 2024 (29 in 5+ unit buildings).
Forward outlook
- In year one you build about $7k of equity ($1k loan paydown + $6k appreciation (3.1% local appreciation)).
- Wood County population projected at +12% by 2050 — modest demand growth; plan on rents tracking national, not racing it.
- At projected returns (3.1% appreciation + 3.0% rent growth), your $53k cash investment doubles in ~6 years — after that, you're playing with house money.
- By year 5, paydown + projected appreciation supports a ~$31k cash-out refi (75% LTV) — recoverable capital for the next deal without selling this one.
Negotiation context
- Only 14 days on market — expect competitive offers; lowballing is unlikely to land.
Risks & watch-outs
- Climate carrying-cost: major wind risk, 51% chance of damaging wind over 30y; moderate wildfire risk; extreme-heat days projected 7→25/yr by 2055 (HVAC capex compounding) — expect insurance premiums to compound above CPI over the hold.
Questions for the listing agent
- Is there a deadline driving the sale (1031 exchange, divorce, estate, relocation)? That informs how much negotiation room exists.
- Schools are D-rated, which usually means shorter tenancies and higher turnover. Who's the typical renter profile here, and what's been the actual vacancy rate?
- The area grade is low — what's the realistic commute time and amenity access for the typical tenant pool here? Any planned neighborhood developments (good or bad) we should know about?
- What's the average days-on-market for RENTAL listings here right now (not sales)? A rising rental-DOM trend means longer vacancies and softer asking-rent achievability than the comps imply.
- What's the recent tenant-quality profile in this submarket — average credit score on applications, eviction rate, late-payment / NSF rate, and stable-employment percentage? A property-management company in the area should have these aggregated.
- How much new for-sale + rental construction is in the pipeline within 1–3 miles? Heavy new supply typically softens prices + rents 12–24 months out; constrained supply supports both.
Investment metrics
- 1% rule
- 0.88% ✗
- Cap rate
- 6.71%
- Cash-on-cash
- 1.48%
- DSCR
- 1.07
- GRM
- 9.5
CMA / ARV
- ARV (on-the-fly)
- $184,305
- Comps found
- 6
Show comp detail 6 sales within ~0.75 mi
| Address | Dist | Beds/Ba | Sqft | Sold | Price | $/sf | Match |
|---|---|---|---|---|---|---|---|
| 177 Woodfern Gln | 0.10mi | 2/2.0 | 1,106 (-1%) | 8mo | $182,000 | $165 | 83 |
| 121 Candlelight Cv | 0.39mi | 2/2.0 | 1,106 (-1%) | 2mo | $176,900 | $160 | 74 |
| 126 Valleywood Gln | 0.05mi | 3/2.0 (+1) | 1,036 (-7%) | 22mo | $168,999 | $163 | 58 |
| 1796 Valleywood Trl | 0.12mi | 2/3.0 | 1,238 (+11%) | 23mo | $219,500 | $177 | 58 |
| 192 Drifting Cloud | 0.37mi | 2/2.0 | 1,250 (+12%) | 14mo | $225,000 | $180 | 48 |
| 1161 Valleywood Trl | 0.70mi | 2/2.0 | 986 (-12%) | 9mo | $163,000 | $165 | 36 |
Match score weights: distance 35% · size 25% · config 20% · recency 20%. Top-matched comps best support the ARV.
Projected returns pro-forma
3.1% appreciation · 3.0% rent growth · sell at horizon
- IRR
- 9.1%
- Equity multiple
- 1.53×
- Total profit
- $28,019
- Equity at exit
- $86,466
- IRR
- 11.5%
- Equity multiple
- 2.74×
- Total profit
- $92,713
- Equity at exit
- $134,064
Cash invested: $53,200 (down + closing). Projections, not guarantees.
Landlord ↔ Tenant lean methodology
- Overall (STATE)
- 87 Strongly Landlord-Friendly
- State Texas
- 87 Strongly Landlord-Friendly · R+5
- County
- — inherits STATE
- City
- — inherits STATE
ZIP-level market 75765
- Home prices YoY
- 1.3%
- Active inventory
- 216
- Price-to-rent
- 9.5×
Monthly cashflow live
- Estimated rent
- $1,670 medium interval (Pro) →
- Mortgage (P&I)
- −$996
- Tax from tax record
- −$178 /mo · $2,136/yr
- Insurance
- −$79
- HOA
- −$0
- Vacancy / Maint / Mgmt
- −$351
- Net cashflow
- $65
Break-even live
UW: 25.0% down · 7.5% · 30yr · 1.5% tax · 5.0% vac · 8.0% maint · 8.0% mgmt
Financing live
Cash to close
- Down payment
- $47,500
- Closing costs
- $5,700
- Reserves months
- —
- Total cash needed
- —
Loan-product check · same deal, 3 products live
Conventional
25% down · 7.5% · 30yr
- Down + closing
- —
- Monthly P&I
- —
- Monthly cashflow
- —
- DSCR
- —
- Eligible?
- —
Personal DTI + credit; lowest rate.
DSCR
20% down · 8.5% · 30yr
- Down + closing
- —
- Monthly P&I
- —
- Monthly cashflow
- —
- DSCR
- —
- Eligible?
- —
No personal income docs; deal must DSCR.
Hard money
10% down · 12.0% · 12mo
- Down + closing
- —
- Monthly P&I
- —
- Monthly cashflow
- —
- DSCR
- —
- Eligible?
- —
Short-term bridge; refi at stabilization.
Listing history 12 events
-
2026-06-19days on market $190,000 Active 14 DOM
-
2026-06-18days on market $190,000 Active 13 DOM
-
2026-06-17days on market $190,000 Active 12 DOM
-
2026-06-16days on market $190,000 Active 11 DOM
-
2026-06-15days on market $190,000 Active 10 DOM
-
2026-06-14days on market $190,000 Active 8 DOM
-
2026-06-13days on market $190,000 Active 7 DOM
-
2026-06-10days on market $190,000 Active 5 DOM
-
2026-06-09days on market $190,000 Active 4 DOM
-
2026-06-08days on market $190,000 Active 3 DOM
-
2026-06-07remarks 695-char remark
-
2026-06-07$190,000 Active 2 DOM
ⓘ Source: listings_history table (triggers on properties + properties_extension) + one-shot
backfill from property_details.listing_events for pre-trigger history.
Tax reassessment forecast TX · Resets to sale price
- Current annual tax
- $2,136 · $178/mo
- Projected year-2 tax
- $3,477 · $290/mo
- Expected delta
- +$1,341/yr (+$112/mo · 62.8%)
ⓘ Screening estimate from a state-policy table — verify with the county assessor before closing.
Climate risk First Street
- Flood 1/10 Low FEMA zone X (unshaded) · 0% chance over 30 yrs
- Wildfire 5/10 Major
- Heat 7/10 Severe 7 d/yr ≥110°F today · 25 d/yr by 30 yrs out
- Wind 6/10 Major 51% chance of damaging wind over 30 yrs
- Air quality 2/10 Low 1 unhealthy d/yr today · 1 by 30 yrs out
Nearby sold comps map
Loading sold comps map…
Walkable amenities ~0.75 mi
Loading nearby amenities…
Taxation est. · year 1
- Rental income
- $20,036
- − Mortgage interest
- −$10,643
- − Property taxes
- −$2,136
- − Insurance
- −$950
- − Repairs & maintenance
- −$1,603
- − Management
- −$1,603
- − Depreciation
- −$5,527
- Taxable loss
- −$2,426
- Est. tax savings @ 24.0%
- +$582
- After-tax cash flow
- $1,368/yr
For passive investors: Depreciation is non-cash, so a rental often shows a tax loss while cash-flowing — sheltering income. Rental losses are passive: they offset passive income freely, and up to $25,000/yr can offset ordinary (W-2) income if you actively participate and your MAGI is under $100k (phasing out to $0 by $150k); unused losses carry forward. On sale, claimed depreciation is recaptured at up to 25%, and gains may owe capital-gains tax (a 1031 exchange can defer both). Figures are a year-1 estimate at your 24.0% rate — not tax advice; consult a CPA.
Schools (NCES district)
- District
- Hawkins ISD
- NCES district ID
- 4822770
- Math proficiency
- 42% ▼ -12.00%
- Reading proficiency
- 43% ▼ -6.00%
- Median HH income
- $43,119
- Composite
- 35.91/100
- National rank
- #4809
- State rank
- #339 of 826 in TX
Livability — Holly Lake Ranch
- Score
- 66/100
- State rank
- #597
- US rank
- #11377
Category grades
Schools grade is shown separately in the Schools card above.
Census & demographics
- Census place
- Holly Lake Ranch, TX
- Population (ZIP)
- 8,195
Population outlook (Wood County) Hauer SSP2
- Today (2025)
- 46,480 people
- By 2030
- 47,796 · +2.8%
- By 2040
- 50,142 · +7.9%
- By 2050
- 52,122 · +12.1%
- By 2075
- 57,033 · +22.7%
- By 2100
- 56,418 · +21.4%
Race, ethnicity, and origin ACS 2023
- Neighborhood character
- Predominantly White (79%)
- Race & ethnicity
- White 79% Black 12% Hispanic / Latino 6% Two or more races 5%
- Hispanic origin (detail)
- Mexican 5%
- Common ancestry
- Lithuanian 2% Slovak 2% Serbian 1%
- Foreign-born
- 1% · Canada
- Languages at home
- 95% English-only · Spanish 4%
Political lean MEDSL · Wood
- 2024 margin
- Solid R (+69.7) · D 14.8% · R 84.6%
- 2008→2024 swing
- -15.5pp toward R · 2008: -54.2pp · 2024: -69.7pp
- All cycles
- 2024: R+69.7 2020: R+68.2 2016: R+70.0 2012: R+64.2 2008: R+54.2
Not yet ingested
- Civics
- —
Market trends
- HPI YoY
- ▲ 3.10%
- Current HPI
- 236.7688
- Rent YoY
- —
- Metro
- —
- State GDP YoY
- ▲ 3.95%
- F500 in state
- 110
Industry mix (Fortune 500 HQ in TX)
| Industry | F500 HQs | Revenue |
|---|---|---|
| Energy | 16 | $1,198B |
|
||
| Technology | 5 | $198B |
|
||
| Engineering / Construction | 4 | $72B |
|
||
| Energy Services | 3 | $60B |
|
||
| Utilities | 3 | $41B |
|
||
| Healthcare | 2 | $330B |
|
||
Price history
3 events — show timeline
- 2026-06-06 Listed $190,000 FSBO.com
- 2008-11-20 Sold (Public Records) — Public Records
- 2002-12-27 Sold (Public Records) — Public Records
Property tax history
+4.3%/yrLatest (2025): $2,136 · +10.0% YoY. Source: county tax records.
Cash-flow waterfall
monthlySold comps — $/sqft
last 12 mo · ≤1 miLoading sold comps…