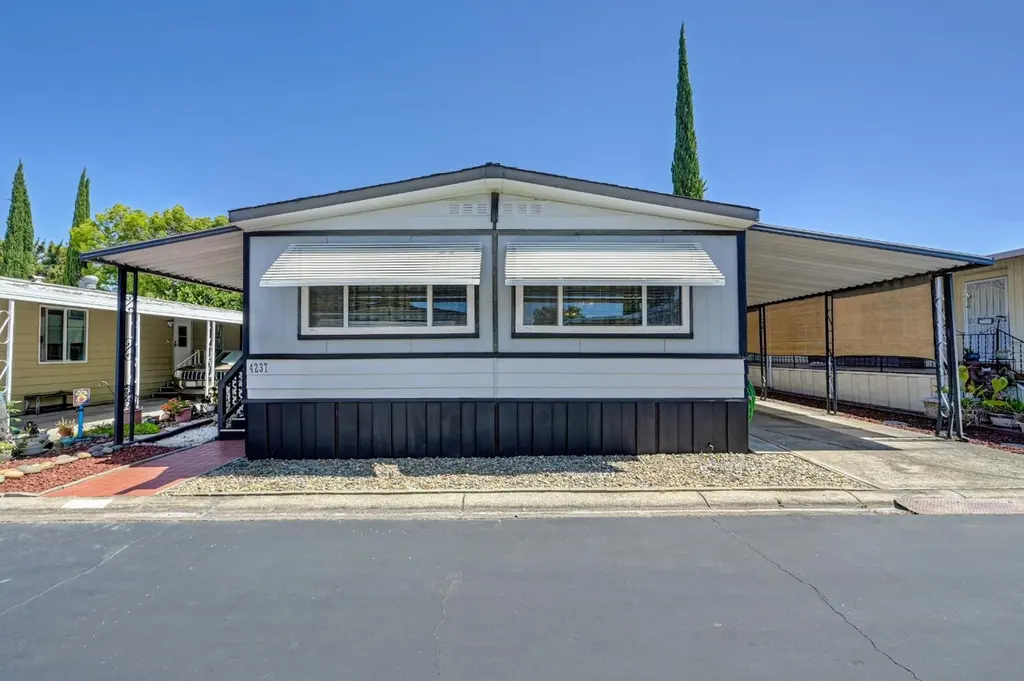
4237 Pinewood St · Rocklin, CA
Flood risk 6/10 · Moderate
- FEMA flood zone
- X (unshaded)
- Chance of flooding over 30 yrs
- 0.68%
- Est. flood insurance / yr
- $507 – $1,088
Fire risk 8/10 · Major
- Est. fire insurance / yr
- $659 – $1,223
Heat risk 7/10 · Major
- Hot days now (above 104°F)
- 7 days/yr
- Hot days in 30 yrs
- 16 days/yr
Wind risk 1/10 · Minimal
- Chance of severe wind over 30 yrs
- —
Air-quality risk 10/10 · Severe
- Unhealthy air days now
- 32 days/yr
- Unhealthy air days in 30 yrs
- 38 days/yr
Risk factors via First Street. Map © Google.
Why this score? — see what drove the B+ grade
The composite is a weighted blend of 9 inputs, each scored 0–100. Each bar is that input's sub-score; the figure is the points it added to the 100-point composite (weight × sub-score).
- Cash flow +30.0/30.0
- ARV discount +15.0/15.0
- 1% rule +10.0/10.0
- DSCR +10.0/10.0
- Schools +5.0/10.0
- Livability +3.7/5.0
- Rent growth +2.5/5.0
- Condition / age +2.5/5.0
- Appreciation +0.0/10.0
$122,500
🖨 Deal sheet (PDF) 📄 Offer letter ✓ Due diligence
Listing remarks
Price reduction. Discover a truly inviting home at 4237 Pinewood St, Rocklin, CA, an exceptional mobile home ready for immediate occupancy. Park approval is required to purchase this home. This residence offers a unique blend of comfort and convenience, designed for a relaxed and aspirational lifestyle. The heart of this home is its open-plan kitchen, seamlessly flowing into the living room. It features high-end stainless steel appliances, including a dishwasher, oven, range with hood, microwave and a premium refrigerator, all set against a functional peninsula, perfect for both culinary adventures and casual gatherings. The bathroom provides extensive storage solutions and a refreshing wal
Key facts
- Open-plan kitchen
- Covered deck
- Attached carport
Tags
Property features AI
Finance
- Other: Located in Rocklin, CA 95650; directions: I-80 to Rocklin Road, enter at Creekside and left on Pinewood Street
- Financial info: Land lease amount listed as $1,100
- HOA & community: No association; Not a senior community; Land lease: No
Exterior
- Parking: 2 parking spaces; Off-street parking; Covered parking
- Utilities: Natural gas connected; Public water; Public sewer; 220V outlet in laundry
- Home design: Manufactured in park (double wide); Sherwood manufactured home; Updated/remodeled; Built in 1977; Composition roof; Aluminum skirting
- Construction: Manufactured construction (double wide); Composition roof; Aluminum skirting
- Exterior features: Carport awning; Shed(s)
Interior
- Kitchen: Built-in electric oven; Built-in electric range; Hood over range; Microwave; Dishwasher; Disposal; Ice maker; Pantry cabinet; Breakfast nook; Kitchen with dining/family combo and dining bar
- Bedrooms: 2 bedrooms
- Flooring: Carpet; Laminate
- Bathrooms: 2 full bathrooms; Tub with shower over
- Heating & cooling: Central heating; Central cooling; Gas water heater
- Interior features: Great room; Enclosed deck and enclosed patio; Dual-pane windows with screens; Updated/remodeled condition; Pets allowed
- Laundry & utility: Washer and dryer included; Laundry located inside (inside room/area)
Neighborhood map
What this means for you Summary
Snapshot
- This is a 2-bed/2.0-bath manufactured listed at $122k.
Deal economics
- At list price, monthly cash flow is $1k ($17k/yr) — positive.
- The deal already cash-flows at list — no discount required.
- Meets the 1% rule at list price ($3k rent vs $122k).
- Recommended offer: $119k (3.0% below list) — sets the bar for market timing.
- Cap rate 20.0% vs local median 2.7% in Rocklin — top-decile yield for the area; either an underpriced asset or a hidden risk that comps aren't pricing in. Stress-test before assuming the spread holds.
Location & tenants
- Location reads 74/100 on livability (#136 in CA, #4,755 nationally) — a middle-class / working-renter tenant base. Strengths: schools A+, employment A+, housing A+; Watch: commute D+, amenities F, cost of living F.
- Rocklin Unified (suburban): math 44% / reading 65% proficiency, ranked #96 of 517 in CA (top 19%) — acceptable for families but not a draw, mixed tenant base, ~2y average lease; only 14% free/reduced lunch — higher-income household profile.
- Market conditions: 87 active listings in the ZIP; 6 comparable units currently listed for rent nearby; rentals at typical pace (median 23d on market — plan ~3-4 weeks tenant-placement turnaround); high-income renter base; 3,535 units permitted in Placer County in 2024 (689 in 5+ unit buildings).
Forward outlook
- Local home prices are declining (-3.0%/yr); year-one equity from $847 of loan paydown is wiped out by about $4k of value loss. Plan a longer hold.
- Placer County population projected at +20% by 2050 — long-run rental-demand tailwind backs the buy-and-hold thesis.
- At projected returns (-3.0% appreciation + 3.0% rent growth), your $34k cash investment doubles in ~3 years — after that, you're playing with house money.
Negotiation context
- It's been on market 32 days — a 3% lower offer ($119k) is reasonable based on typical stale-listing flexibility.
Risks & watch-outs
- Climate carrying-cost: major flood risk; severe wildfire risk; extreme-heat days projected 7→16/yr by 2055 (HVAC capex compounding) — expect insurance premiums to compound above CPI over the hold.
Questions for the listing agent
- It's been on market 32 days. Have you received any prior offers? Is the seller open to a 3% concession, seller financing, or rate buy-down credit?
- Built in 1977 — when were the roof, HVAC, electrical panel, plumbing, and water heater last replaced?
- Is there a deadline driving the sale (1031 exchange, divorce, estate, relocation)? That informs how much negotiation room exists.
- Schools are A-rated — typically a magnet for longer-tenancy family renters. What's the average tenant stay here, and is there a school-zone premium baked into asking?
- What's the average days-on-market for RENTAL listings here right now (not sales)? A rising rental-DOM trend means longer vacancies and softer asking-rent achievability than the comps imply.
- What's the recent tenant-quality profile in this submarket — average credit score on applications, eviction rate, late-payment / NSF rate, and stable-employment percentage? A property-management company in the area should have these aggregated.
- How much new for-sale + rental construction is in the pipeline within 1–3 miles? Heavy new supply typically softens prices + rents 12–24 months out; constrained supply supports both.
Investment metrics
- 1% rule
- 2.32% ✓
- Cap rate
- 19.95%
- Cash-on-cash
- 48.78%
- DSCR
- 3.17
- GRM
- 3.6
CMA / ARV
- ARV (on-the-fly)
- $150,528
- Comps found
- 12
Show comp detail 12 sales within ~0.75 mi
| Address | Dist | Beds/Ba | Sqft | Sold | Price | $/sf | Match |
|---|---|---|---|---|---|---|---|
| 4271 Fernwood St | 0.06mi | 2/2.0 | 1,440 (-6%) | 1mo | $149,500 | $104 | 86 |
| 4261 Fernwood St #33 | 0.10mi | 2/2.0 | 1,440 (-6%) | 8mo | $150,000 | $104 | 79 |
| 4280 Cedarwood St #67 | 0.06mi | 2/2.0 | 1,440 (-6%) | 11mo | $139,900 | $97 | 78 |
| 5265 Oakwood Ct | 0.12mi | 2/2.0 | 1,440 (-6%) | 8mo | $119,800 | $83 | 77 |
| 4137 Oakmont St | 0.24mi | 2/2.0 | 1,440 (-6%) | 6mo | $124,000 | $86 | 74 |
| 4319 Oakwood St | 0.02mi | 2/2.0 | 1,368 (-11%) | 10mo | $151,000 | $110 | 73 |
| 4173 Lakeside Dr | 0.19mi | 2/2.0 | 1,440 (-6%) | 11mo | $125,000 | $87 | 71 |
| 4189 Oakridge St | 0.21mi | 2/2.0 | 1,444 (-6%) | 14mo | $100,000 | $69 | 69 |
| 5505 S Grove St #202 | 0.36mi | 3/2.0 (+1) | 1,440 (-6%) | 11mo | $218,000 | $151 | 59 |
| 5505 S Grove St #51 | 0.29mi | 3/2.0 (+1) | 1,380 (-10%) | 10mo | $135,000 | $98 | 56 |
| 5505 S Grove St #45 | 0.29mi | 3/2.0 (+1) | 1,756 (+14%) | 5mo | $199,900 | $114 | 54 |
| 5505 S Grove St #88 | 0.36mi | 2/2.0 | 1,314 (-14%) | 13mo | $90,000 | $68 | 48 |
Match score weights: distance 35% · size 25% · config 20% · recency 20%. Top-matched comps best support the ARV.
Projected returns pro-forma
-3.0% appreciation · 3.0% rent growth · sell at horizon
- IRR
- 46.4%
- Equity multiple
- 3.01×
- Total profit
- $69,002
- Equity at exit
- $18,265
- IRR
- 52.1%
- Equity multiple
- 6.09×
- Total profit
- $174,616
- Equity at exit
- $10,592
Cash invested: $34,300 (down + closing). Projections, not guarantees.
Landlord ↔ Tenant lean methodology
- Overall (STATE)
- 18 Strongly Tenant-Friendly
- State California
- 18 Strongly Tenant-Friendly · D+13
- County
- — inherits STATE
- City
- — inherits STATE
ZIP-level market 95650
- Active inventory
- 87
- Price-to-rent
- 3.6×
Monthly cashflow live
- Estimated rent
- $2,837 high interval (Pro) →
- Mortgage (P&I)
- −$642
- Tax est. 1.5%
- −$153 /mo · $1,838/yr
- Insurance
- −$51
- HOA
- −$0
- Vacancy / Maint / Mgmt
- −$596
- Net cashflow
- $1,394
Break-even live
Sensitivity live
| Price | -10% $1,479 | -5% $1,437 | +0% $1,394 | +5% $1,352 | +10% $1,310 |
|---|---|---|---|---|---|
| Rent | -10% $1,170 | -5% $1,282 | +0% $1,394 | +5% $1,506 | +10% $1,618 |
| Rate | -1.0pp $1,456 | -0.5pp $1,426 | base $1,394 | +0.5pp $1,363 | +1.0pp $1,330 |
UW: 25.0% down · 7.5% · 30yr · 1.5% tax · 5.0% vac · 8.0% maint · 8.0% mgmt
Financing live
Cash to close
- Down payment
- $30,625
- Closing costs
- $3,675
- Reserves months
- —
- Total cash needed
- —
Loan-product check · same deal, 3 products live
Conventional
25% down · 7.5% · 30yr
- Down + closing
- —
- Monthly P&I
- —
- Monthly cashflow
- —
- DSCR
- —
- Eligible?
- —
Personal DTI + credit; lowest rate.
DSCR
20% down · 8.5% · 30yr
- Down + closing
- —
- Monthly P&I
- —
- Monthly cashflow
- —
- DSCR
- —
- Eligible?
- —
No personal income docs; deal must DSCR.
Hard money
10% down · 12.0% · 12mo
- Down + closing
- —
- Monthly P&I
- —
- Monthly cashflow
- —
- DSCR
- —
- Eligible?
- —
Short-term bridge; refi at stabilization.
Rent comps 6 comps
| Address | Beds | Baths | Sqft | Rent | $/sqft | DOM | Units | Dist |
|---|---|---|---|---|---|---|---|---|
| 5229 Levison Way Rocklin, CA | 3.0 | 2.5 | 2068 | $2,895 | $1.40 | 44d | 1 | 0.20mi |
| 4769 Racetrack Cir Rocklin, CA | 3.0 | 2.0 | 1148 | $2,950 | $2.57 | 44d | 1 | 0.45mi |
| 4710 El Cid Ct Rocklin, CA | 3.0 | 2.0 | 1546 | $2,575 | $1.67 | 22d | 1 | 0.69mi |
| 5051 El Don Dr Rocklin, CA | 2.0 | 2.0 | 1125 | $2,270 | $2.02 | 2d | 7 | 1.10mi |
| 5180 Rocklin Rd Rocklin, CA | 1.0–2.0 | 1.0–2.0 | 857 | $2,552 | $2.98 | 2d | 9 | 1.20mi |
| 5002 Jewel St Rocklin, CA | 1.0–3.0 | 1.0–2.0 | 1082 | $2,658 | $2.45 | 2d | 13 | 1.47mi |
Listing history 14 events
-
2026-06-18days on market $122,500 Active 32 DOM
-
2026-06-17days on market $122,500 Active 31 DOM
-
2026-06-16days on market $122,500 Active 30 DOM
-
2026-06-15days on market $122,500 Active 29 DOM
-
2026-06-13days on market $122,500 Active 27 DOM
-
2026-06-13pricedays on market $122,500 Active 26 DOM
-
2026-06-09days on market $127,500 Active 23 DOM
-
2026-06-08days on market $127,500 Active 22 DOM
-
2026-06-07days on market $127,500 Active 21 DOM
-
2026-06-05days on market $127,500 Active 18 DOM
-
2026-06-03days on market $127,500 Active 17 DOM
-
2026-06-02days on market $127,500 Active 16 DOM
-
2026-06-01days on market $127,500 Active 15 DOM
-
2026-05-31days on market $127,500 Active 14 DOM
ⓘ Source: listings_history table (triggers on properties + properties_extension) + one-shot
backfill from property_details.listing_events for pre-trigger history.
Climate risk First Street
- Flood 6/10 Major FEMA zone X (unshaded) · 68% chance over 30 yrs
- Wildfire 8/10 Severe
- Heat 7/10 Severe 7 d/yr ≥104°F today · 16 d/yr by 30 yrs out
- Wind 1/10 Low
- Air quality 10/10 Extreme 32 unhealthy d/yr today · 38 by 30 yrs out
Nearby sold comps map
Loading sold comps map…
Walkable amenities ~0.75 mi
Loading nearby amenities…
Taxation est. · year 1
- Rental income
- $34,040
- − Mortgage interest
- −$6,862
- − Property taxes
- −$1,838
- − Insurance
- −$612
- − Repairs & maintenance
- −$2,723
- − Management
- −$2,723
- − Depreciation
- −$3,564
- Taxable income
- $15,718
- Est. tax owed @ 24.0%
- −$3,772
- After-tax cash flow
- $12,960/yr
For passive investors: Depreciation is non-cash, so a rental often shows a tax loss while cash-flowing — sheltering income. Rental losses are passive: they offset passive income freely, and up to $25,000/yr can offset ordinary (W-2) income if you actively participate and your MAGI is under $100k (phasing out to $0 by $150k); unused losses carry forward. On sale, claimed depreciation is recaptured at up to 25%, and gains may owe capital-gains tax (a 1031 exchange can defer both). Figures are a year-1 estimate at your 24.0% rate — not tax advice; consult a CPA.
Schools (NCES district)
- District
- Rocklin Unified
- NCES district ID
- 0600013
- Math proficiency
- 44% ▼ -19.00%
- Reading proficiency
- 65% ▼ -6.00%
- Median HH income
- $82,858
- Composite
- 49.58/100
- National rank
- #1984
- State rank
- #96 of 517 in CA
Livability — Rocklin
- Score
- 74/100
- State rank
- #136
- US rank
- #4755
Category grades
Schools grade is shown separately in the Schools card above.
Census & demographics
- Census place
- Rocklin, CA
- County
- Placer County · 390,510 people
- City population
- 73,077
- Metro
- Sacramento-Roseville-Folsom, CA
- Population (ZIP)
- 13,405
- Household income
- $117,912
- Rent vs Own
- Severe rent burden
- 175.0
Population outlook (Placer County) Hauer SSP2
- Today (2025)
- 422,709 people
- By 2030
- 444,249 · +5.1%
- By 2040
- 480,192 · +13.6%
- By 2050
- 506,390 · +19.8%
- By 2075
- 550,219 · +30.2%
- By 2100
- 547,760 · +29.6%
Race, ethnicity, and origin ACS 2023
- Neighborhood character
- Predominantly White (82%)
- Race & ethnicity
- White 82% Two or more races 10% Hispanic / Latino 8% Asian 3%
- Hispanic origin (detail)
- Mexican 6%
- Common ancestry
- Lithuanian 6% Italian 3% Slovak 3%
- Foreign-born
- 5% · Canada, South Korea
- Languages at home
- 94% English-only · Spanish 3% Russian/Polish/Slavic 2%
Political lean MEDSL · Placer
- 2024 margin
- Lean R (+8.5) · D 44.3% · R 52.8% · Other 2.9%
- 2008→2024 swing
- +2.8pp toward D · 2008: -11.3pp · 2024: -8.5pp
- All cycles
- 2024: R+8.5 2020: R+6.7 2016: R+11.3 2012: R+20.1 2008: R+11.3
Not yet ingested
- Civics
- —
Market trends
- HPI YoY
- ▼ -437.22%
- Current HPI
- 318.2743
- Rent YoY
- —
- Metro
- Sacramento-Roseville-Folsom, CA
- State GDP YoY
- ▲ 3.21%
- F500 in state
- 116
Industry mix (Fortune 500 HQ in CA)
| Industry | F500 HQs | Revenue |
|---|---|---|
| Technology | 27 | $1,492B |
|
||
| Financial Services | 3 | $174B |
|
||
| Retail | 3 | $44B |
|
||
| Insurance | 3 | $26B |
|
||
| Media / Entertainment | 2 | $115B |
|
||
| Pharmaceuticals / Biotech | 2 | $62B |
|
||
Cash-flow waterfall
monthlySold comps — $/sqft
last 12 mo · ≤1 miLoading sold comps…