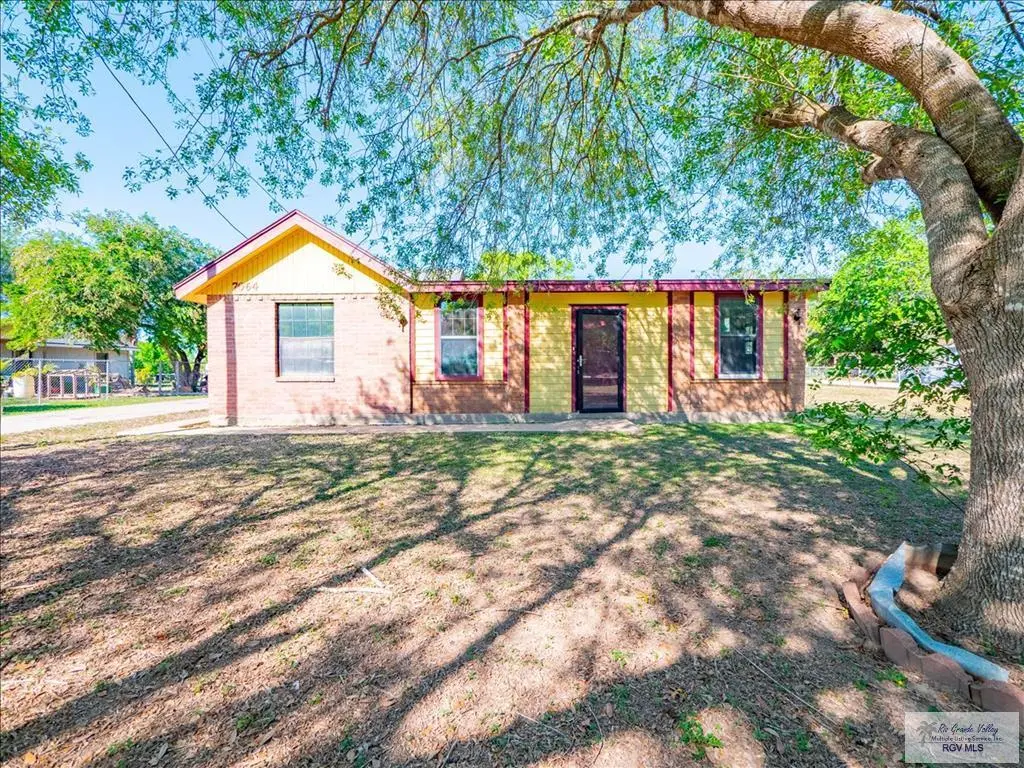
7064 Old Military Rd · Brownsville, TX
Flood risk 1/10 · Minimal
- FEMA flood zone
- X (unshaded)
- Chance of flooding over 30 yrs
- 0.0%
- Est. flood insurance / yr
- $507 – $1,088
Fire risk 3/10 · Minor
- Est. fire insurance / yr
- $1,222 – $2,270
Heat risk 9/10 · Severe
- Hot days now (above 110°F)
- 7 days/yr
- Hot days in 30 yrs
- 25 days/yr
Wind risk 9/10 · Severe
- Chance of severe wind over 30 yrs
- 99.0%
Air-quality risk 1/10 · Minimal
- Unhealthy air days now
- 0 days/yr
- Unhealthy air days in 30 yrs
- 0 days/yr
Risk factors via First Street. Map © Google.
Why this score? — see what drove the B grade
The composite is a weighted blend of 9 inputs, each scored 0–100. Each bar is that input's sub-score; the figure is the points it added to the 100-point composite (weight × sub-score).
- Cash flow +26.5/30.0
- ARV discount +15.0/15.0
- DSCR +9.1/10.0
- 1% rule +6.5/10.0
- Rent growth +5.0/5.0
- Livability +4.0/5.0
- Condition / age +2.5/5.0
- Schools +2.2/10.0
- Appreciation +0.0/10.0
$189,000
🖨 Deal sheet (PDF) 📄 Offer letter ✓ Due diligence
Listing remarks
This 3 bedroom/1 bath brick home offers 1,558 sq ft on a 0.98 acre lot with functional living spaces and recent updates throughout. The kitchen features wooden cabinetry, tile countertops, and tile flooring, while the living area showcases exposed brick walls and durable tile floors. Bedrooms include custom built-in cabinets and carpet flooring. The bathroom is finished with tile countertops, tile flooring, a shower enclosure, and an under-sink cabinet. A dedicated laundry area adds everyday convenience. Outside, the property includes a 2 car garage, a wooden storage shed, and a covered patio/pavilion-style structure overlooking the wide backyard with plenty of usable outdoor space. Recent
Key facts
- Exposed brick walls
- Tile countertops
- Wooden cabinetry
Tags
Property features AI
Exterior
- Parking: 2-car garage
- Utilities: Public water; Public sewer
- Home design: Single family residence; One-story house; Residential property; House
- Construction: Brick veneer construction; Slab foundation
- Exterior features: Metal roof; Lot close to 1 acre
Interior
- Flooring: Carpet; Tile
- Bathrooms: 1 full bathroom
- Heating & cooling: Central heating; Central air conditioning
- Interior features: Carpet and tile flooring
Neighborhood map
What this means for you Summary
Snapshot
- This is a 3-bed/2.0-bath single-family listed at $189k.
Deal economics
- At list price, monthly cash flow is $501 ($6k/yr) — positive.
- The deal already cash-flows at list — no discount required.
- Meets the 1% rule at list price ($2k rent vs $189k).
- Recommended offer: $183k (3.0% below list) — sets the bar for market timing.
- Cap rate 9.5% vs local median 5.0% in Brownsville — top-decile yield for the area; either an underpriced asset or a hidden risk that comps aren't pricing in. Stress-test before assuming the spread holds.
Location & tenants
- Location reads 79/100 on livability (#62 in TX, #2,311 nationally) — a middle-class / working-renter tenant base. Strengths: commute A+, cost of living A+, housing A+; Watch: amenities D, crime D-, employment F.
- Brownsville ISD (urban): math 20% / reading 34% proficiency, ranked #710 of 826 in TX (top 86%) — low school quality limits family demand, transient renter base, plan for 1-2y turnover; 83% free/reduced lunch — lower-income household profile, screen leases tightly.
- Zoned schools: Villa Nueva El (math 17% / reading 27%, grade F, #3,333 of 4,322 statewide, top 80%, 361 students, 94% FRL); Stillman Middle (math 26% / reading 43%, grade F, #858 of 1,662 statewide, top 54%, 1,095 students, 68% FRL); Veterans Memorial Early College H S (math 33% / reading 69%, grade D+, #482 of 1,632 statewide, top 30%, 2,172 students, 65% FRL).
- Market conditions: Rents rising fast (+11.4%/yr); 346 active listings in the ZIP; 4 comparable units currently listed for rent nearby; rentals lingering (median 45d on market — plan ~5-8 weeks vacancy on turnover, expect pricing pressure); 50% of comp listings sitting > 30 days — soft ceiling on asking rent; 2,326 units permitted in Cameron County in 2024 (503 in 5+ unit buildings).
- At $2,175/mo this rent would consume 52% of the median local household income ($50k/yr) (locally 1800% of renters already pay >50% of income on rent) — very limited rent-growth headroom before tenants either downsize or default.
Forward outlook
- Local home prices are declining (-3.0%/yr); year-one equity from $1k of loan paydown is wiped out by about $6k of value loss. Plan a longer hold.
- Cameron County population projected at +3% by 2050 — modest demand growth; plan on rents tracking national, not racing it.
- At projected returns (-3.0% appreciation + 8.0% rent growth), your $53k cash investment doubles in ~7 years — after that, you're playing with house money.
Negotiation context
- It's been on market 35 days — a 3% lower offer ($183k) is reasonable based on typical stale-listing flexibility.
- 2 sale attempts since 4y ago; this cycle's ask has dropped $20k (10%) from the opening price — seller is motivated, your offer sets the floor, not the list.
Risks & watch-outs
- Climate carrying-cost: severe wind risk, 99% chance of damaging wind over 30y; extreme-heat days projected 7→25/yr by 2055 (HVAC capex compounding) — expect insurance premiums to compound above CPI over the hold.
Questions for the listing agent
- It's been on market 35 days. Have you received any prior offers? Is the seller open to a 3% concession, seller financing, or rate buy-down credit?
- Built in 1962 — when were the roof, HVAC, electrical panel, plumbing, and water heater last replaced?
- Is there a deadline driving the sale (1031 exchange, divorce, estate, relocation)? That informs how much negotiation room exists.
- Crime grade is D in this area — have there been break-ins, vandalism, or insurance claims at this property in the last 3 years? What carrier currently insures it and at what premium?
- What's the average days-on-market for RENTAL listings here right now (not sales)? A rising rental-DOM trend means longer vacancies and softer asking-rent achievability than the comps imply.
- What's the recent tenant-quality profile in this submarket — average credit score on applications, eviction rate, late-payment / NSF rate, and stable-employment percentage? A property-management company in the area should have these aggregated.
- How much new for-sale + rental construction is in the pipeline within 1–3 miles? Heavy new supply typically softens prices + rents 12–24 months out; constrained supply supports both.
Investment metrics
- 1% rule
- 1.15% ✓
- Cap rate
- 9.47%
- Cash-on-cash
- 11.36%
- DSCR
- 1.51
- GRM
- 7.2
CMA / ARV
- ARV (median comp)
- $278,921
- List price
- $189,000
- Delta
- -32.24%
- Verdict
- UNDERPRICED
- Comps
- 5 within 2.0 mi
Projected returns pro-forma
-3.0% appreciation · 8.0% rent growth · sell at horizon
- IRR
- 5.9%
- Equity multiple
- 1.24×
- Total profit
- $12,750
- Equity at exit
- $28,181
- IRR
- 19.2%
- Equity multiple
- 2.97×
- Total profit
- $104,402
- Equity at exit
- $16,341
Cash invested: $52,920 (down + closing). Projections, not guarantees.
Landlord ↔ Tenant lean methodology
- Overall (STATE)
- 87 Strongly Landlord-Friendly
- State Texas
- 87 Strongly Landlord-Friendly · R+5
- County
- — inherits STATE
- City
- — inherits STATE
ZIP-level market 78520
- Home prices YoY
- -19.8%
- Rents YoY
- 11.4%
- Active inventory
- 346
- Price-to-rent
- 7.2×
Monthly cashflow live
- Estimated rent
- $2,175 medium interval (Pro) →
- Mortgage (P&I)
- −$991
- Tax from tax record
- −$147 /mo · $1,765/yr
- Insurance
- −$79
- HOA
- −$0
- Vacancy / Maint / Mgmt
- −$457
- Net cashflow
- $501
Break-even live
Sensitivity live
| Price | -10% $608 | -5% $554 | +0% $501 | +5% $447 | +10% $394 |
|---|---|---|---|---|---|
| Rent | -10% $329 | -5% $415 | +0% $501 | +5% $587 | +10% $673 |
| Rate | -1.0pp $596 | -0.5pp $549 | base $501 | +0.5pp $452 | +1.0pp $402 |
UW: 25.0% down · 7.5% · 30yr · 1.5% tax · 5.0% vac · 8.0% maint · 8.0% mgmt
Financing live
Cash to close
- Down payment
- $47,250
- Closing costs
- $5,670
- Reserves months
- —
- Total cash needed
- —
Loan-product check · same deal, 3 products live
Conventional
25% down · 7.5% · 30yr
- Down + closing
- —
- Monthly P&I
- —
- Monthly cashflow
- —
- DSCR
- —
- Eligible?
- —
Personal DTI + credit; lowest rate.
DSCR
20% down · 8.5% · 30yr
- Down + closing
- —
- Monthly P&I
- —
- Monthly cashflow
- —
- DSCR
- —
- Eligible?
- —
No personal income docs; deal must DSCR.
Hard money
10% down · 12.0% · 12mo
- Down + closing
- —
- Monthly P&I
- —
- Monthly cashflow
- —
- DSCR
- —
- Eligible?
- —
Short-term bridge; refi at stabilization.
Rent comps 4 comps
| Address | Beds | Baths | Sqft | Rent | $/sqft | DOM | Units | Dist |
|---|---|---|---|---|---|---|---|---|
| 5105 River Dr #5105 , TX | 3.0 | 2.5 | 1755 | $2,300 | $1.31 | 45d | 1 | 1.09mi |
| 4671 River Oak Cir Brownsville, TX | 3.0 | 2.5 | 1790 | $2,300 | $1.28 | 15d | 1 | 1.09mi |
| 4704 River Oak Cir Brownsville, TX | 3.0 | 2.5 | 1785 | $2,300 | $1.29 | 45d | 1 | 1.18mi |
| 33 Shenandoah River Dr Brownsville, TX | 2.0 | 2.0 | 1579 | $2,000 | $1.27 | 15d | 1 | 1.50mi |
Listing history 19 events
-
2026-06-18price $189,000 Active 35 DOM
-
2026-06-18days on market $199,500 Active 35 DOM
-
2026-06-17days on market $199,500 Active 34 DOM
-
2026-06-16days on market $199,500 Active 33 DOM
-
2026-06-15days on market $199,500 Active 32 DOM
-
2026-06-14days on market $199,500 Active 30 DOM
-
2026-06-13days on market $199,500 Active 29 DOM
-
2026-06-10days on market $199,500 Active 27 DOM
-
2026-06-09days on market $199,500 Active 26 DOM
-
2026-06-08days on market $199,500 Active 25 DOM
-
2026-06-07days on market $199,500 Active 24 DOM
-
2026-06-05pricedays on market $199,500 Active 21 DOM
-
2026-06-03days on market $205,500 Active 20 DOM
-
2026-06-02days on market $205,500 Active 19 DOM
-
2026-06-01days on market $205,500 Active 18 DOM
-
2026-05-31days on market $205,500 Active 17 DOM
-
2026-05-30days on market $205,500 Active 16 DOM
-
2026-05-14$209,000 Active 942-char remark
-
2022-03-06$179,000 Active
ⓘ Source: listings_history table (triggers on properties + properties_extension) + one-shot
backfill from property_details.listing_events for pre-trigger history.
Tax reassessment forecast TX · Resets to sale price
- Current annual tax
- $1,765 · $147/mo
- Projected year-2 tax
- $3,459 · $288/mo
- Expected delta
- +$1,694/yr (+$141/mo · 96.0%)
ⓘ Screening estimate from a state-policy table — verify with the county assessor before closing.
Climate risk First Street
- Flood 1/10 Low FEMA zone X (unshaded) · 0% chance over 30 yrs
- Wildfire 3/10 Moderate
- Heat 9/10 Extreme 7 d/yr ≥110°F today · 25 d/yr by 30 yrs out
- Wind 9/10 Extreme 99% chance of damaging wind over 30 yrs
- Air quality 1/10 Low 0 unhealthy d/yr today · 0 by 30 yrs out
Nearby sold comps map
Loading sold comps map…
Walkable amenities ~0.75 mi
Loading nearby amenities…
Taxation est. · year 1
- Rental income
- $26,095
- − Mortgage interest
- −$10,587
- − Property taxes
- −$1,765
- − Insurance
- −$945
- − Repairs & maintenance
- −$2,088
- − Management
- −$2,088
- − Depreciation
- −$5,498
- Taxable income
- $3,125
- Est. tax owed @ 24.0%
- −$750
- After-tax cash flow
- $5,262/yr
For passive investors: Depreciation is non-cash, so a rental often shows a tax loss while cash-flowing — sheltering income. Rental losses are passive: they offset passive income freely, and up to $25,000/yr can offset ordinary (W-2) income if you actively participate and your MAGI is under $100k (phasing out to $0 by $150k); unused losses carry forward. On sale, claimed depreciation is recaptured at up to 25%, and gains may owe capital-gains tax (a 1031 exchange can defer both). Figures are a year-1 estimate at your 24.0% rate — not tax advice; consult a CPA.
Schools (NCES district)
- District
- Brownsville ISD
- NCES district ID
- 4811680
- Math proficiency
- 20% ▼ -36.00%
- Reading proficiency
- 34% ▼ -13.00%
- Median HH income
- $30,490
- Composite
- 21.8/100
- National rank
- #8249
- State rank
- #710 of 826 in TX
Livability — Brownsville
- Score
- 79/100
- State rank
- #62
- US rank
- #2311
Category grades
Schools grade is shown separately in the Schools card above.
Census & demographics
- Census place
- Brownsville, TX
- County
- Cameron County · 310,734 people
- City population
- 212,132
- Metro
- Brownsville-Harlingen, TX
- Population (ZIP)
- 64,740
- Household income
- $50,116
- Rent vs Own
- Severe rent burden
- 1800.0
Population outlook (Cameron County) Hauer SSP2
- Today (2025)
- 441,603 people
- By 2030
- 448,113 · +1.5%
- By 2040
- 456,385 · +3.3%
- By 2050
- 456,294 · +3.3%
- By 2075
- 423,851 · -4.0%
- By 2100
- 342,787 · -22.4%
Race, ethnicity, and origin ACS 2023
- Neighborhood character
- Predominantly Hispanic (93%)
- Race & ethnicity
- Hispanic / Latino 93% Two or more races 44% White 6%
- Hispanic origin (detail)
- Mexican 88%
- Foreign-born
- 26% · Canada
- Languages at home
- 18% English-only · Spanish 82%
Political lean MEDSL · Cameron
- 2024 margin
- Lean R (+5.8) · D 46.7% · R 52.5%
- 2008→2024 swing
- -34.6pp toward R · 2008: 28.8pp · 2024: -5.8pp
- All cycles
- 2024: R+5.8 2020: D+13.2 2016: D+32.5 2012: D+32.4 2008: D+28.8
Not yet ingested
- Civics
- —
Market trends
- HPI YoY
- ▼ -52.91%
- Current HPI
- 214.4335
- Rent YoY
- ▲ 11.41%
- Metro
- Brownsville-Harlingen, TX
- State GDP YoY
- ▲ 3.95%
- F500 in state
- 110
Industry mix (Fortune 500 HQ in TX)
| Industry | F500 HQs | Revenue |
|---|---|---|
| Energy | 16 | $1,198B |
|
||
| Technology | 5 | $198B |
|
||
| Engineering / Construction | 4 | $72B |
|
||
| Energy Services | 3 | $60B |
|
||
| Utilities | 3 | $41B |
|
||
| Healthcare | 2 | $330B |
|
||
Price history
+11.5% since first listed5 events — show timeline
- 2026-06-04 Price Changed $199,500 RGVMLS
- 2026-05-28 Price Changed $205,500 RGVMLS
- 2026-05-21 Price Changed $207,500 RGVMLS
- 2026-05-14 Listed $209,000 RGVMLS
- 2022-03-06 Listed $179,000 RGVMLS
Property tax history
+4.2%/yrLatest (2025): $1,765 · +5.4% YoY. Source: county tax records.
Cash-flow waterfall
monthlySold comps — $/sqft
last 12 mo · ≤1 miLoading sold comps…