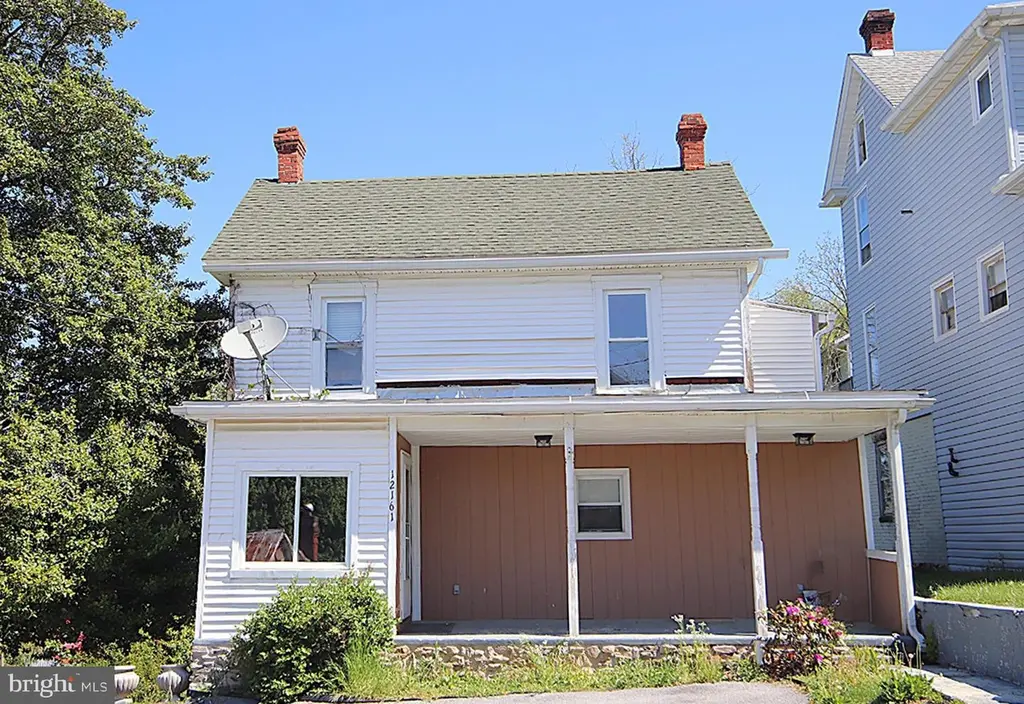
12161 Broad St · Rouzerville, PA
Flood risk 1/10 · Minimal
- FEMA flood zone
- X (unshaded)
- Chance of flooding over 30 yrs
- 0.0%
- Est. flood insurance / yr
- $507 – $1,088
Fire risk 3/10 · Minor
- Est. fire insurance / yr
- $511 – $949
Heat risk 4/10 · Minor
- Hot days now (above 98°F)
- 7 days/yr
- Hot days in 30 yrs
- 16 days/yr
Wind risk 2/10 · Minimal
- Chance of severe wind over 30 yrs
- 3.0%
Air-quality risk 2/10 · Minimal
- Unhealthy air days now
- 1 days/yr
- Unhealthy air days in 30 yrs
- 2 days/yr
Risk factors via First Street. Map © Google.
Why this score? — see what drove the D grade
The composite is a weighted blend of 9 inputs, each scored 0–100. Each bar is that input's sub-score; the figure is the points it added to the 100-point composite (weight × sub-score).
- ARV discount +15.0/15.0
- Cash flow +10.0/30.0
- Schools +3.8/10.0
- Livability +3.4/5.0
- DSCR +2.8/10.0
- Rent growth +2.5/5.0
- Condition / age +2.5/5.0
- 1% rule +1.9/10.0
- Appreciation +0.0/10.0
$174,900
🖨 Deal sheet (PDF) 📄 Offer letter ✓ Due diligence
Listing remarks MLS
Great starter home or investment opportunity - cute home situated just outside of Waynesboro featuring 2 bedrooms, large Kitchen area, bright living room, finished attic space, replacement windows, and lovely fenced in yard. Convenient location close to shopping & restaurants.
Key facts
- 5,227 sq ft lot
- Built 1942
- Listed 28 days
Neighborhood map
What this means for you Summary
Snapshot
- This is a 2-bed/1.0-bath other listed at $175k.
Deal economics
- At list price, monthly cash flow is $-106 ($-1k/yr) — negative.
- To cash-flow at today's rent, offer at most $156k (10.8% below list).
- To meet the 1% rule (rent ≥ 1% of price), the offer needs to be $121k (31.0% below list).
- Recommended offer: $121k (31.0% below list) — sets the bar for 1% rule.
Location & tenants
- Location reads 67/100 on livability (#1,013 in PA) — a middle-class / working-renter tenant base. Strengths: cost of living A+, health & safety A+, housing B; Watch: employment D+, amenities F, commute F.
- Waynesboro Area SD (town): math 36% / reading 52% proficiency, ranked #283 of 539 in PA (top 52%) — families likely to look elsewhere, expect single-tenant / working-renter base with shorter leases.
- Zoned schools: Hooverville El Sch (math 42% / reading 62%, grade C-, #586 of 1,518 statewide, top 42%, 324 students, 55% FRL); Waynesboro Area Ms (math 27% / reading 48%, grade F, #292 of 512 statewide, top 58%, 990 students, 54% FRL); Waynesboro Area Shs (math 69% / reading 24%, grade D-, #173 of 437 statewide, top 40%, 1,439 students, 47% FRL) — zoned schools average 52% FRL vs 36% district-wide (16 pts higher); higher-poverty schools than district average — tighter screening recommended.
- Market conditions: 234 active listings in the ZIP; 1 comparable units currently listed for rent nearby; 633 units permitted in Franklin County in 2024 (112 in 5+ unit buildings).
Forward outlook
- Local home prices are declining (-3.0%/yr); year-one equity from $1k of loan paydown is wiped out by about $5k of value loss. Plan a longer hold.
Negotiation context
- It's been on market 28 days — a 2% lower offer ($172k) is reasonable based on typical stale-listing flexibility.
- 5 sale attempts since 28y ago with the ask held roughly flat each time — persistent listings suggest the price (not the market) is what's stuck; bring a comps-based counter.
- Current owner paid $52k; list at $175k implies a 236% gain — meaningful room to come down on a strong offer.
Risks & watch-outs
- Watch-outs: built in 1942 — expect roof / HVAC / electrical / plumbing capex.
Questions for the listing agent
- What do current leases actually rent for vs. the listed asking? Can we see a recent rent roll and the last 12 months of T-12 income?
- Built in 1942 — when were the roof, HVAC, electrical panel, plumbing, and water heater last replaced?
- Is there a deadline driving the sale (1031 exchange, divorce, estate, relocation)? That informs how much negotiation room exists.
- Schools are F-rated, which usually means shorter tenancies and higher turnover. Who's the typical renter profile here, and what's been the actual vacancy rate?
- The area grade is low — what's the realistic commute time and amenity access for the typical tenant pool here? Any planned neighborhood developments (good or bad) we should know about?
- What's the average days-on-market for RENTAL listings here right now (not sales)? A rising rental-DOM trend means longer vacancies and softer asking-rent achievability than the comps imply.
- What's the recent tenant-quality profile in this submarket — average credit score on applications, eviction rate, late-payment / NSF rate, and stable-employment percentage? A property-management company in the area should have these aggregated.
- How much new for-sale + rental construction is in the pipeline within 1–3 miles? Heavy new supply typically softens prices + rents 12–24 months out; constrained supply supports both.
Investment metrics
- 1% rule
- 0.69% ✗
- Cap rate
- 5.56%
- Cash-on-cash
- -2.61%
- DSCR
- 0.88
- GRM
- 12.1
CMA / ARV
- ARV (median comp)
- $253,592
- List price
- $174,900
- Delta
- -31.03%
- Verdict
- UNDERPRICED
- Comps
- 11 within 1.0 mi
Projected returns pro-forma
-3.0% appreciation · 3.0% rent growth · sell at horizon
- IRR
- -20.7%
- Equity multiple
- 0.28×
- Total profit
- $-35,195
- Equity at exit
- $26,078
- IRR
- -14.1%
- Equity multiple
- 0.19×
- Total profit
- $-39,676
- Equity at exit
- $15,122
Cash invested: $48,972 (down + closing). Projections, not guarantees.
Landlord ↔ Tenant lean methodology
- Overall (STATE)
- 62 Landlord-Friendly
- State Pennsylvania
- 62 Landlord-Friendly · EVEN
- County
- — inherits STATE
- City
- — inherits STATE
ZIP-level market 17268
- Active inventory
- 234
- Price-to-rent
- 12.1×
Monthly cashflow live
- Estimated rent
- $1,207 medium interval (Pro) →
- Mortgage (P&I)
- −$917
- Tax from tax record
- −$70 /mo · $842/yr
- Insurance
- −$73
- HOA
- −$0
- Vacancy / Maint / Mgmt
- −$254
- Net cashflow
- $-106
Break-even live
Sensitivity live
| Price | -10% $-7 | -5% $-57 | +0% $-106 | +5% $-156 | +10% $-205 |
|---|---|---|---|---|---|
| Rent | -10% $-202 | -5% $-154 | +0% $-106 | +5% $-59 | +10% $-11 |
| Rate | -1.0pp $-18 | -0.5pp $-62 | base $-106 | +0.5pp $-152 | +1.0pp $-198 |
UW: 25.0% down · 7.5% · 30yr · 1.5% tax · 5.0% vac · 8.0% maint · 8.0% mgmt
Financing live
Cash to close
- Down payment
- $43,725
- Closing costs
- $5,247
- Reserves months
- —
- Total cash needed
- —
Loan-product check · same deal, 3 products live
Conventional
25% down · 7.5% · 30yr
- Down + closing
- —
- Monthly P&I
- —
- Monthly cashflow
- —
- DSCR
- —
- Eligible?
- —
Personal DTI + credit; lowest rate.
DSCR
20% down · 8.5% · 30yr
- Down + closing
- —
- Monthly P&I
- —
- Monthly cashflow
- —
- DSCR
- —
- Eligible?
- —
No personal income docs; deal must DSCR.
Hard money
10% down · 12.0% · 12mo
- Down + closing
- —
- Monthly P&I
- —
- Monthly cashflow
- —
- DSCR
- —
- Eligible?
- —
Short-term bridge; refi at stabilization.
Rent comps 1 comps
| Address | Beds | Baths | Sqft | Rent | $/sqft | DOM | Units | Dist |
|---|---|---|---|---|---|---|---|---|
| 12935 Washington Twp Blvd Waynesboro, PA | 2.0–3.0 | 1.5 | 1201 | $933 | $0.78 | 14d | 2 | 0.77mi |
Listing history 11 events
-
2026-04-27$174,900 Active 283-char remark
Show marketing remark (283 chars)
Great starter home or investment opportunity - cute home situated just outside of Waynesboro featuring 2 bedrooms, large Kitchen area, bright living room, finished attic space, replacement windows, and lovely fenced in yard. Convenient location close to shopping & restaurants.
-
2026-04-20historical $174,900 283-char remark
Show marketing remark (283 chars)
Great starter home or investment opportunity - cute home situated just outside of Waynesboro featuring 2 bedrooms, large Kitchen area, bright living room, finished attic space, replacement windows, and lovely fenced in yard. Convenient location close to shopping & restaurants.
-
2007-12-13historical
-
2007-09-26historical
-
2007-06-13
-
2007-06-13$139,900
-
2002-08-09soldstatus $52,000
-
2002-05-14historical
-
2000-09-28$52,000
-
1999-10-30historical
-
1998-10-02
ⓘ Source: listings_history table (triggers on properties + properties_extension) + one-shot
backfill from property_details.listing_events for pre-trigger history.
Tax reassessment forecast PA · Partial reset (capped growth)
- Current annual tax
- $842 · $70/mo
- Projected year-2 tax
- $1,803 · $150/mo
- Expected delta
- +$961/yr (+$80/mo · 114.1%)
ⓘ Screening estimate from a state-policy table — verify with the county assessor before closing.
Climate risk First Street
- Flood 1/10 Low FEMA zone X (unshaded) · 0% chance over 30 yrs
- Wildfire 3/10 Moderate
- Heat 4/10 Moderate 7 d/yr ≥98°F today · 16 d/yr by 30 yrs out
- Wind 2/10 Low 3% chance of damaging wind over 30 yrs
- Air quality 2/10 Low 1 unhealthy d/yr today · 2 by 30 yrs out
Nearby sold comps map
Loading sold comps map…
Walkable amenities ~0.75 mi
Loading nearby amenities…
Taxation est. · year 1
- Rental income
- $14,487
- − Mortgage interest
- −$9,797
- − Property taxes
- −$842
- − Insurance
- −$874
- − Repairs & maintenance
- −$1,159
- − Management
- −$1,159
- − Depreciation
- −$5,088
- Taxable loss
- −$4,432
- Est. tax savings @ 24.0%
- +$1,064
- After-tax cash flow
- $-214/yr
For passive investors: Depreciation is non-cash, so a rental often shows a tax loss while cash-flowing — sheltering income. Rental losses are passive: they offset passive income freely, and up to $25,000/yr can offset ordinary (W-2) income if you actively participate and your MAGI is under $100k (phasing out to $0 by $150k); unused losses carry forward. On sale, claimed depreciation is recaptured at up to 25%, and gains may owe capital-gains tax (a 1031 exchange can defer both). Figures are a year-1 estimate at your 24.0% rate — not tax advice; consult a CPA.
Schools (NCES district)
- District
- Waynesboro Area SD
- NCES district ID
- 4225110
- Math proficiency
- 36% ▼ -15.00%
- Reading proficiency
- 52% ▼ -15.00%
- Median HH income
- $50,445
- Composite
- 37.79/100
- National rank
- #4342
- State rank
- #283 of 539 in PA
Livability — Rouzerville
- Score
- 67/100
- State rank
- #1013
- US rank
- #11193
Category grades
Schools grade is shown separately in the Schools card above.
Census & demographics
- County
- Franklin County · 56,916 people
- City population
- 56
- Metro
- Chambersburg-Waynesboro, PA
- Population (ZIP)
- 29,362
- Household income
- $73,161
- Rent vs Own
- Severe rent burden
- 539.0
Population outlook (Franklin County) Hauer SSP2
- Today (2025)
- 157,827 people
- By 2030
- 158,933 · +0.7%
- By 2040
- 159,060 · +0.8%
- By 2050
- 155,132 · -1.7%
- By 2075
- 138,545 · -12.2%
- By 2100
- 112,321 · -28.8%
Race, ethnicity, and origin ACS 2023
- Neighborhood character
- Predominantly White (86%)
- Race & ethnicity
- White 86% Hispanic / Latino 7% Two or more races 6% Black 3%
- Hispanic origin (detail)
- Mexican 2% Puerto Rican 3%
- Common ancestry
- Lithuanian 3% Romanian 2% Slovak 2%
- Foreign-born
- 3% · Canada
- Languages at home
- 95% English-only · Spanish 4%
Political lean MEDSL · Franklin
- 2024 margin
- Solid R (+43.0) · D 28.1% · R 71.1%
- 2008→2024 swing
- -10.4pp toward R · 2008: -32.6pp · 2024: -43.0pp
- All cycles
- 2024: R+43.0 2020: R+43.1 2016: R+46.5 2012: R+38.5 2008: R+32.6
Not yet ingested
- Civics
- —
Market trends
- HPI YoY
- ▼ -113.20%
- Current HPI
- 189.6931
- Rent YoY
- —
- Metro
- Chambersburg-Waynesboro, PA
- State GDP YoY
- ▲ 1.68%
- F500 in state
- 34
Industry mix (Fortune 500 HQ in PA)
| Industry | F500 HQs | Revenue |
|---|---|---|
| Healthcare | 2 | $309B |
|
||
| Insurance | 2 | $27B |
|
||
| Telecommunications / Media | 1 | $124B |
|
||
| Industrial Distribution | 1 | $22B |
|
||
| Financial Services | 1 | $20B |
|
||
| Chemicals / Materials | 1 | $18B |
|
||
Price history
+236.3% since first listed11 events — show timeline
- 2026-04-27 Listed $174,900 BRIGHT MLS
- 2026-04-20 Coming Soon $174,900 BRIGHT MLS
- 2007-12-13 Listing Removed — BRIGHT MLS
- 2007-09-26 Delisted — MRIS
- 2007-06-13 Listed $139,900 BRIGHT MLS
- 2007-06-13 Listed — MRIS
- 2002-08-09 Sold (MLS) $52,000 MRIS
- 2002-05-14 Delisted — MRIS
- 2000-09-28 Listed $52,000 MRIS
- 1999-10-30 Delisted — MRIS
- 1998-10-02 Listed — MRIS
Property tax history
+12.5%/yrLatest (2026): $842 · +0.0% YoY. Source: county tax records.
Cash-flow waterfall
monthlySold comps — $/sqft
last 12 mo · ≤1 miLoading sold comps…