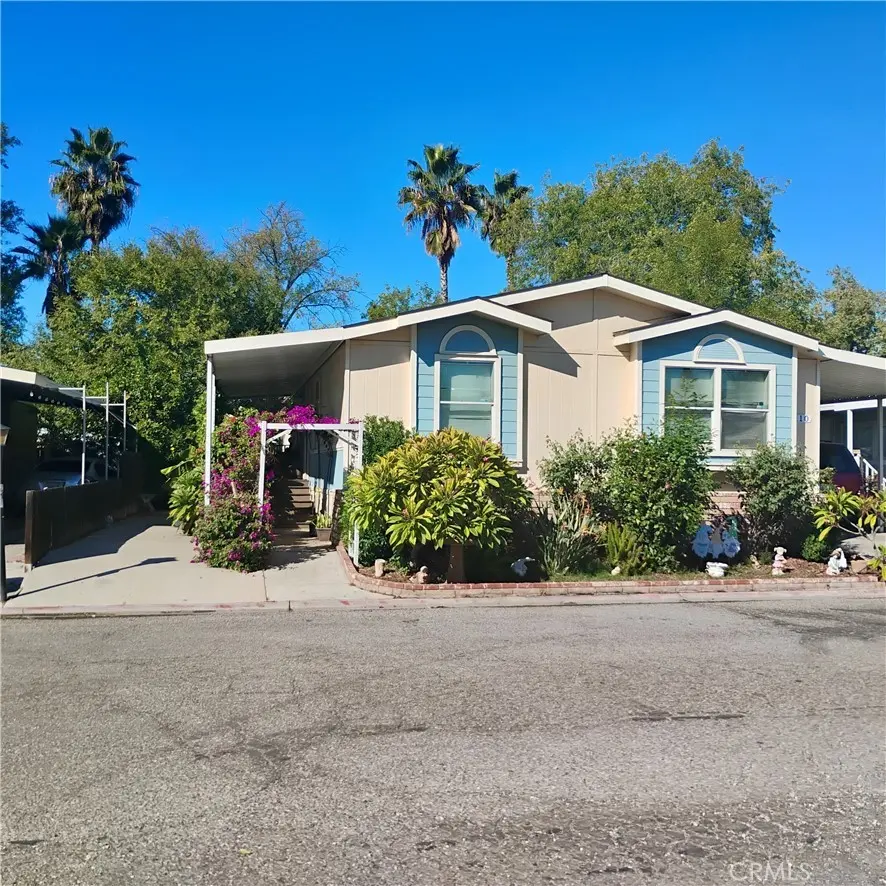
2851 S La Cadena Dr #110 · Colton, CA
Flood risk 1/10 · Minimal
- FEMA flood zone
- X (unshaded)
- Chance of flooding over 30 yrs
- 0.0%
- Est. flood insurance / yr
- $507 – $1,088
Fire risk 7/10 · Major
- Est. fire insurance / yr
- $659 – $1,223
Heat risk 8/10 · Major
- Hot days now (above 101°F)
- 7 days/yr
- Hot days in 30 yrs
- 19 days/yr
Wind risk 1/10 · Minimal
- Chance of severe wind over 30 yrs
- —
Air-quality risk 9/10 · Severe
- Unhealthy air days now
- 22 days/yr
- Unhealthy air days in 30 yrs
- 27 days/yr
Risk factors via First Street. Map © Google.
Why this score? — see what drove the B- grade
The composite is a weighted blend of 9 inputs, each scored 0–100. Each bar is that input's sub-score; the figure is the points it added to the 100-point composite (weight × sub-score).
- Cash flow +30.0/30.0
- DSCR +10.0/10.0
- 1% rule +9.8/10.0
- Schools +4.1/10.0
- ARV discount +3.5/15.0
- Rent growth +3.1/5.0
- Livability +2.8/5.0
- Condition / age +2.5/5.0
- Appreciation +0.0/10.0
$220,000
🖨 Deal sheet 📄 Offer letter ✓ Due diligence
Listing remarks MLS
Beautiful and well-maintained Mobile Home featuring 4 bedrooms and 2 bathrooms with 1,620 sq. ft. of spacious living. This property offers an open floor plan with a comfortable living area, central A/C and heating, and a cozy fireplace. The kitchen includes ample cabinet space and essential appliances. Situated on a generous lot with a carport and outdoor space for additional parking or entertaining. Located in a welcoming community in Colton, close to shopping, schools, and easy freeway access. Perfect for buyers seeking affordability, comfort, and convenience.
Key facts
- Open floor plan
- Easy freeway access
- Ample cabinet space
Tags
Neighborhood map
What this means for you Summary
Snapshot
- This is a 4-bed/2.0-bath manufactured listed at $220k.
Deal economics
- At list price, monthly cash flow is $1k ($15k/yr) — positive.
- The deal already cash-flows at list — no discount required.
- Meets the 1% rule at list price ($3k rent vs $220k).
- Recommended offer: $194k (12.0% below list) — sets the bar for market timing.
- Cap rate 13.3% vs local median 3.5% in Colton — top-decile yield for the area; either an underpriced asset or a hidden risk that comps aren't pricing in. Stress-test before assuming the spread holds.
Location & tenants
- Location reads 56/100 on livability (#817 in CA) — a working-class tenant base; expect higher turnover. Strengths: housing A+; Watch: employment C-, crime D, schools F.
- Riverside Unified (urban): math 36% / reading 51% proficiency, ranked #574 of 1,400 in CA (top 41%) — families likely to look elsewhere, expect single-tenant / working-renter base with shorter leases.
- Market conditions: Rents rising (+2.5%/yr); 101 active listings in the ZIP; 11 comparable units currently listed for rent nearby; rentals lingering (median 44d on market — plan ~5-8 weeks vacancy on turnover, expect pricing pressure); 64% of comp listings sitting > 30 days — soft ceiling on asking rent; 9,195 units permitted in Riverside County in 2024 (1,512 in 5+ unit buildings).
- At $3,254/mo this rent would consume 55% of the median local household income ($71k/yr) (locally 2195% of renters already pay >50% of income on rent) — very limited rent-growth headroom before tenants either downsize or default.
Forward outlook
- Local home prices are declining (-3.0%/yr); year-one equity from $2k of loan paydown is wiped out by about $7k of value loss. Plan a longer hold.
- Riverside County population projected at +22% by 2050 — long-run rental-demand tailwind backs the buy-and-hold thesis.
- At projected returns (-3.0% appreciation + 2.5% rent growth), your $62k cash investment doubles in ~5 years — after that, you're playing with house money.
Negotiation context
- It's been on market 177 days — a 12% lower offer ($194k) is reasonable based on typical stale-listing flexibility.
Risks & watch-outs
- Climate carrying-cost: major wildfire risk; extreme-heat days projected 7→19/yr by 2055 (HVAC capex compounding) — expect insurance premiums to compound above CPI over the hold.
Questions for the listing agent
- It's been on market 177 days. Have you received any prior offers? Is the seller open to a 12% concession, seller financing, or rate buy-down credit?
- Why hasn't it sold? Are there any deal-killer items the seller is aware of (foundation, flood, title, zoning, code violations)?
- Is there a deadline driving the sale (1031 exchange, divorce, estate, relocation)? That informs how much negotiation room exists.
- Schools are F-rated, which usually means shorter tenancies and higher turnover. Who's the typical renter profile here, and what's been the actual vacancy rate?
- Crime grade is D in this area — have there been break-ins, vandalism, or insurance claims at this property in the last 3 years? What carrier currently insures it and at what premium?
- What's the average days-on-market for RENTAL listings here right now (not sales)? A rising rental-DOM trend means longer vacancies and softer asking-rent achievability than the comps imply.
- What's the recent tenant-quality profile in this submarket — average credit score on applications, eviction rate, late-payment / NSF rate, and stable-employment percentage? A property-management company in the area should have these aggregated.
- How much new for-sale + rental construction is in the pipeline within 1–3 miles? Heavy new supply typically softens prices + rents 12–24 months out; constrained supply supports both.
Investment metrics
- 1% rule
- 1.48% ✓
- Cap rate
- 13.28%
- Cash-on-cash
- 24.95%
- DSCR
- 2.11
- GRM
- 5.6
CMA / ARV
- ARV (median comp)
- $202,033
- List price
- $220,000
- Delta
- 8.89%
- Verdict
- FAIR
- Comps
- 1 within 2.0 mi
Show comp detail 4 sales within ~0.75 mi
| Address | Dist | Beds/Ba | Sqft | Sold | Price | $/sf | Match |
|---|---|---|---|---|---|---|---|
| 2851 S La Cadena Dr #162 | 0.00mi | 5/2.0 (+1) | 1,740 (+4%) | 14mo | $160,000 | $92 | 77 |
| 2851 S La Cadena Dr #55 | 0.00mi | 4/2.0 | 1,536 (-9%) | 23mo | $181,000 | $118 | 66 |
| 2851 S La cadena Dr #56 | 0.28mi | 4/2.0 | 1,440 (-14%) | 22mo | $168,000 | $117 | 45 |
| 2851 S La Cadena Dr #31 | 0.28mi | 3/2.0 (-1) | 1,440 (-14%) | 24mo | $137,500 | $95 | 38 |
Match score weights: distance 35% · size 25% · config 20% · recency 20%. Top-matched comps best support the ARV.
Projected returns pro-forma
-3.0% appreciation · 2.5% rent growth · sell at horizon
- IRR
- 17.8%
- Equity multiple
- 1.72×
- Total profit
- $44,192
- Equity at exit
- $32,803
- IRR
- 25.9%
- Equity multiple
- 3.22×
- Total profit
- $136,514
- Equity at exit
- $19,022
Cash invested: $61,600 (down + closing). Projections, not guarantees.
Landlord ↔ Tenant lean methodology
- Overall (STATE)
- 18 Strongly Tenant-Friendly
- State California
- 18 Strongly Tenant-Friendly · D+13
- County
- — inherits STATE
- City
- — inherits STATE
ZIP-level market 92324
- Rents YoY
- 2.5%
- Active inventory
- 101
- Price-to-rent
- 5.6×
Monthly cashflow live
- Estimated rent
- $3,254 high interval (Pro) →
- Mortgage (P&I)
- −$1,154
- Tax from tax record
- −$45 /mo · $537/yr
- Insurance
- −$92
- HOA
- −$0
- Vacancy / Maint / Mgmt
- −$683
- Net cashflow
- $1,281
Break-even live
UW: 25.0% down · 7.5% · 30yr · 1.5% tax · 5.0% vac · 8.0% maint · 8.0% mgmt
Financing live
Cash to close
- Down payment
- $55,000
- Closing costs
- $6,600
- Reserves months
- —
- Total cash needed
- —
Loan-product check · same deal, 3 products live
Conventional
25% down · 7.5% · 30yr
- Down + closing
- —
- Monthly P&I
- —
- Monthly cashflow
- —
- DSCR
- —
- Eligible?
- —
Personal DTI + credit; lowest rate.
DSCR
20% down · 8.5% · 30yr
- Down + closing
- —
- Monthly P&I
- —
- Monthly cashflow
- —
- DSCR
- —
- Eligible?
- —
No personal income docs; deal must DSCR.
Hard money
10% down · 12.0% · 12mo
- Down + closing
- —
- Monthly P&I
- —
- Monthly cashflow
- —
- DSCR
- —
- Eligible?
- —
Short-term bridge; refi at stabilization.
Rent comps 11 comps
| Address | Beds | Baths | Sqft | Rent | $/sqft | DOM | Units | Dist |
|---|---|---|---|---|---|---|---|---|
| 716 N Orange St Riverside, CA | 3.0 | 2.0 | 1080 | $4,999 | $4.63 | 2d | 1 | 0.70mi |
| 19173 Sequoia Grove St Riverside, CA | 3.0 | 2.5 | 1204 | $3,250 | $2.70 | 2d | 1 | 0.97mi |
| 7440 Fig Grove Ln Unit 7440 Riverside, CA | 3.0 | 3.0 | 1257 | $1,100 | $0.88 | 44d | 1 | 1.00mi |
| 7512 Fig Grove Ln Riverside, CA | 3.0 | 2.5 | 1410 | $3,500 | $2.48 | 2d | 1 | 1.01mi |
| 7281 Olive Grove St Riverside, CA | 3.0 | 2.5 | 1257 | $3,075 | $2.45 | 44d | 1 | 1.02mi |
| 22042 Tanager St Grand Terrace, CA | 4.0 | 2.5 | 1875 | $4,000 | $2.13 | 44d | 1 | 1.18mi |
| 1151 Clark St Riverside, CA | 4.0 | 2.0 | 1248 | $2,800 | $2.24 | 44d | 1 | 1.22mi |
| 19439 Seeding Palace Cir Riverside, CA | 3.0 | 2.0 | 1771 | $3,450 | $1.95 | 44d | 1 | 1.46mi |
| 4010 Witt Ave Riverside, CA | 4.0 | 2.0 | 1900 | $3,750 | $1.97 | 11d | 1 | 1.46mi |
| 12553 Pascal Ave Grand Terrace, CA | 3.0 | 2.0 | 1575 | $2,995 | $1.90 | 44d | 1 | 1.48mi |
| 3812 Carrotwood St Riverside, CA | 3.0 | 3.0 | 1381 | $2,900 | $2.10 | 44d | 1 | 1.48mi |
Listing history 2 events
-
2026-05-31days on market $220,000 Active 177 DOM
-
2025-12-05$220,000 Active 568-char remark
Show marketing remark (568 chars)
Beautiful and well-maintained Mobile Home featuring 4 bedrooms and 2 bathrooms with 1,620 sq. ft. of spacious living. This property offers an open floor plan with a comfortable living area, central A/C and heating, and a cozy fireplace. The kitchen includes ample cabinet space and essential appliances. Situated on a generous lot with a carport and outdoor space for additional parking or entertaining. Located in a welcoming community in Colton, close to shopping, schools, and easy freeway access. Perfect for buyers seeking affordability, comfort, and convenience.
ⓘ Source: listings_history table (triggers on properties + properties_extension) + one-shot
backfill from property_details.listing_events for pre-trigger history.
Tax reassessment forecast CA · Resets to sale price
- Current annual tax
- $537 · $45/mo
- Projected year-2 tax
- $1,672 · $139/mo
- Expected delta
- +$1,135/yr (+$95/mo · 211.5%)
ⓘ Screening estimate from a state-policy table — verify with the county assessor before closing.
Climate risk First Street
- Flood 1/10 Low FEMA zone X (unshaded) · 0% chance over 30 yrs
- Wildfire 7/10 Severe
- Heat 8/10 Severe 7 d/yr ≥101°F today · 19 d/yr by 30 yrs out
- Wind 1/10 Low
- Air quality 9/10 Extreme 22 unhealthy d/yr today · 27 by 30 yrs out
Nearby sold comps map
Loading sold comps map…
Walkable amenities ~0.75 mi
Loading nearby amenities…
Taxation est. · year 1
- Rental income
- $39,049
- − Mortgage interest
- −$12,323
- − Property taxes
- −$537
- − Insurance
- −$1,100
- − Repairs & maintenance
- −$3,124
- − Management
- −$3,124
- − Depreciation
- −$6,400
- Taxable income
- $12,441
- Est. tax owed @ 24.0%
- −$2,986
- After-tax cash flow
- $12,382/yr
For passive investors: Depreciation is non-cash, so a rental often shows a tax loss while cash-flowing — sheltering income. Rental losses are passive: they offset passive income freely, and up to $25,000/yr can offset ordinary (W-2) income if you actively participate and your MAGI is under $100k (phasing out to $0 by $150k); unused losses carry forward. On sale, claimed depreciation is recaptured at up to 25%, and gains may owe capital-gains tax (a 1031 exchange can defer both). Figures are a year-1 estimate at your 24.0% rate — not tax advice; consult a CPA.
Schools (NCES district)
- District
- Riverside Unified
- NCES district ID
- 0633150
- Math proficiency
- 36% ▲ 1.00%
- Reading proficiency
- 51% ▲ 2.00%
- Median HH income
- $62,038
- Composite
- 40.8/100
- National rank
- #7563
- State rank
- #574 of 1400 in CA
Livability — Colton
- Score
- 56/100
- State rank
- #817
- US rank
- #23005
Category grades
Schools grade is shown separately in the Schools card above.
Census & demographics
- County
- San Bernardino County · 2,030,291 people
- City population
- 57,365
- Metro
- Riverside-San Bernardino-Ontario, CA
- Population (ZIP)
- 57,365
- Household income
- $71,078
- Rent vs Own
- Severe rent burden
- 2195.0
Population outlook (Riverside County) Hauer SSP2
- Today (2025)
- 2,664,475 people
- By 2030
- 2,802,692 · +5.2%
- By 2040
- 3,050,904 · +14.5%
- By 2050
- 3,256,783 · +22.2%
- By 2075
- 3,655,058 · +37.2%
- By 2100
- 3,766,594 · +41.4%
Race, ethnicity, and origin ACS 2023
- Neighborhood character
- Predominantly Hispanic (74%)
- Race & ethnicity
- Hispanic / Latino 74% Two or more races 24% White 11% Black 8% Asian 4% Native American 1%
- Hispanic origin (detail)
- Mexican 69%
- Common ancestry
- Lithuanian 1%
- Foreign-born
- 24% · Canada, Vietnam
- Languages at home
- 47% English-only · Spanish 49% Tagalog/Filipino 1% Other Indo-European 1%
Political lean MEDSL · Riverside
- 2024 margin
- Toss-up / Even · D 48.0% · R 49.3% · Other 2.6%
- 2008→2024 swing
- -3.6pp toward R · 2008: 2.3pp · 2024: -1.3pp
- All cycles
- 2024: R+1.3 2020: D+8.0 2016: D+4.3 2012: R+0.4 2008: D+2.3
Not yet ingested
- Civics
- —
Market trends
- HPI YoY
- ▼ -270.99%
- Current HPI
- 451.2973
- Rent YoY
- ▲ 2.50%
- Metro
- Riverside-San Bernardino-Ontario, CA
- State GDP YoY
- ▲ 3.21%
- F500 in state
- 116
Industry mix (Fortune 500 HQ in CA)
| Industry | F500 HQs | Revenue |
|---|---|---|
| Technology | 27 | $1,492B |
|
||
| Financial Services | 3 | $174B |
|
||
| Retail | 3 | $44B |
|
||
| Insurance | 3 | $26B |
|
||
| Media / Entertainment | 2 | $115B |
|
||
| Pharmaceuticals / Biotech | 2 | $62B |
|
||
Price history
1 event — show timeline
- 2025-12-05 Listed $220,000 CRMLS
Property tax history
-2.0%/yrLatest (2025): $537 · +3.1% YoY. Source: county tax records.
Cash-flow waterfall
monthlySold comps — $/sqft
last 12 mo · ≤1 miLoading sold comps…