668 Highland Ave · Wadsworth, OH
Flood risk 1/10 · Minimal
- FEMA flood zone
- X (unshaded)
- Chance of flooding over 30 yrs
- 0.0%
- Est. flood insurance / yr
- $473 – $860
Fire risk 1/10 · Minimal
- Est. fire insurance / yr
- $713 – $1,323
Heat risk 2/10 · Minimal
- Hot days now (above 96°F)
- 7 days/yr
- Hot days in 30 yrs
- 17 days/yr
Wind risk 1/10 · Minimal
- Chance of severe wind over 30 yrs
- —
Air-quality risk 2/10 · Minimal
- Unhealthy air days now
- 1 days/yr
- Unhealthy air days in 30 yrs
- 1 days/yr
Risk factors via First Street. Map © Google.
Why this score? — see what drove the D grade
The composite is a weighted blend of 9 inputs, each scored 0–100. Each bar is that input's sub-score; the figure is the points it added to the 100-point composite (weight × sub-score).
- Cash flow +12.0/30.0
- ARV discount +10.5/15.0
- Schools +6.5/10.0
- Livability +4.1/5.0
- DSCR +3.5/10.0
- 1% rule +2.7/10.0
- Rent growth +2.5/5.0
- Condition / age +2.5/5.0
- Appreciation +0.0/10.0
$269,000
🖨 Deal sheet 📄 Offer letter ✓ Due diligence
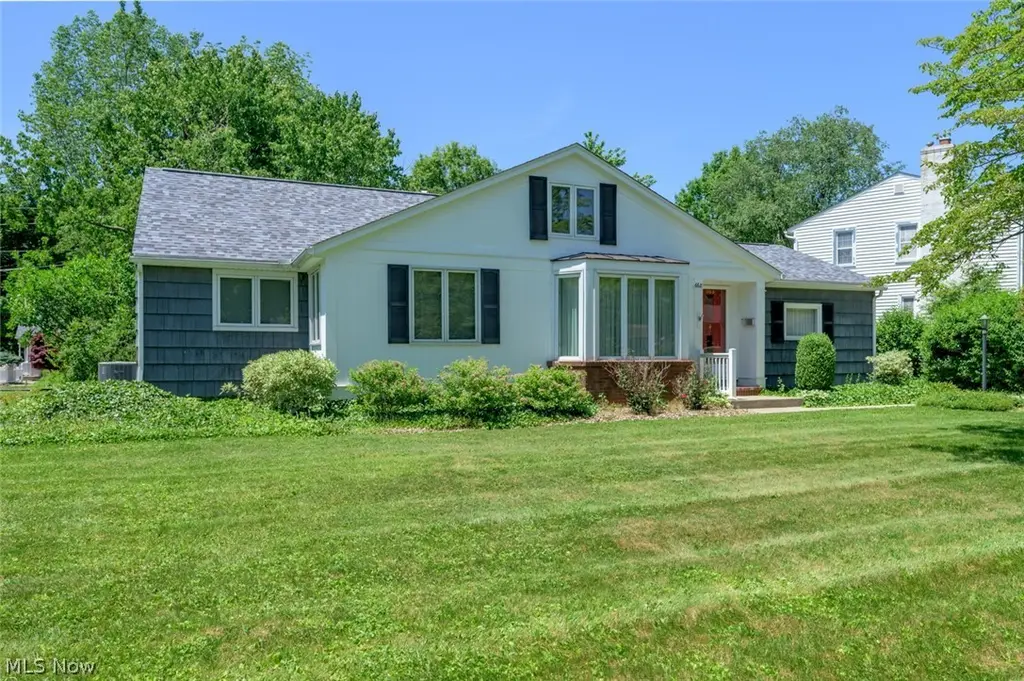
Listing remarks
Charming and beautifully maintained 1954 bungalow offering the perfect blend of original character and modern comfort! Situated on a picturesque . 25-acre lot in the highly desirable Wadsworth City School District, this 3-bedroom, 1 bath home features over 1,500 square feet of living space, plus more than 1,100 square feet of finished basement space for additional living, recreation, or storage needs. Step inside to a spacious oversized living room highlighted by a stunning bay window that fills the home with natural light. The inviting family room features a cozy brick fireplace, creating the perfect gathering space. Original charm shines throughout while cedar-sided exterior adds timeless
Key facts
- Cedar-sided exterior
- Cozy brick fireplace
- Picturesque lot
Tags
Property features AI
Exterior
- Parking: Attached garage (1 space); Driveway
- Utilities: Public water; Public sewer
- Home design: Two-story home; Asphalt/fiberglass roof; Brick, cedar and vinyl siding
- Construction: Built (year per public records); Brick, cedar and vinyl-sided construction; Asphalt/fiberglass roof
- Exterior features: Lot approximately 0.258 acres
Interior
- Bedrooms: One main-level bedroom
- Bathrooms: One full bathroom (main level)
- Heating & cooling: Gas heating; Central air conditioning
- Interior features: Full, partially finished basement; Fireplace (1)
Neighborhood map
What this means for you Summary
Snapshot
- This is a 3-bed/1.0-bath single-family listed at $269k.
Deal economics
- At list price, monthly cash flow is $-66 ($-788/yr) — negative.
- To cash-flow at today's rent, offer at most $257k (4.3% below list).
- To meet the 1% rule (rent ≥ 1% of price), the offer needs to be $207k (23.1% below list).
- Recommended offer: $207k (23.1% below list) — sets the bar for 1% rule.
- Cap rate 6.0% vs local median 3.3% in Wadsworth — top-decile yield for the area; either an underpriced asset or a hidden risk that comps aren't pricing in. Stress-test before assuming the spread holds.
Location & tenants
- Location reads 82/100 on livability (#74 in OH, #1,136 nationally) — a professional / high-income tenant draw. Strengths: schools A+, cost of living A+, housing A+; Watch: amenities F, commute F.
- Wadsworth City (suburban): math 74% / reading 77% proficiency, ranked #83 of 656 in OH (top 13%) — strong family-tenant draw, lease renewals of 3-5y typical; only 17% free/reduced lunch — higher-income household profile.
- Market conditions: 135 active listings in the ZIP; 8 comparable units currently listed for rent nearby; rentals at typical pace (median 19d on market — plan ~3-4 weeks tenant-placement turnaround); solid renter incomes; 471 units permitted in Medina County in 2024 (0 in 5+ unit buildings).
Forward outlook
- Local home prices are declining (-3.0%/yr); year-one equity from $2k of loan paydown is wiped out by about $8k of value loss. Plan a longer hold.
Negotiation context
- Only 7 days on market — expect competitive offers; lowballing is unlikely to land.
- Current owner paid $96k; list at $269k implies a 179% gain — meaningful room to come down on a strong offer.
Risks & watch-outs
- Watch-outs: built in 1954 — expect roof / HVAC / electrical / plumbing capex.
Questions for the listing agent
- What do current leases actually rent for vs. the listed asking? Can we see a recent rent roll and the last 12 months of T-12 income?
- Built in 1954 — when were the roof, HVAC, electrical panel, plumbing, and water heater last replaced?
- Is there a deadline driving the sale (1031 exchange, divorce, estate, relocation)? That informs how much negotiation room exists.
- Schools are A-rated — typically a magnet for longer-tenancy family renters. What's the average tenant stay here, and is there a school-zone premium baked into asking?
- The area grade is low — what's the realistic commute time and amenity access for the typical tenant pool here? Any planned neighborhood developments (good or bad) we should know about?
- What's the average days-on-market for RENTAL listings here right now (not sales)? A rising rental-DOM trend means longer vacancies and softer asking-rent achievability than the comps imply.
- What's the recent tenant-quality profile in this submarket — average credit score on applications, eviction rate, late-payment / NSF rate, and stable-employment percentage? A property-management company in the area should have these aggregated.
- How much new for-sale + rental construction is in the pipeline within 1–3 miles? Heavy new supply typically softens prices + rents 12–24 months out; constrained supply supports both.
Investment metrics
- 1% rule
- 0.77% ✗
- Cap rate
- 6.00%
- Cash-on-cash
- -1.05%
- DSCR
- 0.95
- GRM
- 10.8
CMA / ARV
- ARV (on-the-fly)
- $287,924
- Comps found
- 12
Show comp detail 12 sales within ~0.75 mi
| Address | Dist | Beds/Ba | Sqft | Sold | Price | $/sf | Match |
|---|---|---|---|---|---|---|---|
| 681 Highland Ave | 0.04mi | 3/2.5 | 1,568 (-1%) | 2mo | $330,000 | $210 | 89 |
| 729 Woodland Ave | 0.13mi | 3/3.0 | 1,604 (+1%) | 7mo | $280,000 | $175 | 78 |
| 199 Longview Dr | 0.34mi | 3/1.5 | 1,640 (+4%) | 7mo | $322,000 | $196 | 70 |
| 214 Beechwood Dr | 0.36mi | 4/1.5 (+1) | 1,612 (+2%) | 4mo | $291,500 | $181 | 69 |
| 468 High St | 0.39mi | 3/1.5 | 1,450 (-8%) | 0mo | $289,750 | $200 | 66 |
| 487 West St | 0.60mi | 3/1.5 | 1,452 (-8%) | 0mo | $275,000 | $189 | 56 |
| 555 Highland Ave | 0.21mi | 4/1.5 (+1) | 1,344 (-15%) | 5mo | $245,000 | $182 | 54 |
| 140 W North St | 0.62mi | 3/2.0 | 1,474 (-7%) | 6mo | $200,000 | $136 | 50 |
| 369 Tulip Trl | 0.68mi | 3/2.5 | 1,665 (+5%) | 10mo | $300,000 | $180 | 46 |
| 352 N Lyman St | 0.58mi | 3/2.0 | 1,386 (-12%) | 8mo | $232,900 | $168 | 42 |
| 357 West St | 0.74mi | 3/2.0 | 1,447 (-8%) | 7mo | $267,500 | $185 | 41 |
| 275 High St | 0.74mi | 3/1.0 | 1,392 (-12%) | 9mo | $104,000 | $75 | 38 |
Match score weights: distance 35% · size 25% · config 20% · recency 20%. Top-matched comps best support the ARV.
Projected returns pro-forma
-3.0% appreciation · 3.0% rent growth · sell at horizon
- IRR
- -18.1%
- Equity multiple
- 0.36×
- Total profit
- $-47,838
- Equity at exit
- $40,109
- IRR
- -10.3%
- Equity multiple
- 0.37×
- Total profit
- $-47,310
- Equity at exit
- $23,258
Cash invested: $75,320 (down + closing). Projections, not guarantees.
Landlord ↔ Tenant lean methodology
- Overall (STATE)
- 73 Landlord-Friendly
- State Ohio
- 73 Landlord-Friendly · R+6
- County
- — inherits STATE
- City
- — inherits STATE
ZIP-level market 44281
- Active inventory
- 135
- Price-to-rent
- 10.8×
Monthly cashflow live
- Estimated rent
- $2,070 high interval (Pro) →
- Mortgage (P&I)
- −$1,411
- Tax from tax record
- −$178 /mo · $2,137/yr
- Insurance
- −$112
- HOA
- −$0
- Vacancy / Maint / Mgmt
- −$435
- Net cashflow
- $-66
Break-even live
UW: 25.0% down · 7.5% · 30yr · 1.5% tax · 5.0% vac · 8.0% maint · 8.0% mgmt
Financing live
Cash to close
- Down payment
- $67,250
- Closing costs
- $8,070
- Reserves months
- —
- Total cash needed
- —
Loan-product check · same deal, 3 products live
Conventional
25% down · 7.5% · 30yr
- Down + closing
- —
- Monthly P&I
- —
- Monthly cashflow
- —
- DSCR
- —
- Eligible?
- —
Personal DTI + credit; lowest rate.
DSCR
20% down · 8.5% · 30yr
- Down + closing
- —
- Monthly P&I
- —
- Monthly cashflow
- —
- DSCR
- —
- Eligible?
- —
No personal income docs; deal must DSCR.
Hard money
10% down · 12.0% · 12mo
- Down + closing
- —
- Monthly P&I
- —
- Monthly cashflow
- —
- DSCR
- —
- Eligible?
- —
Short-term bridge; refi at stabilization.
Rent comps 8 comps
| Address | Beds | Baths | Sqft | Rent | $/sqft | DOM | Units | Dist |
|---|---|---|---|---|---|---|---|---|
| 893 West St Wadsworth, OH | 3.0 | 2.5 | 1742 | $2,600 | $1.49 | 1d | 1 | 0.26mi |
| 276 Acacia Ln Wadsworth, OH | 2.0 | 2.0 | 1318 | $1,990 | $1.51 | 1d | 6 | 0.85mi |
| 1335 High St Apt 114 Wadsworth, OH | 2.0 | 2.5 | 1077 | $1,425 | $1.32 | 14d | 1 | 1.06mi |
| 1353 High St Unit 114 Wadsworth, OH | 2.0 | 2.5 | 1077 | $1,425 | $1.32 | 43d | 1 | 1.06mi |
| 1291 High St #101 Wadsworth, OH | 2.0 | 2.5 | 1077 | $1,405 | $1.30 | 2d | 1 | 1.10mi |
| 1390 Reimer Rd Unit B Wadsworth, OH | 3.0 | 1.5 | 1400 | $1,525 | $1.09 | 19d | 1 | 1.13mi |
| 1315 High St Unit 114 Wadsworth, OH | 2.0 | 2.5 | 1077 | $1,425 | $1.32 | 43d | 1 | 1.16mi |
| 172 1st St Wadsworth, OH | 2.0 | 2.0 | 1150 | $1,950 | $1.70 | 20d | 1 | 1.28mi |
Listing history 5 events
-
2026-06-13statusdays on market $269,000 Pending 7 DOM
-
2026-06-09days on market $269,000 Active 4 DOM
-
2026-06-08days on market $269,000 Active 3 DOM
-
2026-06-07remarks 699-char remark
-
2026-06-07$269,000 Active 2 DOM
ⓘ Source: listings_history table (triggers on properties + properties_extension) + one-shot
backfill from property_details.listing_events for pre-trigger history.
Tax reassessment forecast OH · Partial reset (capped growth)
- Current annual tax
- $2,137 · $178/mo
- Projected year-2 tax
- $3,167 · $264/mo
- Expected delta
- +$1,030/yr (+$86/mo · 48.2%)
ⓘ Screening estimate from a state-policy table — verify with the county assessor before closing.
Climate risk First Street
- Flood 1/10 Low FEMA zone X (unshaded) · 0% chance over 30 yrs
- Wildfire 1/10 Low
- Heat 2/10 Low 7 d/yr ≥96°F today · 17 d/yr by 30 yrs out
- Wind 1/10 Low
- Air quality 2/10 Low 1 unhealthy d/yr today · 1 by 30 yrs out
Nearby sold comps map
Loading sold comps map…
Walkable amenities ~0.75 mi
Loading nearby amenities…
Taxation est. · year 1
- Rental income
- $24,838
- − Mortgage interest
- −$15,068
- − Property taxes
- −$2,137
- − Insurance
- −$1,345
- − Repairs & maintenance
- −$1,987
- − Management
- −$1,987
- − Depreciation
- −$7,825
- Taxable loss
- −$5,512
- Est. tax savings @ 24.0%
- +$1,323
- After-tax cash flow
- $535/yr
For passive investors: Depreciation is non-cash, so a rental often shows a tax loss while cash-flowing — sheltering income. Rental losses are passive: they offset passive income freely, and up to $25,000/yr can offset ordinary (W-2) income if you actively participate and your MAGI is under $100k (phasing out to $0 by $150k); unused losses carry forward. On sale, claimed depreciation is recaptured at up to 25%, and gains may owe capital-gains tax (a 1031 exchange can defer both). Figures are a year-1 estimate at your 24.0% rate — not tax advice; consult a CPA.
Schools (NCES district)
- District
- Wadsworth City
- NCES district ID
- 3910029
- Math proficiency
- 74% ▼ -8.00%
- Reading proficiency
- 77% ▼ -6.00%
- Median HH income
- $62,397
- Composite
- 65.1/100
- National rank
- #499
- State rank
- #83 of 656 in OH
Livability — Wadsworth
- Score
- 82/100
- State rank
- #74
- US rank
- #1136
Category grades
Schools grade is shown separately in the Schools card above.
Census & demographics
- Census place
- Wadsworth, OH
- County
- Medina County · 145,517 people
- City population
- 34,704
- Metro
- Cleveland-Elyria, OH
- Population (ZIP)
- 34,704
- Household income
- $89,131
- Rent vs Own
- Severe rent burden
- 597.0
Population outlook (Medina County) Hauer SSP2
- Today (2025)
- 185,249 people
- By 2030
- 188,174 · +1.6%
- By 2040
- 190,350 · +2.8%
- By 2050
- 187,283 · +1.1%
- By 2075
- 177,108 · -4.4%
- By 2100
- 151,304 · -18.3%
Race, ethnicity, and origin ACS 2023
- Neighborhood character
- Predominantly White (95%)
- Race & ethnicity
- White 95% Two or more races 2% Hispanic / Latino 1% Asian 1%
- Common ancestry
- Romanian 4% Slovak 2% Lithuanian 1%
- Foreign-born
- 2% · Canada
- Languages at home
- 97% English-only · Spanish 1% Other Indo-European 1% Other Asian/Pacific 0%
Political lean MEDSL · Medina
- 2024 margin
- Strong R (+24.8) · D 37.2% · R 62.0%
- 2008→2024 swing
- -16.8pp toward R · 2008: -8.0pp · 2024: -24.8pp
- All cycles
- 2024: R+24.8 2020: R+23.4 2016: R+24.9 2012: R+13.1 2008: R+8.0
Not yet ingested
- Civics
- —
Market trends
- HPI YoY
- ▼ -148.82%
- Current HPI
- 253.1502
- Rent YoY
- —
- Metro
- Cleveland-Elyria, OH
- State GDP YoY
- ▲ 1.98%
- F500 in state
- 48
Industry mix (Fortune 500 HQ in OH)
| Industry | F500 HQs | Revenue |
|---|---|---|
| Insurance | 3 | $145B |
|
||
| Industrial Machinery | 3 | $49B |
|
||
| Financial Services | 3 | $24B |
|
||
| Consumer Goods | 2 | $93B |
|
||
| Aerospace / Defense | 2 | $47B |
|
||
| Utilities | 2 | $33B |
|
||
Price history
+178.9% since first listed2 events — show timeline
- 2026-06-05 Listed $269,000 MLSNOW
- 1993-12-10 Sold (Public Records) $96,450 Public Records
Property tax history
+3.8%/yrLatest (2025): $2,137 · +1.5% YoY. Source: county tax records.
Cash-flow waterfall
monthlySold comps — $/sqft
last 12 mo · ≤1 miLoading sold comps…