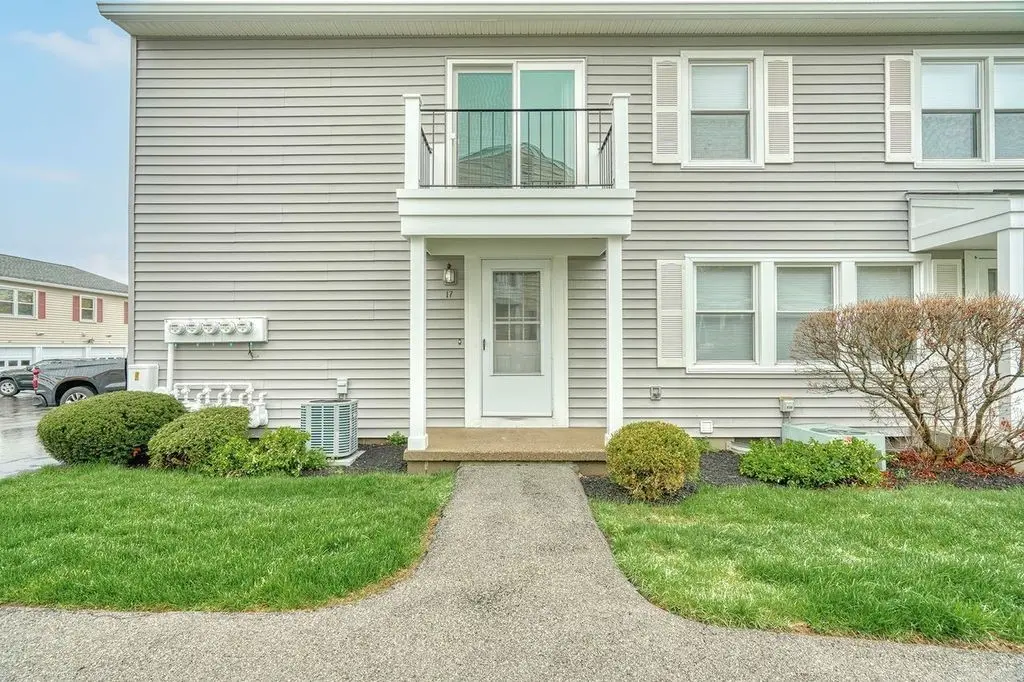
17 Eagle Ln · Fairport, NY
Flood risk 1/10 · Minimal
- FEMA flood zone
- X (unshaded)
- Chance of flooding over 30 yrs
- 0.0%
- Est. flood insurance / yr
- $507 – $1,088
Fire risk 1/10 · Minimal
- Est. fire insurance / yr
- $691 – $1,283
Heat risk 3/10 · Minor
- Hot days now (above 95°F)
- 7 days/yr
- Hot days in 30 yrs
- 17 days/yr
Wind risk 1/10 · Minimal
- Chance of severe wind over 30 yrs
- —
Air-quality risk 2/10 · Minimal
- Unhealthy air days now
- 1 days/yr
- Unhealthy air days in 30 yrs
- 1 days/yr
Risk factors via First Street. Map © Google.
Why this score? — see what drove the D grade
The composite is a weighted blend of 9 inputs, each scored 0–100. Each bar is that input's sub-score; the figure is the points it added to the 100-point composite (weight × sub-score).
- ARV discount +15.0/15.0
- Cash flow +7.6/30.0
- Schools +5.4/10.0
- 1% rule +4.2/10.0
- Livability +3.7/5.0
- Condition / age +2.5/5.0
- Rent growth +2.3/5.0
- DSCR +1.7/10.0
- Appreciation +0.0/10.0
$189,900
🖨 Deal sheet (PDF) 📄 Offer letter ✓ Due diligence
Listing remarks
Welcome Home to this FULLY UPDATED Townhome in Popular Valley Creek! Live/Own for LESS THAN RENTING! FAIRPORT ELECTRIC! This Truly Turn-Key Home Features an Updated Kitchen, Updated Alliances with In-Unit Washer/Dryer, Updated Furnace and CENTRAL AIR, Updated Electric on Circuit Breakers, Updated Thermopane Windows and a 1 Car Garage with Electric Opener! Sliding Doors off Dining Room Lead to a Small Deck, Large Primary Bedroom with a Huge Walk-In closet and Updated Bath in Neutral Finishes. Move Right In! Just Minutes to Pittsford and Fairport Villages, Steps to Wegmans and All Eastside Amenities!
Key facts
- Small deck
- Huge walk-in closet
- Updated electric
Tags
Property features AI
Finance
- Financial info: Pets allowed: Cats and dogs
- HOA & community: Association: Crofton; Monthly association fee of $325; HOA covers common area maintenance, common area insurance, insurance, structure maintenance, reserve fund, sewer, snow removal, trash, and water
Exterior
- Parking: Attached garage; Detached garage; Garage with door opener; Open parking; 1 garage space
- Utilities: High-speed internet available; Public water connected; Sewer connected; Circuit breaker electrical system
- Home design: Single-story property; Resale condition; Vinyl siding
- Construction: Copper plumbing; Existing construction
- Exterior features: Balcony; Near public transit; Rectangular lot
Interior
- Kitchen: Electric oven; Electric range; Microwave; Range hood; Dishwasher; Refrigerator; Exhaust fan
- Bedrooms: Total of 4 rooms (includes living spaces and bedroom count not specified)
- Flooring: Carpet; Tile; Varies
- Bathrooms: 1 full bathroom
- Heating & cooling: Forced air heating (gas and electric); Central air conditioning
- Interior features: Entrance foyer; Living/dining room; Sliding glass door(s); Programmable thermostat; Thermal windows; Sliding doors
- Laundry & utility: In-unit laundry; Washer; Dryer; Electric water heater
Neighborhood map
What this means for you Summary
Snapshot
- This is a 2-bed/1.0-bath single-family listed at $190k.
Deal economics
- At list price, monthly cash flow is $-230 ($-3k/yr) — negative.
- To cash-flow at today's rent, offer at most $149k (21.4% below list).
- To meet the 1% rule (rent ≥ 1% of price), the offer needs to be $176k (7.5% below list).
- Recommended offer: $149k (21.4% below list) — sets the bar for cash-flow.
- Cap rate 4.8% vs local median 3.5% in Fairport — top-decile yield for the area; either an underpriced asset or a hidden risk that comps aren't pricing in. Stress-test before assuming the spread holds.
Location & tenants
- Location reads 74/100 on livability (#301 in NY, #4,847 nationally) — a middle-class / working-renter tenant base. Strengths: housing A+, health & safety A+, schools A; Watch: commute F.
- Fairport Central School District (suburban): math 55% / reading 66% proficiency, ranked #199 of 590 in NY (top 34%) — acceptable for families but not a draw, mixed tenant base, ~2y average lease; only 14% free/reduced lunch — higher-income household profile.
- Market conditions: Rents soft (-0.8%/yr); 188 active listings in the ZIP; 4 comparable units currently listed for rent nearby; rentals leasing fast (median 5d on market — plan ~1-2 weeks tenant-placement turnaround); solid renter incomes; 1,169 units permitted in Monroe County in 2024 (591 in 5+ unit buildings).
Forward outlook
- Local home prices are declining (-3.0%/yr); year-one equity from $1k of loan paydown is wiped out by about $6k of value loss. Plan a longer hold.
- Monroe County population projected to shrink 6% by 2050 — rents likely to lag national; underwrite the cash flow, not the appreciation.
Negotiation context
- Only 10 days on market — expect competitive offers; lowballing is unlikely to land.
Questions for the listing agent
- What do current leases actually rent for vs. the listed asking? Can we see a recent rent roll and the last 12 months of T-12 income?
- Built in 1973 — when were the roof, HVAC, electrical panel, plumbing, and water heater last replaced?
- What does the HOA fee cover, when was the last increase, and are there any pending special assessments or reserve-fund shortfalls?
- Is there a deadline driving the sale (1031 exchange, divorce, estate, relocation)? That informs how much negotiation room exists.
- Schools are A-rated — typically a magnet for longer-tenancy family renters. What's the average tenant stay here, and is there a school-zone premium baked into asking?
- The area grade is low — what's the realistic commute time and amenity access for the typical tenant pool here? Any planned neighborhood developments (good or bad) we should know about?
- What's the average days-on-market for RENTAL listings here right now (not sales)? A rising rental-DOM trend means longer vacancies and softer asking-rent achievability than the comps imply.
- What's the recent tenant-quality profile in this submarket — average credit score on applications, eviction rate, late-payment / NSF rate, and stable-employment percentage? A property-management company in the area should have these aggregated.
- How much new for-sale + rental construction is in the pipeline within 1–3 miles? Heavy new supply typically softens prices + rents 12–24 months out; constrained supply supports both.
Investment metrics
- 1% rule
- 0.92% ✗
- Cap rate
- 4.84%
- Cash-on-cash
- -5.19%
- DSCR
- 0.77
- GRM
- 9.0
CMA / ARV
- ARV (median comp)
- $306,695
- List price
- $189,900
- Delta
- -38.08%
- Verdict
- UNDERPRICED
- Comps
- 2 within 1.0 mi
Projected returns pro-forma
-3.0% appreciation · 0.0% rent growth · sell at horizon
- IRR
- -29.4%
- Equity multiple
- 0.05×
- Total profit
- $-50,356
- Equity at exit
- $28,315
- IRR
- -55.5%
- Equity multiple
- -0.54×
- Total profit
- $-81,737
- Equity at exit
- $16,419
Cash invested: $53,172 (down + closing). Projections, not guarantees.
Landlord ↔ Tenant lean methodology
- Overall (STATE)
- 15 Strongly Tenant-Friendly
- State New York
- 15 Strongly Tenant-Friendly · D+10
- County
- — inherits STATE
- City
- — inherits STATE
ZIP-level market 14450
- Rents YoY
- -0.8%
- Active inventory
- 188
- Price-to-rent
- 9.0×
Monthly cashflow live
- Estimated rent
- $1,757 medium interval (Pro) →
- Mortgage (P&I)
- −$996
- Tax from tax record
- −$218 /mo · $2,612/yr
- Insurance
- −$79
- HOA
- −$325
- Lot rent
- −$0
- Vacancy / Maint / Mgmt
- −$369
- Net cashflow
- $-230
Break-even live
Sensitivity live
| Price | -10% $-123 | -5% $-176 | +0% $-230 | +5% $-284 | +10% $-338 |
|---|---|---|---|---|---|
| Rent | -10% $-369 | -5% $-299 | +0% $-230 | +5% $-161 | +10% $-91 |
| Rate | -1.0pp $-134 | -0.5pp $-182 | base $-230 | +0.5pp $-279 | +1.0pp $-329 |
UW: 25.0% down · 7.5% · 30yr · 1.5% tax · 5.0% vac · 8.0% maint · 8.0% mgmt
Financing live
Cash to close
- Down payment
- $47,475
- Closing costs
- $5,697
- Reserves months
- —
- Total cash needed
- —
Loan-product check · same deal, 3 products live
Conventional
25% down · 7.5% · 30yr
- Down + closing
- —
- Monthly P&I
- —
- Monthly cashflow
- —
- DSCR
- —
- Eligible?
- —
Personal DTI + credit; lowest rate.
DSCR
20% down · 8.5% · 30yr
- Down + closing
- —
- Monthly P&I
- —
- Monthly cashflow
- —
- DSCR
- —
- Eligible?
- —
No personal income docs; deal must DSCR.
Hard money
10% down · 12.0% · 12mo
- Down + closing
- —
- Monthly P&I
- —
- Monthly cashflow
- —
- DSCR
- —
- Eligible?
- —
Short-term bridge; refi at stabilization.
Rent comps 4 comps
| Address | Beds | Baths | Sqft | Rent | $/sqft | DOM | Units | Dist |
|---|---|---|---|---|---|---|---|---|
| 62 Manorshire Dr Fairport, NY | 1.0–2.0 | 1.0–1.5 | 903 | $1,680 | $1.86 | 5d | 19 | 0.12mi |
| 38 Boxwood Ln Fairport, NY | 1.0–2.0 | 1.0 | 868 | $1,830 | $2.11 | 5d | 16 | 0.29mi |
| 1100 Glenmose Rd Fairport, NY | 1.0–3.0 | 1.0–2.0 | 1084 | $2,152 | $1.99 | 5d | 1 | 0.44mi |
| 370 Jefferson Ave Fairport, NY | 1.0–3.0 | 1.0 | 997 | $1,583 | $1.59 | 5d | 1 | 1.28mi |
HOA detail
- Monthly dues
- $325 · $3,900/yr
- Likely covers
- electric
Listing history 4 events
-
2026-05-02status Pending 605-char remark
-
2026-04-21$189,900 Active 605-char remark
-
2000-07-03soldstatus $49,000
-
1993-05-03soldstatus $54,000
ⓘ Source: listings_history table (triggers on properties + properties_extension) + one-shot
backfill from property_details.listing_events for pre-trigger history.
Tax reassessment forecast NY · Partial reset (capped growth)
- Current annual tax
- $2,612 · $218/mo
- Projected year-2 tax
- $2,911 · $243/mo
- Expected delta
- +$298/yr (+$25/mo · 11.4%)
ⓘ Screening estimate from a state-policy table — verify with the county assessor before closing.
Climate risk First Street
- Flood 1/10 Low FEMA zone X (unshaded) · 0% chance over 30 yrs
- Wildfire 1/10 Low
- Heat 3/10 Moderate 7 d/yr ≥95°F today · 17 d/yr by 30 yrs out
- Wind 1/10 Low
- Air quality 2/10 Low 1 unhealthy d/yr today · 1 by 30 yrs out
Nearby sold comps map
Loading sold comps map…
Walkable amenities ~0.75 mi
Loading nearby amenities…
Taxation est. · year 1
- Rental income
- $21,078
- − Mortgage interest
- −$10,637
- − Property taxes
- −$2,612
- − Insurance
- −$950
- − Repairs & maintenance
- −$1,686
- − Management
- −$1,686
- − HOA
- −$3,900
- − Depreciation
- −$5,524
- Taxable loss
- −$5,918
- Est. tax savings @ 24.0%
- +$1,420
- After-tax cash flow
- $-1,340/yr
For passive investors: Depreciation is non-cash, so a rental often shows a tax loss while cash-flowing — sheltering income. Rental losses are passive: they offset passive income freely, and up to $25,000/yr can offset ordinary (W-2) income if you actively participate and your MAGI is under $100k (phasing out to $0 by $150k); unused losses carry forward. On sale, claimed depreciation is recaptured at up to 25%, and gains may owe capital-gains tax (a 1031 exchange can defer both). Figures are a year-1 estimate at your 24.0% rate — not tax advice; consult a CPA.
Schools (NCES district)
- District
- Fairport Central School District
- NCES district ID
- 3610890
- Math proficiency
- 55% ▼ -16.00%
- Reading proficiency
- 66% ▲ 3.00%
- Median HH income
- $74,981
- Composite
- 53.84/100
- National rank
- #1409
- State rank
- #199 of 590 in NY
Livability — Fairport
- Score
- 74/100
- State rank
- #301
- US rank
- #4847
Category grades
Schools grade is shown separately in the Schools card above.
Census & demographics
- County
- Monroe County · 674,131 people
- City population
- 42,750
- Metro
- Rochester, NY
- Population (ZIP)
- 42,750
- Household income
- $109,466
- Rent vs Own
- Severe rent burden
- 843.0
Population outlook (Monroe County) Hauer SSP2
- Today (2025)
- 759,460 people
- By 2030
- 757,154 · -0.3%
- By 2040
- 740,644 · -2.5%
- By 2050
- 714,443 · -5.9%
- By 2075
- 645,883 · -15.0%
- By 2100
- 547,084 · -28.0%
Race, ethnicity, and origin ACS 2023
- Neighborhood character
- Predominantly White (89%)
- Race & ethnicity
- White 89% Two or more races 5% Hispanic / Latino 3% Asian 2% Black 2%
- Common ancestry
- Romanian 6% Lithuanian 2% Iranian 2%
- Foreign-born
- 6% · Canada, China, South Korea
- Languages at home
- 94% English-only · Other Indo-European 1% Spanish 1% Other Asian/Pacific 1%
Political lean MEDSL · Monroe
- 2024 margin
- D (+19.1) · D 59.5% · R 40.5%
- 2008→2024 swing
- +1.4pp toward D · 2008: 17.7pp · 2024: 19.1pp
- All cycles
- 2024: D+19.1 2020: D+21.0 2016: D+14.1 2012: D+17.4 2008: D+17.7
Not yet ingested
- Civics
- —
Market trends
- HPI YoY
- ▼ -189.56%
- Current HPI
- 270.7329
- Rent YoY
- ▼ -0.84%
- Metro
- Rochester, NY
- State GDP YoY
- ▲ 2.60%
- F500 in state
- 92
Industry mix (Fortune 500 HQ in NY)
| Industry | F500 HQs | Revenue |
|---|---|---|
| Financial Services | 10 | $950B |
|
||
| Consumer Goods | 9 | $162B |
|
||
| Insurance | 4 | $225B |
|
||
| Telecommunications | 2 | $144B |
|
||
| Pharmaceuticals | 2 | $112B |
|
||
| Media / Entertainment | 2 | $69B |
|
||
Price history
+288.9% since first listed5 events — show timeline
- 2026-06-08 Sold (MLS) $210,000 UNYREIS
- 2026-05-02 Pending — UNYREIS
- 2026-04-21 Listed $189,900 UNYREIS
- 2000-07-03 Sold (Public Records) $49,000 Public Records
- 1993-05-03 Sold (Public Records) $54,000 Public Records
Property tax history
+1.2%/yrLatest (2025): $2,612 · +2.1% YoY. Source: county tax records.
Cash-flow waterfall
monthlySold comps — $/sqft
last 12 mo · ≤1 miLoading sold comps…