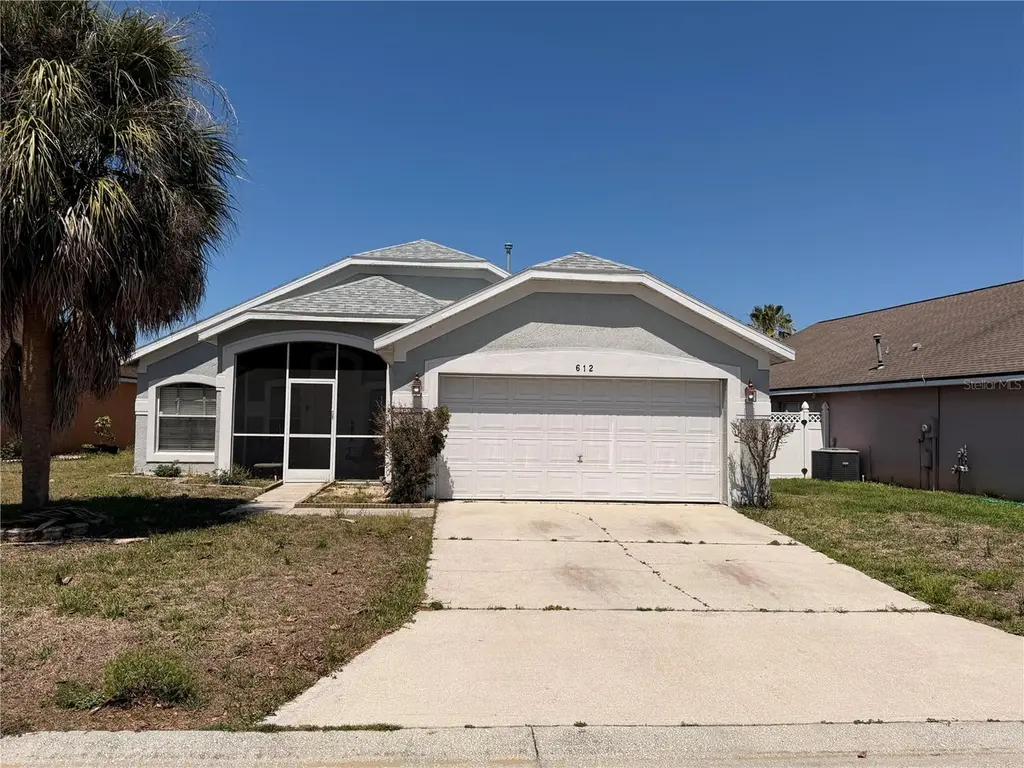
612 Prince Charles Dr · Haines City, FL
Flood risk 1/10 · Minimal
- FEMA flood zone
- X (unshaded)
- Chance of flooding over 30 yrs
- 0.0%
- Est. flood insurance / yr
- $507 – $1,088
Fire risk 5/10 · Moderate
- Est. fire insurance / yr
- $947 – $1,759
Heat risk 9/10 · Severe
- Hot days now (above 108°F)
- 7 days/yr
- Hot days in 30 yrs
- 25 days/yr
Wind risk 9/10 · Severe
- Chance of severe wind over 30 yrs
- 99.0%
Air-quality risk 1/10 · Minimal
- Unhealthy air days now
- 0 days/yr
- Unhealthy air days in 30 yrs
- 0 days/yr
Risk factors via First Street. Map © Google.
Why this score? — see what drove the D- grade
The composite is a weighted blend of 9 inputs, each scored 0–100. Each bar is that input's sub-score; the figure is the points it added to the 100-point composite (weight × sub-score).
- Cash flow +12.7/30.0
- ARV discount +7.5/15.0
- 1% rule +4.0/10.0
- DSCR +3.8/10.0
- Livability +3.7/5.0
- Schools +3.5/10.0
- Condition / age +2.5/5.0
- Rent growth +1.8/5.0
- Appreciation +0.0/10.0
$244,900
🖨 Deal sheet 📄 Offer letter ✓ Due diligence
Listing remarks MLS
Close to Disney and I4. Gated community with community pool. Home has lots of decorated features. Shows well. Split floorplan, fenced yard, nicely landscaped, high volume ceilings. Well maintained. Home shows like new.
Key facts
- Gated community
- Community pool
- Good size yard
Tags
Property features AI
Finance
- Financial info: Lease restrictions apply
- HOA & community: HOA required (Regency Place HOA) with semi-annual fee of $330 ($55/month equivalent); Community pool; Playground; Street lights; Deed restrictions; Cats and dogs allowed
Exterior
- Parking: Attached garage; 2-car garage
- Utilities: Public water; Public sewer; Cable available; Electricity connected; Fire hydrant nearby
- Home design: Single-family residence; One story; Faces east
- Construction: Stucco construction; Shingle roof; Built on slab foundation; Lot about 0.13 acres (approx. 55 x 105)
- Exterior features: Covered patio/porch; Deck; Patio; Porch; Screened area; Sidewalk; Sliding doors
Interior
- Kitchen: Dishwasher; Disposal; Microwave; Range; Refrigerator
- Bedrooms: 3 bedrooms
- Flooring: Ceramic tile; Slab foundation
- Bathrooms: 2 full bathrooms
- Heating & cooling: Central heating; Central air conditioning
- Interior features: Cathedral ceilings; Vaulted ceilings; Ceiling fans; Walk-in closets; Fireplace in the living room
- Laundry & utility: Washer included; Laundry area located in the garage
Neighborhood map
What this means for you Summary
Snapshot
- This is a 3-bed/2.0-bath single-family listed at $245k.
Deal economics
- At list price, monthly cash flow is $-25 ($-305/yr) — negative.
- To cash-flow at today's rent, offer at most $240k (1.8% below list).
- To meet the 1% rule (rent ≥ 1% of price), the offer needs to be $220k (10.3% below list).
- Recommended offer: $220k (10.3% below list) — sets the bar for 1% rule.
Location & tenants
- Location reads 74/100 on livability (#285 in FL, #4,575 nationally) — a middle-class / working-renter tenant base. Strengths: crime A+, cost of living A+, housing A+; Watch: schools D, amenities F, commute F.
- Polk (suburban): math 39% / reading 43% proficiency, ranked #62 of 73 in FL (top 85%) — families likely to look elsewhere, expect single-tenant / working-renter base with shorter leases.
- Market conditions: Rents soft (-2.7%/yr); 1382 active listings in the ZIP; 40 comparable units currently listed for rent nearby; rentals at typical pace (median 19d on market — plan ~3-4 weeks tenant-placement turnaround); solid renter incomes; 10,384 units permitted in Polk County in 2024 (1,716 in 5+ unit buildings).
- This rent runs 32% of the median local income ($81k/yr) — at the standard rent-burdened threshold; future hikes will face affordability resistance.
Forward outlook
- Local home prices are declining (-3.0%/yr); year-one equity from $2k of loan paydown is wiped out by about $7k of value loss. Plan a longer hold.
- Polk County population projected at +33% by 2050 — long-run rental-demand tailwind backs the buy-and-hold thesis.
Negotiation context
- It's been on market 26 days — a 2% lower offer ($241k) is reasonable based on typical stale-listing flexibility.
- 2 sale attempts since 21y ago with the ask held roughly flat each time — persistent listings suggest the price (not the market) is what's stuck; bring a comps-based counter.
- Current owner paid $186k; 32% above their basis — modest negotiation headroom, anchor on the comps not their cost.
Risks & watch-outs
- Climate carrying-cost: severe wind risk, 99% chance of damaging wind over 30y; moderate wildfire risk; extreme-heat days projected 7→25/yr by 2055 (HVAC capex compounding) — expect insurance premiums to compound above CPI over the hold.
Questions for the listing agent
- What do current leases actually rent for vs. the listed asking? Can we see a recent rent roll and the last 12 months of T-12 income?
- What does the HOA fee cover, when was the last increase, and are there any pending special assessments or reserve-fund shortfalls?
- Is there a deadline driving the sale (1031 exchange, divorce, estate, relocation)? That informs how much negotiation room exists.
- Schools are D-rated, which usually means shorter tenancies and higher turnover. Who's the typical renter profile here, and what's been the actual vacancy rate?
- The area grade is low — what's the realistic commute time and amenity access for the typical tenant pool here? Any planned neighborhood developments (good or bad) we should know about?
- What's the average days-on-market for RENTAL listings here right now (not sales)? A rising rental-DOM trend means longer vacancies and softer asking-rent achievability than the comps imply.
- What's the recent tenant-quality profile in this submarket — average credit score on applications, eviction rate, late-payment / NSF rate, and stable-employment percentage? A property-management company in the area should have these aggregated.
- How much new for-sale + rental construction is in the pipeline within 1–3 miles? Heavy new supply typically softens prices + rents 12–24 months out; constrained supply supports both.
Investment metrics
- 1% rule
- 0.90% ✗
- Cap rate
- 6.17%
- Cash-on-cash
- -0.44%
- DSCR
- 0.98
- GRM
- 9.3
CMA / ARV
No comps found within radius.
Projected returns pro-forma
-3.0% appreciation · 0.0% rent growth · sell at horizon
- IRR
- -20.6%
- Equity multiple
- 0.30×
- Total profit
- $-47,666
- Equity at exit
- $36,515
- IRR
- -22.9%
- Equity multiple
- 0.01×
- Total profit
- $-68,172
- Equity at exit
- $21,174
Cash invested: $68,572 (down + closing). Projections, not guarantees.
Landlord ↔ Tenant lean methodology
- Overall (STATE)
- 87 Strongly Landlord-Friendly
- State Florida
- 87 Strongly Landlord-Friendly · R+3
- County
- — inherits STATE
- City
- — inherits STATE
ZIP-level market 33837
- Home prices YoY
- -33.9%
- Rents YoY
- -2.7%
- Active inventory
- 1382
- Price-to-rent
- 9.3×
Monthly cashflow live
- Estimated rent
- $2,198 high interval (Pro) →
- Mortgage (P&I)
- −$1,284
- Tax from tax record
- −$320 /mo · $3,842/yr
- Insurance
- −$102
- HOA
- −$55
- Vacancy / Maint / Mgmt
- −$462
- Net cashflow
- $-25
Break-even live
UW: 25.0% down · 7.5% · 30yr · 1.5% tax · 5.0% vac · 8.0% maint · 8.0% mgmt
Financing live
Cash to close
- Down payment
- $61,225
- Closing costs
- $7,347
- Reserves months
- —
- Total cash needed
- —
Loan-product check · same deal, 3 products live
Conventional
25% down · 7.5% · 30yr
- Down + closing
- —
- Monthly P&I
- —
- Monthly cashflow
- —
- DSCR
- —
- Eligible?
- —
Personal DTI + credit; lowest rate.
DSCR
20% down · 8.5% · 30yr
- Down + closing
- —
- Monthly P&I
- —
- Monthly cashflow
- —
- DSCR
- —
- Eligible?
- —
No personal income docs; deal must DSCR.
Hard money
10% down · 12.0% · 12mo
- Down + closing
- —
- Monthly P&I
- —
- Monthly cashflow
- —
- DSCR
- —
- Eligible?
- —
Short-term bridge; refi at stabilization.
Rent comps 40 comps
| Address | Beds | Baths | Sqft | Rent | $/sqft | DOM | Units | Dist |
|---|---|---|---|---|---|---|---|---|
| 2312 Gifford Dr Davenport, FL | 3.0 | 2.5 | 1789 | $2,100 | $1.17 | 23d | 1 | 0.07mi |
| 2223 Tongass Bnd Davenport, FL | 3.0 | 2.5 | 1673 | $2,100 | $1.26 | 3d | 1 | 0.13mi |
| 1256 Draintree St Davenport, FL | 3.0 | 2.5 | 1692 | $2,275 | $1.34 | 23d | 1 | 0.19mi |
| 1204 Draintree St Davenport, FL | 3.0 | 3.0 | 1758 | $1,975 | $1.12 | 3d | 1 | 0.22mi |
| 1215 Draintree St Davenport, FL | 3.0 | 2.5 | 1673 | $1,900 | $1.14 | 14d | 1 | 0.23mi |
| 1419 Plank Pl Davenport, FL | 3.0 | 2.5 | 1464 | $2,300 | $1.57 | 23d | 1 | 0.23mi |
| 1532 Lumber Ave Davenport, FL | 3.0 | 2.5 | 1463 | $2,000 | $1.37 | 23d | 1 | 0.24mi |
| 2641 Olympic Ct Davenport, FL | 3.0 | 2.5 | 1673 | $2,000 | $1.20 | 23d | 1 | 0.25mi |
| 1440 Plank Pl Davenport, FL | 3.0 | 2.5 | 1789 | $2,100 | $1.17 | 23d | 1 | 0.25mi |
| 2939 Maloof Dr Davenport, FL | 3.0 | 2.5 | 1787 | $2,050 | $1.15 | 23d | 1 | 0.31mi |
| 3106 Kurtz Ter Davenport, FL | 3.0 | 2.5 | 1787 | $2,100 | $1.18 | 14d | 1 | 0.33mi |
| 3107 Kurtz Ter Davenport, FL | 3.0 | 2.5 | 1787 | $1,900 | $1.06 | 23d | 1 | 0.33mi |
| 3111 Kurtz Ter Davenport, FL | 3.0 | 2.5 | 1787 | $2,050 | $1.15 | 2d | 1 | 0.34mi |
| 5308 Rocky Hawk Run Davenport, FL | 3.0 | 2.0 | 1480 | $2,150 | $1.45 | 19d | 1 | 0.34mi |
| 3119 Kurtz Ter Davenport, FL | 3.0 | 2.5 | 1628 | $1,890 | $1.16 | 23d | 1 | 0.34mi |
| 3122 Kurtz Ter Davenport, FL | 3.0 | 2.5 | 1787 | $1,900 | $1.06 | 23d | 1 | 0.35mi |
| 3123 Kurtz Ter Davenport, FL | 3.0 | 2.5 | 1787 | $2,050 | $1.15 | 2d | 1 | 0.35mi |
| 3126 Kurtz Ter Davenport, FL | 3.0 | 2.5 | 1629 | $1,900 | $1.17 | 3d | 1 | 0.35mi |
| 544 Pinecrest Loop Davenport, FL | 3.0 | 2.0 | 1435 | $1,895 | $1.32 | 3d | 1 | 0.38mi |
| 2419 Bevel Ln Davenport, FL | 3.0 | 2.5 | 1628 | $1,850 | $1.14 | 19d | 1 | 0.39mi |
| 2419 Bevel Ln Davenport, FL | 3.0 | 2.5 | 1628 | $1,850 | $1.14 | 23d | 1 | 0.39mi |
| 338 Pinecrest Loop Davenport, FL | 3.0 | 2.0 | 1616 | $2,000 | $1.24 | 23d | 1 | 0.44mi |
| 1105 Grassy Lake Dr Davenport, FL | 1.0–3.0 | 1.0–2.0 | 987 | $2,065 | $2.09 | 3d | 103 | 0.48mi |
| 2115 Palmer Rd Davenport, FL | 2.0–3.0 | 2.5 | 1613 | $2,395 | $1.48 | 3d | 19 | 0.59mi |
| 768 Majesty Dr Davenport, FL | 4.0 | 3.0 | 1531 | $2,400 | $1.57 | 23d | 1 | 0.66mi |
| 188 Holly Village Dr Unit 188 Davenport, FL | 4.0 | 2.5 | 1620 | $2,000 | $1.23 | 3d | 1 | 0.69mi |
| 188 Holly Village Dr Unit 189 Davenport, FL | 3.0 | 2.5 | 1348 | $2,100 | $1.56 | 14d | 1 | 0.69mi |
| 636 Majesty Dr Davenport, FL | 4.0 | 2.0 | 1446 | $2,395 | $1.66 | 14d | 1 | 0.69mi |
| 211 Aylesbury Ln Davenport, FL | 4.0 | 2.0 | 1402 | $2,500 | $1.78 | 23d | 1 | 0.71mi |
| 456 Knollwood Dr Davenport, FL | 4.0 | 2.0 | 1762 | $2,500 | $1.42 | 21d | 1 | 0.72mi |
| 107 Nicholson Dr Davenport, FL | 3.0 | 2.0 | 1396 | $2,000 | $1.43 | 23d | 1 | 0.75mi |
| 309 Vizcay Way Davenport, FL | 3.0 | 2.0 | 1759 | $2,435 | $1.38 | 14d | 1 | 0.78mi |
| 3445 Huntwicke Blvd Davenport, FL | 4.0 | 2.0 | 1525 | $1,995 | $1.31 | 23d | 1 | 0.79mi |
| 3676 Rolling Ridge Bnd Davenport, FL | 4.0 | 2.0 | 1824 | $2,500 | $1.37 | 19d | 1 | 0.82mi |
| 628 Madina Cir Davenport, FL | 4.0 | 2.0 | 1309 | $1,900 | $1.45 | 14d | 1 | 0.84mi |
| 628 Madina Cir Davenport, FL | 4.0 | 2.0 | 1323 | $1,900 | $1.44 | 23d | 1 | 0.84mi |
| 129 Victory Ave Davenport, FL | 3.0 | 2.0 | 1600 | $2,350 | $1.47 | 23d | 1 | 0.86mi |
| 170 Jack Nicklaus Ln Davenport, FL | 2.0 | 2.5 | 1000 | $1,300 | $1.30 | 14d | 1 | 1.04mi |
| 3294 Partington Blvd Unit 3294 Davenport, FL | 4.0 | 2.0 | 1665 | $2,150 | $1.29 | 3d | 1 | 1.08mi |
| 3020 Base Blvd Davenport, FL | 1.0–3.0 | 1.0–2.0 | 986 | $2,636 | $2.67 | 2d | 54 | 1.12mi |
HOA detail
- Monthly dues
- $55 · $660/yr
- Likely covers
- poolsecurity
Listing history 16 events
-
2026-06-15status $244,900 Pending 26 DOM
-
2026-06-15days on market $244,900 Active 26 DOM
-
2026-06-13days on market $244,900 Active 24 DOM
-
2026-06-10days on market $244,900 Active 21 DOM
-
2026-06-09days on market $244,900 Active 20 DOM
-
2026-06-08days on market $244,900 Active 19 DOM
-
2026-06-07days on market $244,900 Active 18 DOM
-
2026-06-05days on market $244,900 Active 15 DOM
-
2026-06-03days on market $244,900 Active 14 DOM
-
2026-06-03days on market $244,900 Active 13 DOM
-
2026-06-01days on market $244,900 Active 12 DOM
-
2026-05-31days on market $244,900 Active 11 DOM
-
2026-05-20$244,900 Active
-
2005-05-11soldstatus $185,900
-
2005-04-26soldstatus $185,900 218-char remark
Show marketing remark (218 chars)
Close to Disney and I4. Gated community with community pool. Home has lots of decorated features. Shows well. Split floorplan, fenced yard, nicely landscaped, high volume ceilings. Well maintained. Home shows like new.
-
2005-03-07$190,000 218-char remark
Show marketing remark (218 chars)
Close to Disney and I4. Gated community with community pool. Home has lots of decorated features. Shows well. Split floorplan, fenced yard, nicely landscaped, high volume ceilings. Well maintained. Home shows like new.
ⓘ Source: listings_history table (triggers on properties + properties_extension) + one-shot
backfill from property_details.listing_events for pre-trigger history.
Tax reassessment forecast FL · Resets to sale price
- Current annual tax
- $3,842 · $320/mo
- Projected year-2 tax
- $3,842 · $320/mo
- Expected delta
- $0/yr ($0/mo · 0.0%)
ⓘ Screening estimate from a state-policy table — verify with the county assessor before closing.
Climate risk First Street
- Flood 1/10 Low FEMA zone X (unshaded) · 0% chance over 30 yrs
- Wildfire 5/10 Major
- Heat 9/10 Extreme 7 d/yr ≥108°F today · 25 d/yr by 30 yrs out
- Wind 9/10 Extreme 99% chance of damaging wind over 30 yrs
- Air quality 1/10 Low 0 unhealthy d/yr today · 0 by 30 yrs out
Nearby sold comps map
Loading sold comps map…
Walkable amenities ~0.75 mi
Loading nearby amenities…
Taxation est. · year 1
- Rental income
- $26,371
- − Mortgage interest
- −$13,718
- − Property taxes
- −$3,842
- − Insurance
- −$1,224
- − Repairs & maintenance
- −$2,110
- − Management
- −$2,110
- − HOA
- −$660
- − Depreciation
- −$7,124
- Taxable loss
- −$4,417
- Est. tax savings @ 24.0%
- +$1,060
- After-tax cash flow
- $755/yr
For passive investors: Depreciation is non-cash, so a rental often shows a tax loss while cash-flowing — sheltering income. Rental losses are passive: they offset passive income freely, and up to $25,000/yr can offset ordinary (W-2) income if you actively participate and your MAGI is under $100k (phasing out to $0 by $150k); unused losses carry forward. On sale, claimed depreciation is recaptured at up to 25%, and gains may owe capital-gains tax (a 1031 exchange can defer both). Figures are a year-1 estimate at your 24.0% rate — not tax advice; consult a CPA.
Schools (NCES district)
- District
- Polk
- NCES district ID
- 1201590
- Math proficiency
- 39% ▼ -11.00%
- Reading proficiency
- 43% ▼ -4.00%
- Median HH income
- $43,979
- Composite
- 34.74/100
- National rank
- #5132
- State rank
- #62 of 73 in FL
Livability — Haines City
- Score
- 74/100
- State rank
- #285
- US rank
- #4575
Category grades
Schools grade is shown separately in the Schools card above.
Census & demographics
- County
- Polk County · 740,051 people
- City population
- 51,255
- Metro
- Lakeland-Winter Haven, FL
- Population (ZIP)
- 47,389
- Household income
- $81,276
- Rent vs Own
- Severe rent burden
- 424.0
Population outlook (Polk County) Hauer SSP2
- Today (2025)
- 752,975 people
- By 2030
- 804,621 · +6.9%
- By 2040
- 906,117 · +20.3%
- By 2050
- 1,000,476 · +32.9%
- By 2075
- 1,197,520 · +59.0%
- By 2100
- 1,271,518 · +68.9%
Race, ethnicity, and origin ACS 2023
- Neighborhood character
- Diverse neighborhood (Simpson 0.68)
- Race & ethnicity
- Hispanic / Latino 42% White 36% Two or more races 16% Black 15% Asian 2%
- Hispanic origin (detail)
- Mexican 7% Puerto Rican 22% Cuban 2% Dominican 1%
- Common ancestry
- Hispanic 5% Romanian 3% Lithuanian 1%
- Foreign-born
- 18% · Canada, Jamaica
- Languages at home
- 55% English-only · Spanish 35% French/Haitian/Cajun 6% Other Indo-European 2%
Political lean MEDSL · Polk
- 2024 margin
- Strong R (+20.7) · D 39.2% · R 59.9%
- 2008→2024 swing
- -14.6pp toward R · 2008: -6.1pp · 2024: -20.7pp
- All cycles
- 2024: R+20.7 2020: R+14.4 2016: R+14.1 2012: R+6.8 2008: R+6.1
Not yet ingested
- Civics
- —
Market trends
- HPI YoY
- ▼ -131.62%
- Current HPI
- 256.8165
- Rent YoY
- ▼ -2.73%
- Metro
- Lakeland-Winter Haven, FL
- State GDP YoY
- ▲ 3.28%
- F500 in state
- 36
Industry mix (Fortune 500 HQ in FL)
| Industry | F500 HQs | Revenue |
|---|---|---|
| Industrial Technology | 2 | $29B |
|
||
| Insurance | 2 | $17B |
|
||
| Retail | 1 | $60B |
|
||
| Technology Distribution | 1 | $58B |
|
||
| Homebuilding | 1 | $35B |
|
||
| Technology Manufacturing | 1 | $35B |
|
||
Price history
+28.9% since first listed4 events — show timeline
- 2026-05-20 Listed $244,900 Stellar MLS as Distributed by MLS Grid
- 2005-05-11 Sold (Public Records) $185,900 Public Records
- 2005-04-26 Sold (MLS) $185,900 Stellar MLS as Distributed by MLS Grid
- 2005-03-07 Listed $190,000 Stellar MLS as Distributed by MLS Grid
Property tax history
+17.5%/yrLatest (2025): $3,842 · +5.6% YoY. Source: county tax records.
Cash-flow waterfall
monthlySold comps — $/sqft
last 12 mo · ≤1 miLoading sold comps…