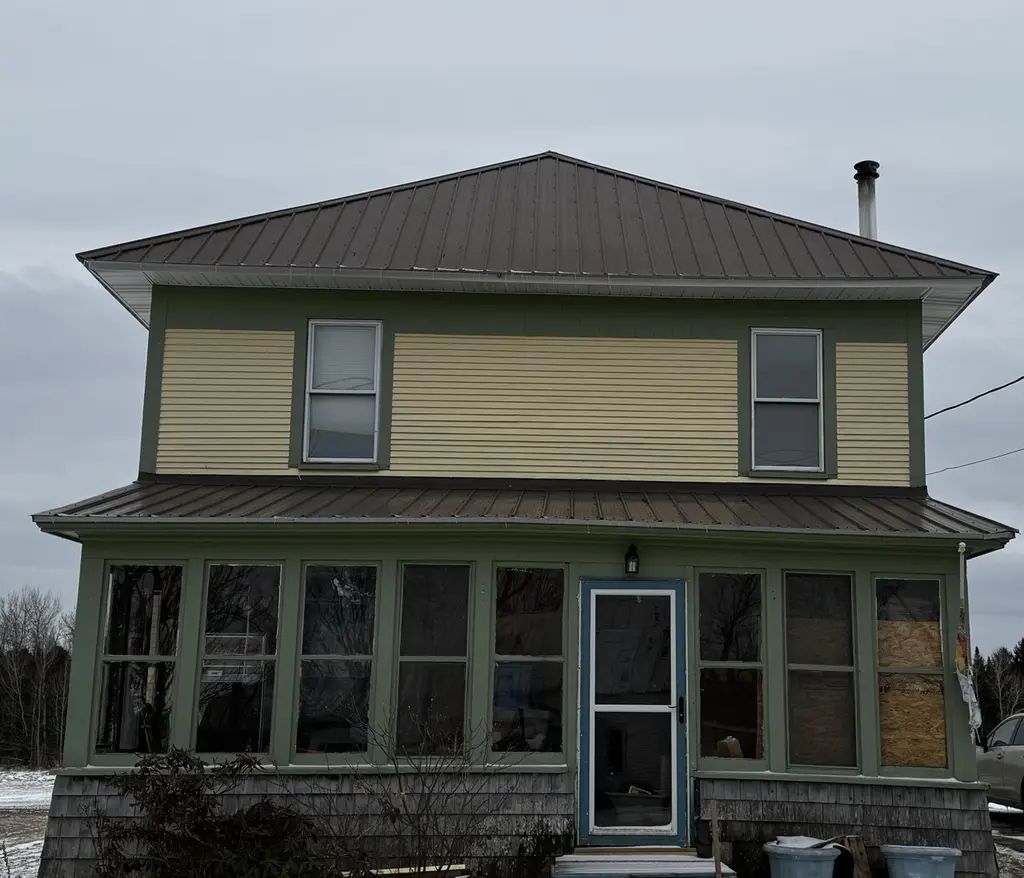
9 Church St · Lyon Mountain, NY
Flood risk 1/10 · Minimal
- FEMA flood zone
- X (unshaded)
- Chance of flooding over 30 yrs
- 0.0%
- Est. flood insurance / yr
- $473 – $860
Fire risk 1/10 · Minimal
- Est. fire insurance / yr
- $691 – $1,283
Heat risk 1/10 · Minimal
- Hot days now (above 91°F)
- 7 days/yr
- Hot days in 30 yrs
- 16 days/yr
Wind risk 1/10 · Minimal
- Chance of severe wind over 30 yrs
- —
Air-quality risk 2/10 · Minimal
- Unhealthy air days now
- 0 days/yr
- Unhealthy air days in 30 yrs
- 1 days/yr
Risk factors via First Street. Map © Google.
Why this score? — see what drove the B grade
The composite is a weighted blend of 9 inputs, each scored 0–100. Each bar is that input's sub-score; the figure is the points it added to the 100-point composite (weight × sub-score).
- Cash flow +27.0/30.0
- DSCR +9.3/10.0
- Appreciation +8.3/10.0
- 1% rule +7.6/10.0
- ARV discount +7.5/15.0
- Schools +4.1/10.0
- Rent growth +2.5/5.0
- Livability +2.5/5.0
- Condition / age +2.5/5.0
$100,000
🖨 Deal sheet (PDF) 📄 Offer letter ✓ Due diligence
Listing remarks
Charming fixer-upper home brimming with untapped potential and original character. Kitchen offers granite countertops, a classic farmhouse apron sink, white subway tile backsplash, and windows that floods the space with natural light. A newer Jotul-style wood-burning stove that provides supplemental heat and adds rustic appeal. Located on a dead end street with a playground in close proximity. Home is being SOLD AS-IS. Hot tub being sold as-is.
Key facts
- Hot tub
- Wood-burning stove
- Farmhouse apron sink
Tags
Property features AI
Exterior
- Parking: Detached garage (1 car); Driveway; Garage faces front; Open parking available
- Security: Smoke detectors; Carbon monoxide detectors
- Utilities: Private well water; Septic tank sewer; 200+ amp electric service; Electricity connected; Cable available
- Home design: Single family residence; Two stories; Fixer condition
- Construction: Vinyl and wood siding; Metal roof; Stone foundation; House built (two-level) with unfinished basement
- Exterior features: Front porch; Few trees on the lot; Paved road access; Has a view; Fuel tank(s); Additional garage structure
Interior
- Kitchen: Dishwasher; Electric oven; Refrigerator
- Flooring: Tile
- Bathrooms: One full bathroom
- Heating & cooling: Propane heating; Fireplace heating; No central air
- Interior features: Wood-frame windows; Tile flooring; Wood-burning fireplace
- Laundry & utility: Washer hookup; Electric dryer hookup
Neighborhood map
What this means for you Summary
Snapshot
- This is a 3-bed/1.0-bath single-family listed at $100k.
Deal economics
- At list price, monthly cash flow is $280 ($3k/yr) — positive.
- The deal already cash-flows at list — no discount required.
- Meets the 1% rule at list price ($1k rent vs $100k).
Location & tenants
- Location reads 49/100 on livability (#1,174 in NY) — a working-class tenant base; expect higher turnover. Strengths: crime A, cost of living B; Watch: health & safety C-, amenities F, commute F.
- Northern Adirondack Central School District (rural): math 47% / reading 49% proficiency, ranked #430 of 590 in NY (top 73%) — families likely to look elsewhere, expect single-tenant / working-renter base with shorter leases.
- Zoned schools: Northern Adirondack Elementary School (math 37% / reading 47%, grade F, #1,361 of 2,108 statewide, top 67%, 387 students, 52% FRL); Northern Adirondack Middle/High School (math 57% / reading 52%, grade C-, #912 of 1,100 statewide, top 85%, 417 students, 53% FRL).
- Market conditions: 6 active listings in the ZIP; 192 units permitted in Clinton County in 2024 (64 in 5+ unit buildings).
Forward outlook
- In year one you build about $7k of equity ($691 loan paydown + $7k appreciation (6.7% local appreciation)).
- Clinton County population projected at -16% by 2050 — secular population decline; favor cash flow + early exit over multi-decade hold.
- At projected returns (6.7% appreciation + 3.0% rent growth), your $28k cash investment doubles in ~3 years — after that, you're playing with house money.
- By year 5, paydown + projected appreciation supports a ~$33k cash-out refi (75% LTV) — recoverable capital for the next deal without selling this one.
Negotiation context
- Only 12 days on market — expect competitive offers; lowballing is unlikely to land.
- Current owner paid $20k; list at $100k implies a 400% gain — meaningful room to come down on a strong offer.
Risks & watch-outs
- Watch-outs: built in 1870 — expect roof / HVAC / electrical / plumbing capex.
Questions for the listing agent
- Built in 1870 — when were the roof, HVAC, electrical panel, plumbing, and water heater last replaced?
- Is there a deadline driving the sale (1031 exchange, divorce, estate, relocation)? That informs how much negotiation room exists.
- Schools are F-rated, which usually means shorter tenancies and higher turnover. Who's the typical renter profile here, and what's been the actual vacancy rate?
- What's the average days-on-market for RENTAL listings here right now (not sales)? A rising rental-DOM trend means longer vacancies and softer asking-rent achievability than the comps imply.
- What's the recent tenant-quality profile in this submarket — average credit score on applications, eviction rate, late-payment / NSF rate, and stable-employment percentage? A property-management company in the area should have these aggregated.
- How much new for-sale + rental construction is in the pipeline within 1–3 miles? Heavy new supply typically softens prices + rents 12–24 months out; constrained supply supports both.
Investment metrics
- 1% rule
- 1.26% ✓
- Cap rate
- 9.65%
- Cash-on-cash
- 12.00%
- DSCR
- 1.53
- GRM
- 6.6
CMA / ARV
No comps found within radius.
Projected returns pro-forma
6.66% appreciation · 3.0% rent growth · sell at horizon
- IRR
- 26.7%
- Equity multiple
- 2.81×
- Total profit
- $50,717
- Equity at exit
- $67,102
- IRR
- 24.6%
- Equity multiple
- 5.80×
- Total profit
- $134,402
- Equity at exit
- $125,525
Cash invested: $28,000 (down + closing). Projections, not guarantees.
Landlord ↔ Tenant lean methodology
- Overall (STATE)
- 15 Strongly Tenant-Friendly
- State New York
- 15 Strongly Tenant-Friendly · D+10
- County
- — inherits STATE
- City
- — inherits STATE
ZIP-level market 12934
- Home prices YoY
- 2.3%
- Active inventory
- 6
- Price-to-rent
- 6.6×
Monthly cashflow live
- Estimated rent
- $1,260 medium interval (Pro) →
- Mortgage (P&I)
- −$524
- Tax from tax record
- −$149 /mo · $1,790/yr
- Insurance
- −$42
- HOA
- −$0
- Vacancy / Maint / Mgmt
- −$265
- Net cashflow
- $280
Break-even live
Sensitivity live
| Price | -10% $337 | -5% $308 | +0% $280 | +5% $252 | +10% $223 |
|---|---|---|---|---|---|
| Rent | -10% $180 | -5% $230 | +0% $280 | +5% $330 | +10% $379 |
| Rate | -1.0pp $330 | -0.5pp $305 | base $280 | +0.5pp $254 | +1.0pp $228 |
UW: 25.0% down · 7.5% · 30yr · 1.5% tax · 5.0% vac · 8.0% maint · 8.0% mgmt
Financing live
Cash to close
- Down payment
- $25,000
- Closing costs
- $3,000
- Reserves months
- —
- Total cash needed
- —
Loan-product check · same deal, 3 products live
Conventional
25% down · 7.5% · 30yr
- Down + closing
- —
- Monthly P&I
- —
- Monthly cashflow
- —
- DSCR
- —
- Eligible?
- —
Personal DTI + credit; lowest rate.
DSCR
20% down · 8.5% · 30yr
- Down + closing
- —
- Monthly P&I
- —
- Monthly cashflow
- —
- DSCR
- —
- Eligible?
- —
No personal income docs; deal must DSCR.
Hard money
10% down · 12.0% · 12mo
- Down + closing
- —
- Monthly P&I
- —
- Monthly cashflow
- —
- DSCR
- —
- Eligible?
- —
Short-term bridge; refi at stabilization.
Listing history 9 events
-
2026-06-21statusdays on market $100,000 Pending 12 DOM
-
2026-06-18days on market $100,000 Active 10 DOM
-
2026-06-17days on market $100,000 Active 9 DOM
-
2026-06-16days on market $100,000 Active 8 DOM
-
2026-06-15days on market $100,000 Active 7 DOM
-
2026-06-13days on market $100,000 Active 5 DOM
-
2026-06-12days on market $100,000 Active 4 DOM
-
2026-06-09remarks 448-char remark
-
2026-06-09$100,000 Active 1 DOM
ⓘ Source: listings_history table (triggers on properties + properties_extension) + one-shot
backfill from property_details.listing_events for pre-trigger history.
Tax reassessment forecast NY · Partial reset (capped growth)
- Current annual tax
- $1,790 · $149/mo
- Projected year-2 tax
- $1,790 · $149/mo
- Expected delta
- $0/yr ($0/mo · 0.0%)
ⓘ Screening estimate from a state-policy table — verify with the county assessor before closing.
Climate risk First Street
- Flood 1/10 Low FEMA zone X (unshaded) · 0% chance over 30 yrs
- Wildfire 1/10 Low
- Heat 1/10 Low 7 d/yr ≥91°F today · 16 d/yr by 30 yrs out
- Wind 1/10 Low
- Air quality 2/10 Low 0 unhealthy d/yr today · 1 by 30 yrs out
Nearby sold comps map
Loading sold comps map…
Walkable amenities ~0.75 mi
Loading nearby amenities…
Taxation est. · year 1
- Rental income
- $15,117
- − Mortgage interest
- −$5,602
- − Property taxes
- −$1,790
- − Insurance
- −$500
- − Repairs & maintenance
- −$1,209
- − Management
- −$1,209
- − Depreciation
- −$2,909
- Taxable income
- $1,897
- Est. tax owed @ 24.0%
- −$455
- After-tax cash flow
- $2,904/yr
For passive investors: Depreciation is non-cash, so a rental often shows a tax loss while cash-flowing — sheltering income. Rental losses are passive: they offset passive income freely, and up to $25,000/yr can offset ordinary (W-2) income if you actively participate and your MAGI is under $100k (phasing out to $0 by $150k); unused losses carry forward. On sale, claimed depreciation is recaptured at up to 25%, and gains may owe capital-gains tax (a 1031 exchange can defer both). Figures are a year-1 estimate at your 24.0% rate — not tax advice; consult a CPA.
Schools (NCES district)
- District
- Northern Adirondack Central School District
- NCES district ID
- 3621260
- Math proficiency
- 47% ▬ 0.00%
- Reading proficiency
- 49% ▲ 2.00%
- Median HH income
- $44,656
- Composite
- 40.62/100
- National rank
- #3689
- State rank
- #430 of 590 in NY
Livability — Lyon Mountain
- Score
- 49/100
- State rank
- #1174
- US rank
- #25808
Category grades
Schools grade is shown separately in the Schools card above.
Census & demographics
- City population
- 226
- Population (ZIP)
- 1,147
Population outlook (Clinton County) Hauer SSP2
- Today (2025)
- 78,791 people
- By 2030
- 76,848 · -2.5%
- By 2040
- 71,579 · -9.2%
- By 2050
- 66,471 · -15.6%
- By 2075
- 57,361 · -27.2%
- By 2100
- 47,232 · -40.1%
Race, ethnicity, and origin ACS 2023
- Neighborhood character
- Predominantly White (92%)
- Race & ethnicity
- White 92% Black 3% Hispanic / Latino 3% Two or more races 2%
- Common ancestry
- Lithuanian 30% Slovak 3% Romanian 2%
- Foreign-born
- 0% · Canada
Political lean MEDSL · Clinton
- 2024 margin
- Toss-up / Even · D 48.9% · R 51.1%
- 2008→2024 swing
- -25.1pp toward R · 2008: 22.9pp · 2024: -2.2pp
- All cycles
- 2024: R+2.2 2020: D+5.2 2016: D+0.9 2012: D+25.6 2008: D+22.9
Not yet ingested
- Civics
- —
Market trends
- HPI YoY
- ▲ 6.66%
- Current HPI
- 296.8781
- Rent YoY
- —
- Metro
- —
- State GDP YoY
- ▲ 2.60%
- F500 in state
- 92
Industry mix (Fortune 500 HQ in NY)
| Industry | F500 HQs | Revenue |
|---|---|---|
| Financial Services | 10 | $950B |
|
||
| Consumer Goods | 9 | $162B |
|
||
| Insurance | 4 | $225B |
|
||
| Telecommunications | 2 | $144B |
|
||
| Pharmaceuticals | 2 | $112B |
|
||
| Media / Entertainment | 2 | $69B |
|
||
Price history
+400.0% since first listed2 events — show timeline
- 2026-06-05 Listed $100,000 ACVMLS
- 2002-09-18 Sold (Public Records) $20,000 Public Records
Property tax history
+7.1%/yrLatest (2025): $1,790 · +5.4% YoY. Source: county tax records.
Cash-flow waterfall
monthlySold comps — $/sqft
last 12 mo · ≤1 miLoading sold comps…