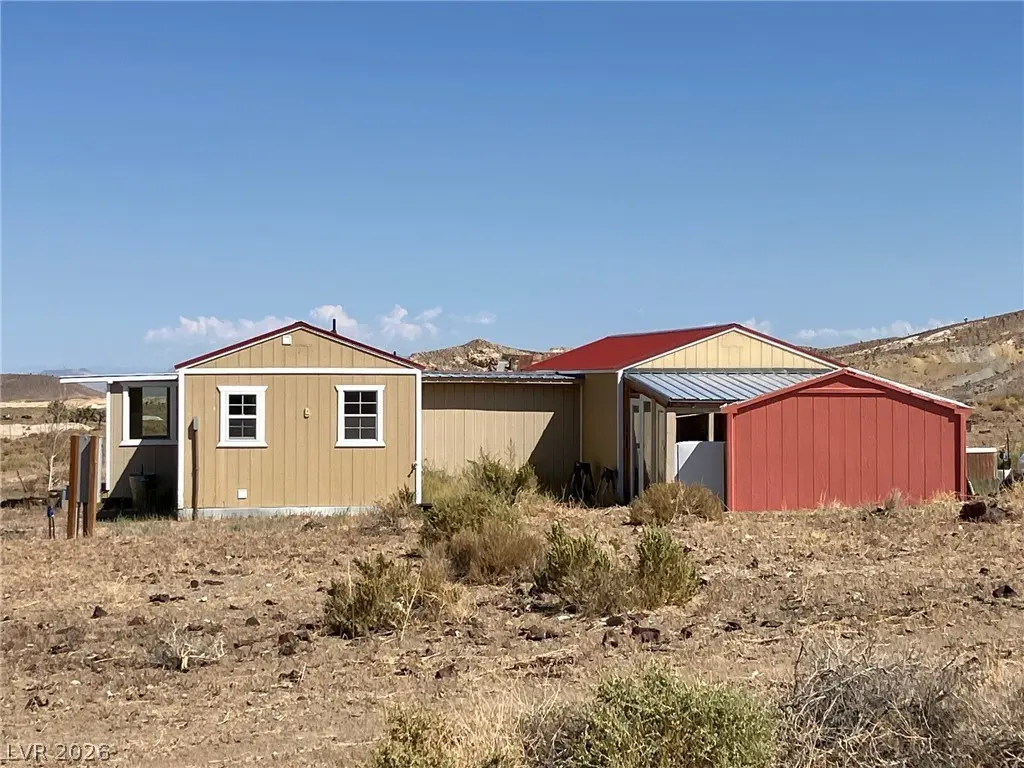
1208 Broadway · Goldfield, NV
Flood risk 1/10 · Minimal
- FEMA flood zone
- —
- Chance of flooding over 30 yrs
- 0.0%
- Est. flood insurance / yr
- —
Fire risk 1/10 · Minimal
- Est. fire insurance / yr
- $490 – $910
Heat risk 5/10 · Moderate
- Hot days now (above 90°F)
- 7 days/yr
- Hot days in 30 yrs
- 22 days/yr
Wind risk 1/10 · Minimal
- Chance of severe wind over 30 yrs
- —
Air-quality risk 1/10 · Minimal
- Unhealthy air days now
- 0 days/yr
- Unhealthy air days in 30 yrs
- 0 days/yr
Risk factors via First Street. Map © Google.
Why this score? — see what drove the D grade
The composite is a weighted blend of 9 inputs, each scored 0–100. Each bar is that input's sub-score; the figure is the points it added to the 100-point composite (weight × sub-score).
- ARV discount +15.0/15.0
- Cash flow +8.0/30.0
- Appreciation +5.0/10.0
- Livability +2.9/5.0
- Rent growth +2.5/5.0
- Condition / age +2.5/5.0
- 1% rule +2.4/10.0
- DSCR +2.1/10.0
- Schools +2.0/10.0
$119,700
🖨 Deal sheet (PDF) 📄 Offer letter ✓ Due diligence
Listing remarks MLS
INCOME OPPORTUNITY in this unique one of a kind home! Living quarters can be sectioned off into two separate living spaces, both with a fully functional kitchen and bathroom! RV Hookup.
Key facts
- 0.23 acre lot
- Built 1999
- Listed 66 days
Tags
Neighborhood map
What this means for you Summary
Snapshot
- This is a 1-bed/2.0-bath single-family listed at $120k.
Deal economics
- At list price, monthly cash flow is $-121 ($-1k/yr) — negative.
- To cash-flow at today's rent, offer at most $98k (17.8% below list).
- To meet the 1% rule (rent ≥ 1% of price), the offer needs to be $88k (26.3% below list).
- Recommended offer: $88k (26.3% below list) — sets the bar for 1% rule.
Location & tenants
- Location reads 58/100 on livability (#86 in NV) — a working-class tenant base; expect higher turnover. Strengths: cost of living A+, housing A; Watch: schools C-, crime F, amenities F.
- Esmeralda County School District (rural): math 11% / reading 30% proficiency, ranked #19 of 19 in NV (top 100%) — low school quality limits family demand, transient renter base, plan for 1-2y turnover.
- Market conditions: 19 active listings in the ZIP.
Forward outlook
- In year one you build about $4k of equity ($828 loan paydown + $4k appreciation (3.0% local appreciation)).
- Esmeralda County population projected at +46% by 2050 — long-run rental-demand tailwind backs the buy-and-hold thesis.
- By year 8, paydown + projected appreciation supports a ~$33k cash-out refi (75% LTV) — recoverable capital for the next deal without selling this one.
Negotiation context
- It's been on market 66 days — a 6% lower offer ($113k) is reasonable based on typical stale-listing flexibility.
- 2 sale attempts; this cycle's ask has dropped $20k (14%) from the opening price — seller is motivated, your offer sets the floor, not the list.
Risks & watch-outs
- Climate carrying-cost: extreme-heat days projected 7→22/yr by 2055 (HVAC capex compounding) — expect insurance premiums to compound above CPI over the hold.
Questions for the listing agent
- What do current leases actually rent for vs. the listed asking? Can we see a recent rent roll and the last 12 months of T-12 income?
- It's been on market 66 days. Have you received any prior offers? Is the seller open to a 26% concession, seller financing, or rate buy-down credit?
- Why hasn't it sold? Are there any deal-killer items the seller is aware of (foundation, flood, title, zoning, code violations)?
- Is there a deadline driving the sale (1031 exchange, divorce, estate, relocation)? That informs how much negotiation room exists.
- Crime grade is F in this area — have there been break-ins, vandalism, or insurance claims at this property in the last 3 years? What carrier currently insures it and at what premium?
- The area grade is low — what's the realistic commute time and amenity access for the typical tenant pool here? Any planned neighborhood developments (good or bad) we should know about?
- What's the average days-on-market for RENTAL listings here right now (not sales)? A rising rental-DOM trend means longer vacancies and softer asking-rent achievability than the comps imply.
- What's the recent tenant-quality profile in this submarket — average credit score on applications, eviction rate, late-payment / NSF rate, and stable-employment percentage? A property-management company in the area should have these aggregated.
- How much new for-sale + rental construction is in the pipeline within 1–3 miles? Heavy new supply typically softens prices + rents 12–24 months out; constrained supply supports both.
Investment metrics
- 1% rule
- 0.74% ✗
- Cap rate
- 5.08%
- Cash-on-cash
- -4.32%
- DSCR
- 0.81
- GRM
- 11.3
CMA / ARV
- ARV (median comp)
- $146,097
- List price
- $119,700
- Delta
- -18.07%
- Verdict
- UNDERPRICED
- Comps
- 1 within 2.0 mi
Projected returns pro-forma
3.0% appreciation · 3.0% rent growth · sell at horizon
- IRR
- 3.5%
- Equity multiple
- 1.20×
- Total profit
- $6,738
- Equity at exit
- $53,822
- IRR
- 6.8%
- Equity multiple
- 2.04×
- Total profit
- $34,792
- Equity at exit
- $82,947
Cash invested: $33,516 (down + closing). Projections, not guarantees.
Landlord ↔ Tenant lean methodology
- Overall (STATE)
- 71 Landlord-Friendly
- State Nevada
- 71 Landlord-Friendly · R+1
- County
- — inherits STATE
- City
- — inherits STATE
ZIP-level market 89013
- Active inventory
- 19
- Price-to-rent
- 11.3×
Monthly cashflow live
- Estimated rent
- $882 medium interval (Pro) →
- Mortgage (P&I)
- −$628
- Tax from tax record
- −$140 /mo · $1,681/yr
- Insurance
- −$50
- HOA
- −$0
- Vacancy / Maint / Mgmt
- −$185
- Net cashflow
- $-121
Break-even live
Sensitivity live
| Price | -10% $-53 | -5% $-87 | +0% $-121 | +5% $-155 | +10% $-188 |
|---|---|---|---|---|---|
| Rent | -10% $-190 | -5% $-156 | +0% $-121 | +5% $-86 | +10% $-51 |
| Rate | -1.0pp $-60 | -0.5pp $-90 | base $-121 | +0.5pp $-152 | +1.0pp $-183 |
UW: 25.0% down · 7.5% · 30yr · 1.5% tax · 5.0% vac · 8.0% maint · 8.0% mgmt
Financing live
Cash to close
- Down payment
- $29,925
- Closing costs
- $3,591
- Reserves months
- —
- Total cash needed
- —
Loan-product check · same deal, 3 products live
Conventional
25% down · 7.5% · 30yr
- Down + closing
- —
- Monthly P&I
- —
- Monthly cashflow
- —
- DSCR
- —
- Eligible?
- —
Personal DTI + credit; lowest rate.
DSCR
20% down · 8.5% · 30yr
- Down + closing
- —
- Monthly P&I
- —
- Monthly cashflow
- —
- DSCR
- —
- Eligible?
- —
No personal income docs; deal must DSCR.
Hard money
10% down · 12.0% · 12mo
- Down + closing
- —
- Monthly P&I
- —
- Monthly cashflow
- —
- DSCR
- —
- Eligible?
- —
Short-term bridge; refi at stabilization.
Listing history 20 events
-
2026-06-21days on market $119,700 Active 66 DOM
-
2026-06-18days on market $119,700 Active 64 DOM
-
2026-06-17days on market $119,700 Active 63 DOM
-
2026-06-16days on market $119,700 Active 62 DOM
-
2026-06-15days on market $119,700 Active 61 DOM
-
2026-06-13days on market $119,700 Active 59 DOM
-
2026-06-12days on market $119,700 Active 58 DOM
-
2026-06-09days on market $119,700 Active 55 DOM
-
2026-06-08days on market $119,700 Active 54 DOM
-
2026-06-07days on market $119,700 Active 53 DOM
-
2026-06-07days on market $119,700 Active 52 DOM
-
2026-06-04days on market $119,700 Active 49 DOM
-
2026-06-02days on market $119,700 Active 48 DOM
-
2026-06-01days on market $119,700 Active 47 DOM
-
2026-05-31days on market $119,700 Active 46 DOM
-
2026-05-16price $119,700 185-char remark
Show marketing remark (185 chars)
INCOME OPPORTUNITY in this unique one of a kind home! Living quarters can be sectioned off into two separate living spaces, both with a fully functional kitchen and bathroom! RV Hookup.
-
2026-04-15$139,700 Active 185-char remark
Show marketing remark (185 chars)
INCOME OPPORTUNITY in this unique one of a kind home! Living quarters can be sectioned off into two separate living spaces, both with a fully functional kitchen and bathroom! RV Hookup.
-
2026-03-31historical
-
2025-09-23price $139,700
-
2025-03-21$145,000 Active
ⓘ Source: listings_history table (triggers on properties + properties_extension) + one-shot
backfill from property_details.listing_events for pre-trigger history.
Tax reassessment forecast NV · Resets to sale price
- Current annual tax
- $1,681 · $140/mo
- Projected year-2 tax
- $1,681 · $140/mo
- Expected delta
- $0/yr ($0/mo · 0.0%)
ⓘ Screening estimate from a state-policy table — verify with the county assessor before closing.
Climate risk First Street
- Flood 1/10 Low 0% chance over 30 yrs
- Wildfire 1/10 Low
- Heat 5/10 Major 7 d/yr ≥90°F today · 22 d/yr by 30 yrs out
- Wind 1/10 Low
- Air quality 1/10 Low 0 unhealthy d/yr today · 0 by 30 yrs out
Nearby sold comps map
Loading sold comps map…
Walkable amenities ~0.75 mi
Loading nearby amenities…
Taxation est. · year 1
- Rental income
- $10,586
- − Mortgage interest
- −$6,705
- − Property taxes
- −$1,681
- − Insurance
- −$598
- − Repairs & maintenance
- −$847
- − Management
- −$847
- − Depreciation
- −$3,482
- Taxable loss
- −$3,574
- Est. tax savings @ 24.0%
- +$858
- After-tax cash flow
- $-591/yr
For passive investors: Depreciation is non-cash, so a rental often shows a tax loss while cash-flowing — sheltering income. Rental losses are passive: they offset passive income freely, and up to $25,000/yr can offset ordinary (W-2) income if you actively participate and your MAGI is under $100k (phasing out to $0 by $150k); unused losses carry forward. On sale, claimed depreciation is recaptured at up to 25%, and gains may owe capital-gains tax (a 1031 exchange can defer both). Figures are a year-1 estimate at your 24.0% rate — not tax advice; consult a CPA.
Schools (NCES district)
- District
- Esmeralda County School District
- NCES district ID
- 3200150
- Math proficiency
- 11% ▼ -9.00%
- Reading proficiency
- 30% ▬ 0.00%
- Median HH income
- $37,789
- Composite
- 20.35/100
- National rank
- #13807
- State rank
- #19 of 19 in NV
Livability — Goldfield
- Score
- 58/100
- State rank
- #86
- US rank
- #21242
Category grades
Schools grade is shown separately in the Schools card above.
Census & demographics
- Census place
- Goldfield, NV
- Population (ZIP)
- 234
Population outlook (Esmeralda County) Hauer SSP2
- Today (2025)
- 847 people
- By 2030
- 887 · +4.7%
- By 2040
- 1,050 · +24.0%
- By 2050
- 1,239 · +46.3%
- By 2075
- 1,625 · +91.9%
- By 2100
- 1,845 · +117.8%
Race, ethnicity, and origin ACS 2023
- Neighborhood character
- Diverse neighborhood (Simpson 0.65)
- Race & ethnicity
- White 57% Hispanic / Latino 17% Asian 6% Two or more races 5% Native American 3% Black 1%
- Hispanic origin (detail)
- Cuban 4%
- Common ancestry
- Lithuanian 7% Slovak 5% Serbian 3%
- Foreign-born
- 24% · Canada
- Languages at home
- 90% English-only · Tagalog/Filipino 6% Spanish 4%
Political lean MEDSL · Esmeralda
- 2024 margin
- Solid R (+65.7) · D 15.8% · R 81.6% · Other 2.6%
- 2008→2024 swing
- -19.1pp toward R · 2008: -46.6pp · 2024: -65.7pp
- All cycles
- 2024: R+65.7 2020: R+66.9 2016: R+62.4 2012: R+51.7 2008: R+46.6
Not yet ingested
- Civics
- —
Market trends
- HPI YoY
- —
- Current HPI
- —
- Rent YoY
- —
- Metro
- —
- State GDP YoY
- ▲ 3.08%
- F500 in state
- 6
Industry mix (Fortune 500 HQ in NV)
| Industry | F500 HQs | Revenue |
|---|---|---|
| Hotels / Casinos | 3 | $36B |
|
||
Price history
-17.4% since first listed5 events — show timeline
- 2026-05-16 Price Changed $119,700 GLVAR
- 2026-04-15 Listed $139,700 GLVAR
- 2026-03-31 Listing Removed — GLVAR
- 2025-09-23 Price Changed $139,700 GLVAR
- 2025-03-21 Listed $145,000 GLVAR
Property tax history
+25.0%/yrLatest (2025): $1,681 · +195.1% YoY. Source: county tax records.
Cash-flow waterfall
monthlySold comps — $/sqft
last 12 mo · ≤1 miLoading sold comps…