 6-Plex
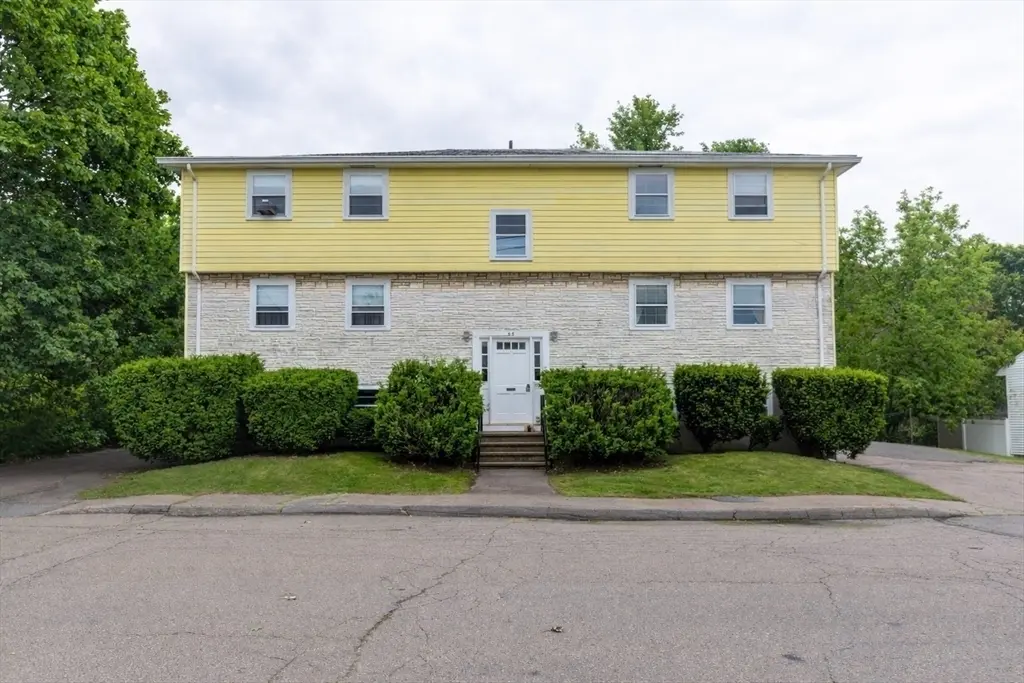
51 Stoughton St · Quincy, MA
Flood risk 10/10 · Severe
- FEMA flood zone
- AE
- Chance of flooding over 30 yrs
- 0.99%
- Est. flood insurance / yr
- $2,026 – $9,024
Fire risk 1/10 · Minimal
- Est. fire insurance / yr
- $915 – $1,699
Heat risk 5/10 · Moderate
- Hot days now (above 95°F)
- 7 days/yr
- Hot days in 30 yrs
- 15 days/yr
Wind risk 6/10 · Moderate
- Chance of severe wind over 30 yrs
- 77.0%
Air-quality risk 3/10 · Minor
- Unhealthy air days now
- 3 days/yr
- Unhealthy air days in 30 yrs
- 3 days/yr
Risk factors via First Street. Map © Google.
Why this score? — see what drove the C- grade
The composite is a weighted blend of 9 inputs, each scored 0–100. Each bar is that input's sub-score; the figure is the points it added to the 100-point composite (weight × sub-score).
- Cash flow +25.9/30.0
- DSCR +8.7/10.0
- 1% rule +5.9/10.0
- Livability +4.0/5.0
- Schools +3.9/10.0
- Rent growth +3.2/5.0
- Condition / age +2.5/5.0
- ARV discount +0.0/15.0
- Appreciation +0.0/10.0
$1,900,000
🖨 Deal sheet 📄 Offer letter ✓ Due diligence
Multi-family units
County records classify this as Multi-Family (5+ Unit). Listing-text estimate: 6 units. confirmed
5+ unit building — per-unit beds/baths from public records are typically unavailable; the breakdown below (if shown) is an estimate from the listing text.
Listing remarks MLS
Reintroduced at an adjusted price, 51 Stoughton Street presents a compelling opportunity to acquire a well-maintained 6-unit multifamily property in the heart of Houghs Neck. Located on a quiet residential street, this asset offers immediate rental income with meaningful long-term upside, appealing to both investors and owner-occupants. The solidly built property features six spacious units with a desirable mix of one- and two-bedroom layouts. Each apartment offers strong natural light and functional floor plans, with several units updated with modern finishes. Additional value-add potential remains through future improvements and rent optimization. The sale includes two additional adjacent lots, adding flexibility and long-term optionality. This is an excellent opportunity to acquire a cash-flowing asset at a repositioned price point, well suited for portfolio expansion, long-term hold strategies, or 1031 exchange consideration. A strong combination of income, location, and upside.
Key facts
- Multifamily property
- Natural light
- Spacious units
Tags
Neighborhood map
What this means for you Summary
Snapshot
- This is a 6 × 10-bed/6.0-bath units multifamily listed at $1.90M.
Deal economics
- At list price, monthly cash flow is $4k ($51k/yr) — positive. Per door: $704/mo.
- The deal already cash-flows at list — no discount required.
- Meets the 1% rule at list price ($21k rent vs $1.90M).
- Recommended offer: $1.67M (12.0% below list) — sets the bar for market timing.
- Cap rate 9.3% vs local median 2.4% in Quincy — top-decile yield for the area; either an underpriced asset or a hidden risk that comps aren't pricing in. Stress-test before assuming the spread holds.
Location & tenants
- Location reads 81/100 on livability (#31 in MA, #1,460 nationally) — a professional / high-income tenant draw. Strengths: amenities A+, commute A+, employment A+; Watch: cost of living F.
- Quincy (suburban): math 39% / reading 49% proficiency, ranked #168 of 302 in MA (top 56%) — families likely to look elsewhere, expect single-tenant / working-renter base with shorter leases.
- Market conditions: Rents rising (+2.7%/yr); 109 active listings in the ZIP; solid renter incomes; 958 units permitted in Norfolk County in 2024 (305 in 5+ unit buildings).
- At $20,798/mo this rent would consume 259% of the median local household income ($96k/yr) (locally 3560% of renters already pay >50% of income on rent) — very limited rent-growth headroom before tenants either downsize or default.
Forward outlook
- Local home prices are declining (-3.0%/yr); year-one equity from $13k of loan paydown is wiped out by about $57k of value loss. Plan a longer hold.
- Norfolk County population projected at +10% by 2050 — modest demand growth; plan on rents tracking national, not racing it.
Negotiation context
- It's been on market 155 days — a 12% lower offer ($1.67M) is reasonable based on typical stale-listing flexibility.
Risks & watch-outs
- Watch-outs: flood insurance adds $460/mo.
- Climate carrying-cost: in FEMA flood zone AE (mandatory federal flood insurance); major wind risk, 77% chance of damaging wind over 30y; extreme-heat days projected 7→15/yr by 2055 (HVAC capex compounding) — expect insurance premiums to compound above CPI over the hold.
Questions for the listing agent
- It's been on market 155 days. Have you received any prior offers? Is the seller open to a 12% concession, seller financing, or rate buy-down credit?
- Can we see the unit-by-unit rent roll, current vacancy, and any below-market leases? What's the average tenancy length?
- What capital expenditures (roof, boiler, parking lot, exteriors) have been made in the last 5 years, and what's planned in the next 2?
- What's the actual annual flood-insurance premium (NFIP or private), and is the property in a SFHA with mandatory coverage?
- Why hasn't it sold? Are there any deal-killer items the seller is aware of (foundation, flood, title, zoning, code violations)?
- Is there a deadline driving the sale (1031 exchange, divorce, estate, relocation)? That informs how much negotiation room exists.
- Schools are A-rated — typically a magnet for longer-tenancy family renters. What's the average tenant stay here, and is there a school-zone premium baked into asking?
- What's the average days-on-market for RENTAL listings here right now (not sales)? A rising rental-DOM trend means longer vacancies and softer asking-rent achievability than the comps imply.
- What's the recent tenant-quality profile in this submarket — average credit score on applications, eviction rate, late-payment / NSF rate, and stable-employment percentage? A property-management company in the area should have these aggregated.
- How much new apartment / multifamily construction is in the pipeline within 1–3 miles? Heavy new supply (>2% of stock underway) typically softens rents 12–24 months out; light construction supports rent growth.
Investment metrics
- 1% rule
- 1.09% ✓
- Cap rate
- 9.25%
- Cash-on-cash
- 10.57%
- DSCR
- 1.47
- GRM
- 7.6
CMA / ARV
- ARV (median comp)
- $1,296,613
- List price
- $1,900,000
- Delta
- 46.54%
- Verdict
- OVERPRICED
- Comps
- 5 within 2.0 mi
Projected returns pro-forma
-3.0% appreciation · 2.72% rent growth · sell at horizon
- IRR
- -2.2%
- Equity multiple
- 0.92×
- Total profit
- $-44,791
- Equity at exit
- $283,296
- IRR
- 7.1%
- Equity multiple
- 1.53×
- Total profit
- $282,742
- Equity at exit
- $164,277
Cash invested: $532,000 (down + closing). Projections, not guarantees.
Landlord ↔ Tenant lean methodology
- Overall (STATE)
- 20 Strongly Tenant-Friendly
- State Massachusetts
- 20 Strongly Tenant-Friendly · D+15
- County
- — inherits STATE
- City
- — inherits STATE
ZIP-level market 02169
- Rents YoY
- 2.7%
- Active inventory
- 109
- Price-to-rent
- 45.7×
Monthly cashflow live
- Estimated rent
- $20,798 medium interval (Pro) →
- Mortgage (P&I)
- −$9,964
- Tax from tax record
- −$988 /mo · $11,856/yr
- Insurance
- −$792
- Flood insurance flood zone
- −$460 /mo · $5,525/yr
- HOA
- −$0
- Vacancy / Maint / Mgmt
- −$4,368
- Net cashflow
- $4,227
Break-even live
6-unit breakdown (identical units grouped — click to expand)
| Units | Beds | Baths | Est. rent |
|---|---|---|---|
| 6× units | 10 | 6 | $20,796 |
| #1 | 10 | 6 | $3,466 |
| #2 | 10 | 6 | $3,466 |
| #3 | 10 | 6 | $3,466 |
| #4 | 10 | 6 | $3,466 |
| #5 | 10 | 6 | $3,466 |
| #6 | 10 | 6 | $3,466 |
| Total (6 units) | $20,798 | ||
UW: 25.0% down · 7.5% · 30yr · 1.5% tax · 5.0% vac · 8.0% maint · 8.0% mgmt
Financing live
Cash to close
- Down payment
- $475,000
- Closing costs
- $57,000
- Reserves months
- —
- Total cash needed
- —
Loan-product check · same deal, 3 products live
Conventional
25% down · 7.5% · 30yr
- Down + closing
- —
- Monthly P&I
- —
- Monthly cashflow
- —
- DSCR
- —
- Eligible?
- —
Personal DTI + credit; lowest rate.
DSCR
20% down · 8.5% · 30yr
- Down + closing
- —
- Monthly P&I
- —
- Monthly cashflow
- —
- DSCR
- —
- Eligible?
- —
No personal income docs; deal must DSCR.
Hard money
10% down · 12.0% · 12mo
- Down + closing
- —
- Monthly P&I
- —
- Monthly cashflow
- —
- DSCR
- —
- Eligible?
- —
Short-term bridge; refi at stabilization.
Listing history 14 events
-
2026-06-18days on market $1,900,000 Active 155 DOM
-
2026-06-17days on market $1,900,000 Active 154 DOM
-
2026-06-16days on market $1,900,000 Active 153 DOM
-
2026-06-15days on market $1,900,000 Active 152 DOM
-
2026-06-13days on market $1,900,000 Active 150 DOM
-
2026-06-09days on market $1,900,000 Active 146 DOM
-
2026-06-08days on market $1,900,000 Active 145 DOM
-
2026-06-07days on market $1,900,000 Active 144 DOM
-
2026-06-04days on market $1,900,000 Active 141 DOM
-
2026-06-03days on market $1,900,000 Active 140 DOM
-
2026-06-02days on market $1,900,000 Active 139 DOM
-
2026-06-01days on market $1,900,000 Active 138 DOM
-
2026-05-31days on market $1,900,000 Active 137 DOM
-
2026-01-14$1,900,000 New 997-char remark
Show marketing remark (997 chars)
Reintroduced at an adjusted price, 51 Stoughton Street presents a compelling opportunity to acquire a well-maintained 6-unit multifamily property in the heart of Houghs Neck. Located on a quiet residential street, this asset offers immediate rental income with meaningful long-term upside, appealing to both investors and owner-occupants. The solidly built property features six spacious units with a desirable mix of one- and two-bedroom layouts. Each apartment offers strong natural light and functional floor plans, with several units updated with modern finishes. Additional value-add potential remains through future improvements and rent optimization. The sale includes two additional adjacent lots, adding flexibility and long-term optionality. This is an excellent opportunity to acquire a cash-flowing asset at a repositioned price point, well suited for portfolio expansion, long-term hold strategies, or 1031 exchange consideration. A strong combination of income, location, and upside.
ⓘ Source: listings_history table (triggers on properties + properties_extension) + one-shot
backfill from property_details.listing_events for pre-trigger history.
Tax reassessment forecast MA · Partial reset (capped growth)
- Current annual tax
- $11,856 · $988/mo
- Projected year-2 tax
- $17,613 · $1,468/mo
- Expected delta
- +$5,757/yr (+$480/mo · 48.6%)
ⓘ Screening estimate from a state-policy table — verify with the county assessor before closing.
Climate risk First Street
- Flood 10/10 Extreme FEMA zone AE · 99% chance over 30 yrs
- Wildfire 1/10 Low
- Heat 5/10 Major 7 d/yr ≥95°F today · 15 d/yr by 30 yrs out
- Wind 6/10 Major 77% chance of damaging wind over 30 yrs
- Air quality 3/10 Moderate 3 unhealthy d/yr today · 3 by 30 yrs out
Nearby sold comps map
Loading sold comps map…
Walkable amenities ~0.75 mi
Loading nearby amenities…
Taxation est. · year 1
- Rental income
- $249,576
- − Mortgage interest
- −$106,430
- − Property taxes
- −$11,856
- − Insurance
- −$15,025
- − Repairs & maintenance
- −$19,966
- − Management
- −$19,966
- − Depreciation
- −$55,273
- Taxable income
- $21,061
- Est. tax owed @ 24.0%
- −$5,055
- After-tax cash flow
- $45,664/yr
For passive investors: Depreciation is non-cash, so a rental often shows a tax loss while cash-flowing — sheltering income. Rental losses are passive: they offset passive income freely, and up to $25,000/yr can offset ordinary (W-2) income if you actively participate and your MAGI is under $100k (phasing out to $0 by $150k); unused losses carry forward. On sale, claimed depreciation is recaptured at up to 25%, and gains may owe capital-gains tax (a 1031 exchange can defer both). Figures are a year-1 estimate at your 24.0% rate — not tax advice; consult a CPA.
Schools (NCES district)
- District
- Quincy
- NCES district ID
- 2509870
- Math proficiency
- 39% ▼ -15.00%
- Reading proficiency
- 49% ▼ -12.00%
- Median HH income
- $63,613
- Composite
- 39.08/100
- National rank
- #4047
- State rank
- #168 of 302 in MA
Livability — Quincy
- Score
- 81/100
- State rank
- #31
- US rank
- #1460
Category grades
Schools grade is shown separately in the Schools card above.
Census & demographics
- Census place
- Quincy, MA
- County
- Norfolk County · 644,082 people
- City population
- 101,966
- Metro
- Boston-Cambridge-Newton, MA-NH
- Population (ZIP)
- 62,993
- Household income
- $96,290
- Rent vs Own
- Severe rent burden
- 3560.0
Population outlook (Norfolk County) Hauer SSP2
- Today (2025)
- 737,259 people
- By 2030
- 755,213 · +2.4%
- By 2040
- 786,961 · +6.7%
- By 2050
- 813,019 · +10.3%
- By 2075
- 861,214 · +16.8%
- By 2100
- 845,063 · +14.6%
Race, ethnicity, and origin ACS 2023
- Neighborhood character
- Diverse neighborhood (Simpson 0.63)
- Race & ethnicity
- White 55% Asian 24% Two or more races 8% Black 8% Hispanic / Latino 7%
- Hispanic origin (detail)
- Puerto Rican 2%
- Common ancestry
- Romanian 2% Lithuanian 2% Italian 1%
- Foreign-born
- 31% · China, Canada, Vietnam
- Languages at home
- 64% English-only · Chinese 10% Other Indo-European 8% Spanish 4%
Political lean MEDSL · Norfolk
- 2024 margin
- Strong D (+28.8) · D 63.3% · R 34.6% · Other 2.1%
- 2008→2024 swing
- +10.2pp toward D · 2008: 18.5pp · 2024: 28.8pp
- All cycles
- 2024: D+28.8 2020: D+36.3 2016: D+27.9 2012: D+16.1 2008: D+18.5
Not yet ingested
- Civics
- —
Market trends
- HPI YoY
- ▼ -627.09%
- Current HPI
- 313.1397
- Rent YoY
- ▲ 2.72%
- Metro
- Boston-Cambridge-Newton, MA-NH
- State GDP YoY
- ▲ 2.28%
- F500 in state
- 38
Industry mix (Fortune 500 HQ in MA)
| Industry | F500 HQs | Revenue |
|---|---|---|
| Technology | 3 | $17B |
|
||
| Insurance | 2 | $84B |
|
||
| Retail | 2 | $76B |
|
||
| Life Sciences | 1 | $43B |
|
||
| Energy Technology | 1 | $31B |
|
||
| Aerospace / Defense | 1 | $18B |
|
||
Price history
1 event — show timeline
- 2026-01-14 Listed $1,900,000 MLS PIN
Property tax history
+1.8%/yrLatest (2023): $11,856 · +5.9% YoY. Source: county tax records.
Cash-flow waterfall
monthlySold comps — $/sqft
last 12 mo · ≤1 miLoading sold comps…