15445 Colbalt #181 · Los Angeles, CA
Flood risk 1/10 · Minimal
- FEMA flood zone
- X (unshaded)
- Chance of flooding over 30 yrs
- 0.0%
- Est. flood insurance / yr
- $507 – $1,088
Fire risk 6/10 · Moderate
- Est. fire insurance / yr
- $659 – $1,223
Heat risk 6/10 · Moderate
- Hot days now (above 100°F)
- 8 days/yr
- Hot days in 30 yrs
- 22 days/yr
Wind risk 1/10 · Minimal
- Chance of severe wind over 30 yrs
- —
Air-quality risk 6/10 · Moderate
- Unhealthy air days now
- 10 days/yr
- Unhealthy air days in 30 yrs
- 12 days/yr
Risk factors via First Street. Map © Google.
Why this score? — see what drove the B- grade
The composite is a weighted blend of 9 inputs, each scored 0–100. Each bar is that input's sub-score; the figure is the points it added to the 100-point composite (weight × sub-score).
- Cash flow +27.4/30.0
- ARV discount +10.5/15.0
- DSCR +9.6/10.0
- 1% rule +7.5/10.0
- Schools +3.6/10.0
- Livability +3.4/5.0
- Rent growth +2.5/5.0
- Condition / age +2.5/5.0
- Appreciation +0.0/10.0
$249,900
🖨 Deal sheet (PDF) 📄 Offer letter ✓ Due diligence
Listing remarks MLS
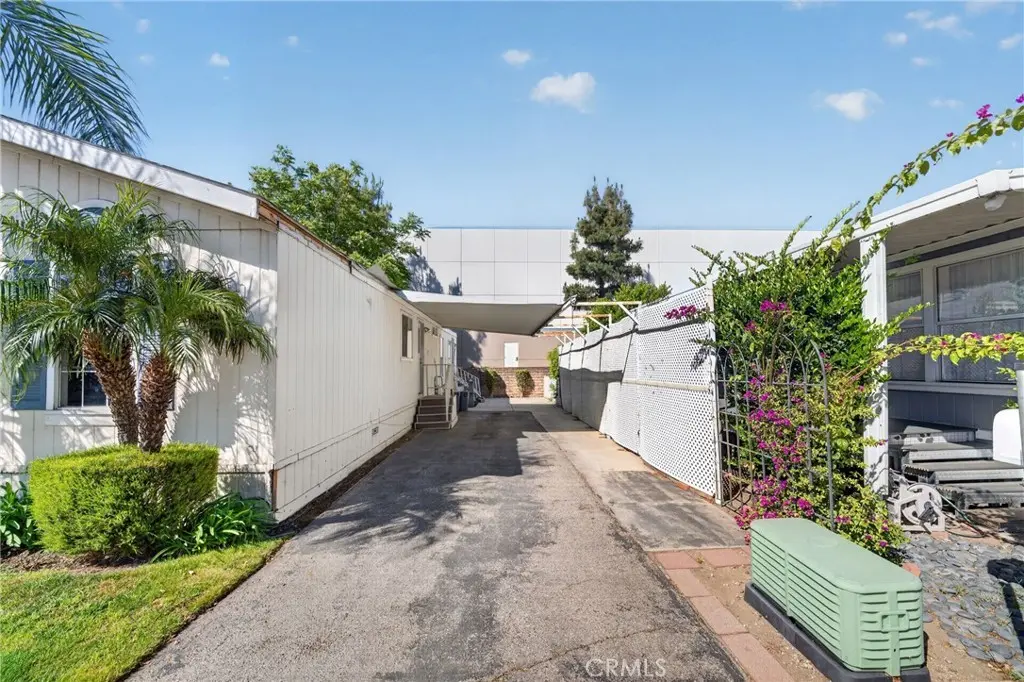
Immaculate home in the newer part of the park. With direct access to the street through a secured gate with remote. Updated with newer paint and tile. Landscaped, deck, 3-car carport, central air and heat, approximately 1340 sqft of living space. Easy to Show!!-Disability Access:None (N)
Key facts
- Primary suite
- Updated kitchen
- Indoor laundry room
Tags
Property features AI
Finance
- Other:
- Financial info:
- HOA & community: Part of an association; Land lease of $1,100
Exterior
- Parking: Located in Tahitian Mobile Park
- Security:
- Utilities: Sewer paid; Private water
- Home design: Single-story dwelling; Mobile home remains on site; Mobile dimensions approximately 24 ft by 54 ft
- Construction: Year built per public records
- Exterior features: Association swimming pool; Sidewalks; Zero lot line
Interior
- Kitchen: No appliances included
- Bedrooms:
- Flooring:
- Bathrooms: 2 full bathrooms; Bathtub
- Heating & cooling: Central cooling
- Interior features: Entry at ground level; Central cooling
- Laundry & utility: Dedicated laundry room
Neighborhood map
What this means for you Summary
Snapshot
- This is a 3-bed/2.0-bath manufactured listed at $250k.
Deal economics
- At list price, monthly cash flow is $732 ($9k/yr) — positive.
- The deal already cash-flows at list — no discount required.
- Meets the 1% rule at list price ($3k rent vs $250k).
- Recommended offer: $246k (1.5% below list) — sets the bar for market timing.
- Cap rate 9.8% vs local median 2.1% in Los Angeles — top-decile yield for the area; either an underpriced asset or a hidden risk that comps aren't pricing in. Stress-test before assuming the spread holds.
Location & tenants
- Location reads 68/100 on livability (#273 in CA) — a middle-class / working-renter tenant base. Strengths: amenities A+, commute A+, employment B; Watch: health & safety C-, crime F, cost of living F.
- Los Angeles Unified (urban): math 29% / reading 54% proficiency, ranked #223 of 517 in CA (top 43%) — families likely to look elsewhere, expect single-tenant / working-renter base with shorter leases; 67% free/reduced lunch — lower-income household profile, screen leases tightly.
- Zoned schools: Herrick Avenue Elementary (381 students, 88% FRL); Olive Vista Middle (946 students, 91% FRL); San Fernando Senior High (math 20% / reading 51%, grade F, #609 of 1,170 statewide, top 52%, 1,745 students, 94% FRL) — zoned schools average 91% FRL vs 67% district-wide (23 pts higher); higher-poverty schools than district average — tighter screening recommended.
- Market conditions: Rents flat; 183 active listings in the ZIP; 17 comparable units currently listed for rent nearby; rentals at typical pace (median 22d on market — plan ~3-4 weeks tenant-placement turnaround); solid renter incomes; 19,697 units permitted in Los Angeles County in 2024 (9,426 in 5+ unit buildings).
- This rent runs 38% of the median local income ($98k/yr) — at the standard rent-burdened threshold; future hikes will face affordability resistance.
Forward outlook
- Local home prices are declining (-3.0%/yr); year-one equity from $2k of loan paydown is wiped out by about $7k of value loss. Plan a longer hold.
- Los Angeles County population projected at +9% by 2050 — modest demand growth; plan on rents tracking national, not racing it.
Negotiation context
- It's been on market 19 days — a 2% lower offer ($246k) is reasonable based on typical stale-listing flexibility.
- 4 sale attempts since 22y ago with the ask held roughly flat each time — persistent listings suggest the price (not the market) is what's stuck; bring a comps-based counter.
- Current owner paid $90k; list at $250k implies a 178% gain — meaningful room to come down on a strong offer.
Risks & watch-outs
- Climate carrying-cost: major wildfire risk; extreme-heat days projected 8→22/yr by 2055 (HVAC capex compounding) — expect insurance premiums to compound above CPI over the hold.
Questions for the listing agent
- Is there a deadline driving the sale (1031 exchange, divorce, estate, relocation)? That informs how much negotiation room exists.
- Schools are D-rated, which usually means shorter tenancies and higher turnover. Who's the typical renter profile here, and what's been the actual vacancy rate?
- Crime grade is F in this area — have there been break-ins, vandalism, or insurance claims at this property in the last 3 years? What carrier currently insures it and at what premium?
- What's the average days-on-market for RENTAL listings here right now (not sales)? A rising rental-DOM trend means longer vacancies and softer asking-rent achievability than the comps imply.
- What's the recent tenant-quality profile in this submarket — average credit score on applications, eviction rate, late-payment / NSF rate, and stable-employment percentage? A property-management company in the area should have these aggregated.
- How much new for-sale + rental construction is in the pipeline within 1–3 miles? Heavy new supply typically softens prices + rents 12–24 months out; constrained supply supports both.
Investment metrics
- 1% rule
- 1.25% ✓
- Cap rate
- 9.81%
- Cash-on-cash
- 12.56%
- DSCR
- 1.56
- GRM
- 6.7
CMA / ARV
- ARV (on-the-fly)
- $267,456
- Comps found
- 5
Show comp detail 5 sales within ~0.75 mi
| Address | Dist | Beds/Ba | Sqft | Sold | Price | $/sf | Match |
|---|---|---|---|---|---|---|---|
| 15445 Cobalt St #222 | 0.08mi | 2/2.0 (-1) | 1,344 (0%) | 10mo | $190,000 | $141 | 83 |
| 15445 Cobalt St #68 | 0.08mi | 3/2.0 | 1,296 (-4%) | 14mo | $300,000 | $231 | 78 |
| 15445 Cobalt #227 | 0.08mi | 4/2.0 (+1) | 1,525 (+14%) | 2mo | $303,000 | $199 | 67 |
| 15445 Cobalt St #220 | 0.08mi | 2/2.0 (-1) | 1,152 (-14%) | 1mo | $245,000 | $213 | 67 |
| 15831 Olden St #37 | 0.56mi | 4/2.0 (+1) | 1,440 (+7%) | 2mo | $265,000 | $184 | 55 |
Match score weights: distance 35% · size 25% · config 20% · recency 20%. Top-matched comps best support the ARV.
Projected returns pro-forma
-3.0% appreciation · 0.02% rent growth · sell at horizon
- IRR
- -1.1%
- Equity multiple
- 0.96×
- Total profit
- $-2,859
- Equity at exit
- $37,261
- IRR
- 5.1%
- Equity multiple
- 1.32×
- Total profit
- $22,729
- Equity at exit
- $21,607
Cash invested: $69,972 (down + closing). Projections, not guarantees.
Landlord ↔ Tenant lean methodology
- Overall (CITY)
- 0 Strongly Tenant-Friendly
- State California
- 18 Strongly Tenant-Friendly · D+13
- County
- — inherits STATE
- City Los Angeles
- 0 Strongly Tenant-Friendly · D+22
ZIP-level market 91342
- Rents YoY
- 0.0%
- Active inventory
- 183
- Price-to-rent
- 6.7×
Monthly cashflow live
- Estimated rent
- $3,113 high interval (Pro) →
- Mortgage (P&I)
- −$1,311
- Tax est. 1.5%
- −$312 /mo · $3,748/yr
- Insurance
- −$104
- HOA
- −$0
- Vacancy / Maint / Mgmt
- −$654
- Net cashflow
- $732
Break-even live
Sensitivity live
| Price | -10% $905 | -5% $819 | +0% $732 | +5% $646 | +10% $560 |
|---|---|---|---|---|---|
| Rent | -10% $487 | -5% $610 | +0% $732 | +5% $855 | +10% $978 |
| Rate | -1.0pp $858 | -0.5pp $796 | base $732 | +0.5pp $668 | +1.0pp $602 |
UW: 25.0% down · 7.5% · 30yr · 1.5% tax · 5.0% vac · 8.0% maint · 8.0% mgmt
Financing live
Cash to close
- Down payment
- $62,475
- Closing costs
- $7,497
- Reserves months
- —
- Total cash needed
- —
Loan-product check · same deal, 3 products live
Conventional
25% down · 7.5% · 30yr
- Down + closing
- —
- Monthly P&I
- —
- Monthly cashflow
- —
- DSCR
- —
- Eligible?
- —
Personal DTI + credit; lowest rate.
DSCR
20% down · 8.5% · 30yr
- Down + closing
- —
- Monthly P&I
- —
- Monthly cashflow
- —
- DSCR
- —
- Eligible?
- —
No personal income docs; deal must DSCR.
Hard money
10% down · 12.0% · 12mo
- Down + closing
- —
- Monthly P&I
- —
- Monthly cashflow
- —
- DSCR
- —
- Eligible?
- —
Short-term bridge; refi at stabilization.
Rent comps 17 comps
| Address | Beds | Baths | Sqft | Rent | $/sqft | DOM | Units | Dist |
|---|---|---|---|---|---|---|---|---|
| 13035 San Fernando Rd Unit 1 Sylmar, CA | 3.0 | 1.0 | 1000 | $2,445 | $2.44 | 26d | 1 | 0.23mi |
| 13408 Glenoaks Blvd Unit 13408 Sylmar, CA | 3.0 | 2.0 | 1479 | $3,395 | $2.30 | 23d | 1 | 0.65mi |
| 13615 Fellows Ave Sylmar, CA | 3.0–4.0 | 2.0–3.0 | 1094 | $2,979 | $2.72 | 22d | 2 | 0.75mi |
| 13637 Fellows Ave Unit 5 Sylmar, CA | 3.0 | 2.0 | 1000 | $2,979 | $2.98 | 0d | 1 | 0.75mi |
| 13637 Fellows Ave Unit 5 Sylmar, CA | 3.0 | 2.0 | 1000 | $2,979 | $2.98 | 45d | 1 | 0.75mi |
| 13637 Fellows Ave Unit 25 Sylmar, CA | 4.0 | 3.0 | 1300 | $3,761 | $2.89 | 0d | 1 | 0.75mi |
| 13637 Fellows Ave Unit 25 Sylmar, CA | 4.0 | 3.0 | 1300 | $3,761 | $2.89 | 26d | 1 | 0.75mi |
| 15106 Roxford St Sylmar, CA | 3.0 | 2.0 | 1000 | $2,875 | $2.88 | 0d | 1 | 0.76mi |
| 13811 Glenoaks Blvd Rancho Cascades, CA | 1.0–2.0 | 1.0–2.0 | 783 | $2,395 | $3.06 | 16d | 1 | 0.83mi |
| 15232 Foothill Blvd #157 Sylmar, CA | 3.0 | 3.0 | 1442 | $3,795 | $2.63 | 22d | 1 | 0.85mi |
| 12662 Bradley Ave Unit 1/2 Sylmar, CA | 3.0 | 3.0 | 1620 | $3,590 | $2.22 | 45d | 1 | 1.15mi |
| 12455 San Fernando Rd Sylmar, CA | 2.0 | 2.0 | 1100 | $2,245 | $2.04 | 45d | 1 | 1.17mi |
| 14635 Astoria St Unit Back House Sylmar, CA | 4.0 | 2.0 | 1849 | $3,799 | $2.05 | 45d | 1 | 1.19mi |
| 14456 Foothill Blvd Sylmar, CA | 3.0 | 2.5 | 1233 | $3,300 | $2.68 | 45d | 1 | 1.35mi |
| 12450 Ralston Ave #1 Sylmar, CA | 2.0 | 2.0 | 980 | $3,175 | $3.24 | 6d | 1 | 1.36mi |
| 14401 Foothill Blvd Sylmar, CA | 2.0 | 1.5 | 1166 | $2,700 | $2.32 | 0d | 1 | 1.44mi |
| 16601 Foothill Blvd Rancho Cascades, CA | 1.0–2.0 | 1.0–2.0 | 824 | $2,325 | $2.82 | 0d | 13 | 1.48mi |
Listing history 11 events
-
2026-06-21days on market $249,900 Active 19 DOM
-
2026-06-18days on market $249,900 Active 16 DOM
-
2026-06-17days on market $249,900 Active 15 DOM
-
2026-06-16days on market $249,900 Active 14 DOM
-
2026-06-15days on market $249,900 Active 13 DOM
-
2026-06-13days on market $249,900 Active 11 DOM
-
2026-06-09days on market $249,900 Active 7 DOM
-
2026-06-08days on market $249,900 Active 6 DOM
-
2026-06-07days on market $249,900 Active 5 DOM
-
2026-06-04remarks 699-char remark
-
2026-06-04$249,900 Active 2 DOM
ⓘ Source: listings_history table (triggers on properties + properties_extension) + one-shot
backfill from property_details.listing_events for pre-trigger history.
Climate risk First Street
- Flood 1/10 Low FEMA zone X (unshaded) · 0% chance over 30 yrs
- Wildfire 6/10 Major
- Heat 6/10 Major 8 d/yr ≥100°F today · 22 d/yr by 30 yrs out
- Wind 1/10 Low
- Air quality 6/10 Major 10 unhealthy d/yr today · 12 by 30 yrs out
Nearby sold comps map
Loading sold comps map…
Walkable amenities ~0.75 mi
Loading nearby amenities…
Taxation est. · year 1
- Rental income
- $37,359
- − Mortgage interest
- −$13,998
- − Property taxes
- −$3,748
- − Insurance
- −$1,250
- − Repairs & maintenance
- −$2,989
- − Management
- −$2,989
- − Depreciation
- −$7,270
- Taxable income
- $5,116
- Est. tax owed @ 24.0%
- −$1,228
- After-tax cash flow
- $7,562/yr
For passive investors: Depreciation is non-cash, so a rental often shows a tax loss while cash-flowing — sheltering income. Rental losses are passive: they offset passive income freely, and up to $25,000/yr can offset ordinary (W-2) income if you actively participate and your MAGI is under $100k (phasing out to $0 by $150k); unused losses carry forward. On sale, claimed depreciation is recaptured at up to 25%, and gains may owe capital-gains tax (a 1031 exchange can defer both). Figures are a year-1 estimate at your 24.0% rate — not tax advice; consult a CPA.
Schools (NCES district)
- District
- Los Angeles Unified
- NCES district ID
- 0622710
- Math proficiency
- 29% ▼ -4.00%
- Reading proficiency
- 54% ▲ 10.00%
- Median HH income
- $50,403
- Composite
- 35.67/100
- National rank
- #4875
- State rank
- #223 of 517 in CA
Livability — Los Angeles
- Score
- 68/100
- State rank
- #273
- US rank
- #9237
Category grades
Schools grade is shown separately in the Schools card above.
Census & demographics
- Census place
- Los Angeles, CA
- County
- Los Angeles County · 9,444,647 people
- City population
- 3,838,149
- Metro
- Los Angeles-Long Beach-Anaheim, CA
- Population (ZIP)
- 93,301
- Household income
- $98,118
- Rent vs Own
- Severe rent burden
- 2559.0
Population outlook (Los Angeles County) Hauer SSP2
- Today (2025)
- 10,940,515 people
- By 2030
- 11,256,481 · +2.9%
- By 2040
- 11,729,929 · +7.2%
- By 2050
- 11,948,407 · +9.2%
- By 2075
- 11,818,114 · +8.0%
- By 2100
- 10,842,928 · -0.9%
Race, ethnicity, and origin ACS 2023
- Neighborhood character
- Predominantly Hispanic (74%)
- Race & ethnicity
- Hispanic / Latino 74% Two or more races 23% White 12% Asian 7% Black 3% Native American 2%
- Hispanic origin (detail)
- Mexican 59%
- Common ancestry
- Italian 1%
- Foreign-born
- 36% · Canada, South Korea, Dominican Republic
- Languages at home
- 32% English-only · Spanish 59% Tagalog/Filipino 4% Other Indo-European 3%
Political lean MEDSL · Los Angeles
- 2024 margin
- Solid D (+32.9) · D 64.8% · R 31.9% · Other 3.3%
- 2008→2024 swing
- -7.4pp toward R · 2008: 40.4pp · 2024: 32.9pp
- All cycles
- 2024: D+32.9 2020: D+44.2 2016: D+48.0 2012: D+40.0 2008: D+40.4
Not yet ingested
- Civics
- —
Market trends
- HPI YoY
- ▼ -921.77%
- Current HPI
- 440.1462
- Rent YoY
- ▬ 0.02%
- Metro
- Los Angeles-Long Beach-Anaheim, CA
- State GDP YoY
- ▲ 3.21%
- F500 in state
- 116
Industry mix (Fortune 500 HQ in CA)
| Industry | F500 HQs | Revenue |
|---|---|---|
| Technology | 27 | $1,492B |
|
||
| Financial Services | 3 | $174B |
|
||
| Retail | 3 | $44B |
|
||
| Insurance | 3 | $26B |
|
||
| Media / Entertainment | 2 | $115B |
|
||
| Pharmaceuticals / Biotech | 2 | $62B |
|
||
Price history
+140.3% since first listed12 events — show timeline
- 2026-06-02 Listed $249,900 CRMLS
- 2009-07-24 Sold (MLS) $90,000 CRMLS
- 2009-07-23 Pending — CRMLS
- 2009-06-05 Listed $90,000 CRMLS
- 2009-03-05 Listing Removed — CRMLS
- 2009-02-07 Price Changed $100,000 CRMLS
- 2009-01-27 Price Changed $110,000 CRMLS
- 2008-12-09 Price Changed $115,000 CRMLS
- 2008-11-25 Price Changed $120,000 CRMLS
- 2008-11-14 Listed $125,000 CRMLS
- 2004-11-30 Sold (MLS) $97,000 CRMLS
- 2004-07-12 Listed $104,000 CRMLS
Cash-flow waterfall
monthlySold comps — $/sqft
last 12 mo · ≤1 miLoading sold comps…