 🏗️ New Construction
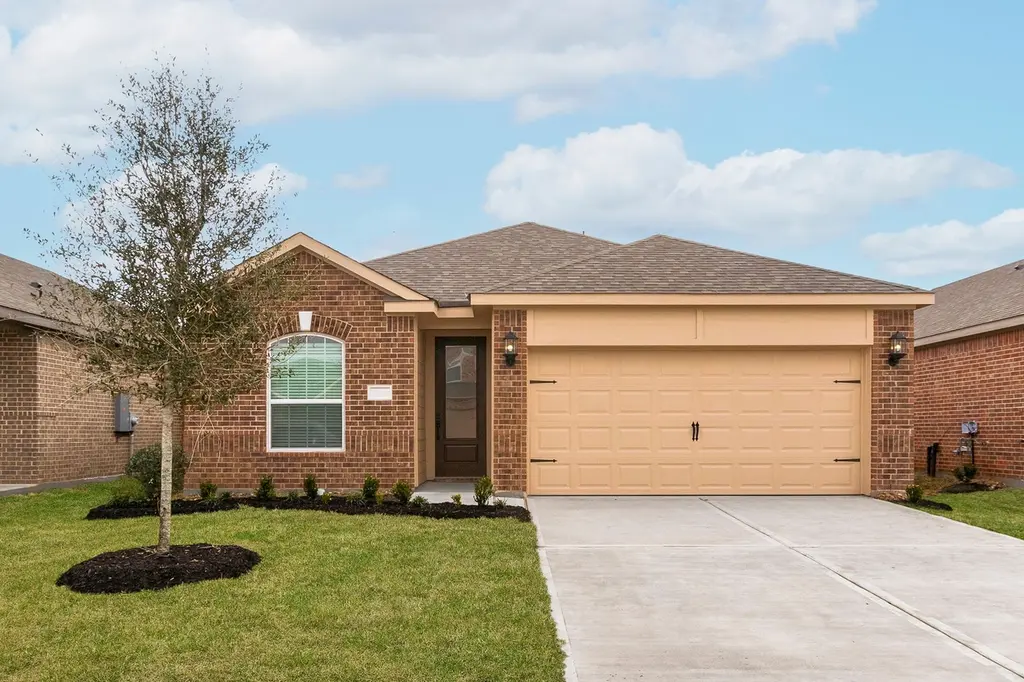
Cardinal Plan · Kendleton, TX
Flood risk No data
- FEMA flood zone
- —
- Chance of flooding over 30 yrs
- —
- Est. flood insurance / yr
- —
Fire risk No data
- Est. fire insurance / yr
- —
Heat risk No data
- Hot days now (above threshold)
- —
- Hot days in 30 yrs
- —
Wind risk No data
- Chance of severe wind over 30 yrs
- —
Air-quality risk No data
- Unhealthy air days now
- —
- Unhealthy air days in 30 yrs
- —
Risk factors via First Street. Map © Google.
Why this score? — see what drove the D+ grade
The composite is a weighted blend of 9 inputs, each scored 0–100. Each bar is that input's sub-score; the figure is the points it added to the 100-point composite (weight × sub-score).
- Cash flow +11.8/30.0
- ARV discount +7.5/15.0
- Appreciation +7.1/10.0
- Schools +4.6/10.0
- DSCR +3.5/10.0
- 1% rule +3.4/10.0
- Livability +3.1/5.0
- Rent growth +2.5/5.0
- Condition / age +2.5/5.0
$297,900
🖨 Deal sheet 📄 Offer letter ✓ Due diligence
Listing remarks
Designed with entertainment in mind, the Cardinal by LGI Homes offers curb appeal and a spacious, open floor plan with plenty of room to gather family and friends, both indoors and outdoors. The private dining room is large enough for a family table and provides direct access into the chef-ready kitchen equipped with abundant cabinet storage, granite counters and a full suite of Whirlpool appliances. A long breakfast bar that easily accommodates four barstools overlooks the spacious family room. Owners will enjoy relaxing evenings in the private, fenced backyard on the extended covered back patio. Additional features include a programmable thermostat, double-pane Low-E vinyl windows, a fini
Key facts
- Private dining room
- Chef-ready kitchen
- Whirlpool appliances
Tags
Property features AI
Finance
- Financial info: List price $297,900
Exterior
- Parking: 2 parking spaces
- Utilities: Natural gas; Central air
- Home design: Single-family plan (Cardinal)
- Exterior features: Asphalt roof
Interior
- Bedrooms: 3 bedrooms
- Bathrooms: 2 full bathrooms
- Heating & cooling: Natural gas forced-air heating; Central air conditioning
- Interior features: Open living area of 1570; Plan: Cardinal (new construction)
Neighborhood map
What this means for you Summary
Snapshot
- This is a 3-bed/2.0-bath single-family listed at $298k.
Deal economics
- At list price, monthly cash flow is $-78 ($-935/yr) — negative.
- To cash-flow at today's rent, offer at most $271k (8.9% below list).
- To meet the 1% rule (rent ≥ 1% of price), the offer needs to be $238k (20.3% below list).
- Recommended offer: $238k (20.3% below list) — sets the bar for 1% rule.
Location & tenants
- Location reads 61/100 on livability (#1,021 in TX) — a middle-class / working-renter tenant base. Strengths: cost of living A+, housing A+; Watch: schools C-, employment D+, crime D.
- Lamar CISD (suburban): math 50% / reading 53% proficiency, ranked #116 of 826 in TX (top 14%) — acceptable for families but not a draw, mixed tenant base, ~2y average lease.
- Market conditions: 232 active listings in the ZIP; 1 comparable units currently listed for rent nearby; 12,093 units permitted in Fort Bend County in 2024 (815 in 5+ unit buildings).
Forward outlook
- In year one you build about $14k of equity ($2k loan paydown + $12k appreciation (4.2% local appreciation)).
- Fort Bend County population projected at +75% by 2050 — long-run rental-demand tailwind backs the buy-and-hold thesis.
- At projected returns (4.2% appreciation + 3.0% rent growth), your $79k cash investment doubles in ~6 years — after that, you're playing with house money.
- By year 3, paydown + projected appreciation supports a ~$34k cash-out refi (75% LTV) — recoverable capital for the next deal without selling this one.
Negotiation context
- It's been on market 56 days — a 3% lower offer ($289k) is reasonable based on typical stale-listing flexibility.
Questions for the listing agent
- What do current leases actually rent for vs. the listed asking? Can we see a recent rent roll and the last 12 months of T-12 income?
- It's been on market 56 days. Have you received any prior offers? Is the seller open to a 20% concession, seller financing, or rate buy-down credit?
- Is there a deadline driving the sale (1031 exchange, divorce, estate, relocation)? That informs how much negotiation room exists.
- Crime grade is D in this area — have there been break-ins, vandalism, or insurance claims at this property in the last 3 years? What carrier currently insures it and at what premium?
- The area grade is low — what's the realistic commute time and amenity access for the typical tenant pool here? Any planned neighborhood developments (good or bad) we should know about?
- What's the average days-on-market for RENTAL listings here right now (not sales)? A rising rental-DOM trend means longer vacancies and softer asking-rent achievability than the comps imply.
- What's the recent tenant-quality profile in this submarket — average credit score on applications, eviction rate, late-payment / NSF rate, and stable-employment percentage? A property-management company in the area should have these aggregated.
- How much new for-sale + rental construction is in the pipeline within 1–3 miles? Heavy new supply typically softens prices + rents 12–24 months out; constrained supply supports both.
Investment metrics
- 1% rule
- 0.84% ✗
- Cap rate
- 5.96%
- Cash-on-cash
- -1.18%
- DSCR
- 0.95
- GRM
- 9.9
CMA / ARV
- ARV (median comp)
- $282,773
- List price
- $297,900
- Delta
- 5.35%
- Verdict
- FAIR
- Comps
- 20 within 1.0 mi
Show comp detail 12 sales within ~0.75 mi
| Address | Dist | Beds/Ba | Sqft | Sold | Price | $/sf | Match |
|---|---|---|---|---|---|---|---|
| 10710 Sage Bend Dr | 0.49mi | 3/2.0 | 1,595 (+2%) | 1mo | $274,990 | $172 | 74 |
| 1027 Rosewood Trl | 0.53mi | 3/2.0 | 1,620 (+3%) | 3mo | $313,900 | $194 | 68 |
| 1022 Whispering Winds Dr | 0.51mi | 3/2.0 | 1,613 (+3%) | 5mo | $292,900 | $182 | 68 |
| 10950 Tawny Ridge Dr | 0.50mi | 3/2.0 | 1,526 (-3%) | 6mo | $259,990 | $170 | 67 |
| 950 Mockingbird Passage Dr | 0.46mi | 3/2.0 | 1,434 (-9%) | 7mo | $249,990 | $174 | 58 |
| 10914 Silver Canoe Dr | 0.56mi | 3/2.0 | 1,464 (-7%) | 9mo | $258,990 | $177 | 55 |
| 1123 Rustic Willow Dr | 0.62mi | 3/2.0 | 1,474 (-6%) | 9mo | $259,990 | $176 | 53 |
| 10735 Dogwood Sky Dr | 0.43mi | 4/2.0 (+1) | 1,778 (+13%) | 0mo | $289,990 | $163 | 52 |
| 1031 Rosewood Trl | 0.53mi | 4/2.0 (+1) | 1,778 (+13%) | 3mo | $299,900 | $169 | 46 |
| 726 Blue Sky Pl | 0.59mi | 3/2.0 | 1,779 (+13%) | 8mo | $289,990 | $163 | 44 |
| 10811 Hickory Ln | 0.68mi | 3/2.0 | 1,400 (-11%) | 9mo | $289,900 | $207 | 43 |
| 10803 Hickory Ln | 0.70mi | 4/2.0 (+1) | 1,778 (+13%) | 2mo | $309,900 | $174 | 39 |
Match score weights: distance 35% · size 25% · config 20% · recency 20%. Top-matched comps best support the ARV.
Projected returns pro-forma
4.15% appreciation · 3.0% rent growth · sell at horizon
- IRR
- 9.7%
- Equity multiple
- 1.59×
- Total profit
- $46,774
- Equity at exit
- $145,910
- IRR
- 11.5%
- Equity multiple
- 2.93×
- Total profit
- $152,836
- Equity at exit
- $240,697
Cash invested: $79,176 (down + closing). Projections, not guarantees.
Landlord ↔ Tenant lean methodology
- Overall (STATE)
- 87 Strongly Landlord-Friendly
- State Texas
- 87 Strongly Landlord-Friendly · R+5
- County
- — inherits STATE
- City
- — inherits STATE
ZIP-level market 77417
- Home prices YoY
- 1.2%
- Active inventory
- 232
- Price-to-rent
- 10.5×
Monthly cashflow live
- Estimated rent
- $2,375 medium interval (Pro) →
- Mortgage (P&I)
- −$1,483
- Tax est. 1.5%
- −$353 /mo · $4,242/yr
- Insurance
- −$118
- HOA
- −$0
- Vacancy / Maint / Mgmt
- −$499
- Net cashflow
- $-78
Break-even live
UW: 25.0% down · 7.5% · 30yr · 1.5% tax · 5.0% vac · 8.0% maint · 8.0% mgmt
Financing live
Cash to close
- Down payment
- $70,693
- Closing costs
- $8,483
- Reserves months
- —
- Total cash needed
- —
Loan-product check · same deal, 3 products live
Conventional
25% down · 7.5% · 30yr
- Down + closing
- —
- Monthly P&I
- —
- Monthly cashflow
- —
- DSCR
- —
- Eligible?
- —
Personal DTI + credit; lowest rate.
DSCR
20% down · 8.5% · 30yr
- Down + closing
- —
- Monthly P&I
- —
- Monthly cashflow
- —
- DSCR
- —
- Eligible?
- —
No personal income docs; deal must DSCR.
Hard money
10% down · 12.0% · 12mo
- Down + closing
- —
- Monthly P&I
- —
- Monthly cashflow
- —
- DSCR
- —
- Eligible?
- —
Short-term bridge; refi at stabilization.
Rent comps 1 comps
| Address | Beds | Baths | Sqft | Rent | $/sqft | DOM | Units | Dist |
|---|---|---|---|---|---|---|---|---|
| 10730 Sky Creek Ln Beasley, TX | 3.0–4.0 | 2.0–2.5 | 1869 | $2,375 | $1.27 | 1d | 1 | 0.05mi |
Listing history 14 events
-
2026-06-18days on market $297,900 Active 56 DOM
-
2026-06-17days on market $297,900 Active 55 DOM
-
2026-06-16days on market $297,900 Active 54 DOM
-
2026-06-15days on market $297,900 Active 53 DOM
-
2026-06-13days on market $297,900 Active 51 DOM
-
2026-06-10days on market $297,900 Active 47 DOM
-
2026-06-08days on market $297,900 Active 46 DOM
-
2026-06-07days on market $297,900 Active 45 DOM
-
2026-06-04days on market $297,900 Active 42 DOM
-
2026-06-03days on market $297,900 Active 41 DOM
-
2026-06-02days on market $297,900 Active 40 DOM
-
2026-06-01days on market $297,900 Active 39 DOM
-
2026-05-31days on market $297,900 Active 38 DOM
-
2026-04-23$297,900 Active 758-char remark
ⓘ Source: listings_history table (triggers on properties + properties_extension) + one-shot
backfill from property_details.listing_events for pre-trigger history.
Nearby sold comps map
Loading sold comps map…
Walkable amenities ~0.75 mi
Loading nearby amenities…
Taxation est. · year 1
- Rental income
- $28,500
- − Mortgage interest
- −$15,840
- − Property taxes
- −$4,242
- − Insurance
- −$1,414
- − Repairs & maintenance
- −$2,280
- − Management
- −$2,280
- − Depreciation
- −$8,226
- Taxable loss
- −$5,781
- Est. tax savings @ 24.0%
- +$1,388
- After-tax cash flow
- $452/yr
For passive investors: Depreciation is non-cash, so a rental often shows a tax loss while cash-flowing — sheltering income. Rental losses are passive: they offset passive income freely, and up to $25,000/yr can offset ordinary (W-2) income if you actively participate and your MAGI is under $100k (phasing out to $0 by $150k); unused losses carry forward. On sale, claimed depreciation is recaptured at up to 25%, and gains may owe capital-gains tax (a 1031 exchange can defer both). Figures are a year-1 estimate at your 24.0% rate — not tax advice; consult a CPA.
Schools (NCES district)
- District
- Lamar CISD
- NCES district ID
- 4826580
- Math proficiency
- 50% ▼ -12.00%
- Reading proficiency
- 53% ▼ -4.00%
- Median HH income
- $75,213
- Composite
- 46.43/100
- National rank
- #2452
- State rank
- #116 of 826 in TX
Livability — Kendleton
- Score
- 61/100
- State rank
- #1021
- US rank
- #18149
Category grades
Schools grade is shown separately in the Schools card above.
Census & demographics
- Population (ZIP)
- 3,232
Population outlook (Fort Bend County) Hauer SSP2
- Today (2025)
- 1,004,526 people
- By 2030
- 1,153,104 · +14.8%
- By 2040
- 1,453,718 · +44.7%
- By 2050
- 1,753,781 · +74.6%
- By 2075
- 2,455,772 · +144.5%
- By 2100
- 2,930,528 · +191.7%
Race, ethnicity, and origin ACS 2023
- Neighborhood character
- Predominantly Hispanic (67%)
- Race & ethnicity
- Hispanic / Latino 67% Two or more races 49% White 22% Black 8%
- Hispanic origin (detail)
- Mexican 54%
- Common ancestry
- Italian 2% Romanian 1%
- Foreign-born
- 3% · Canada
- Languages at home
- 76% English-only · Spanish 24%
Political lean MEDSL · Fort Bend
- 2024 margin
- Toss-up / Even · D 49.5% · R 47.9% · Other 2.6%
- 2008→2024 swing
- +4.0pp toward D · 2008: -2.4pp · 2024: 1.6pp
- All cycles
- 2024: D+1.6 2020: D+10.6 2016: D+6.6 2012: R+6.8 2008: R+2.4
Not yet ingested
- Civics
- —
Market trends
- HPI YoY
- ▲ 4.15%
- Current HPI
- 337.8236
- Rent YoY
- —
- Metro
- —
- State GDP YoY
- ▲ 3.95%
- F500 in state
- 110
Industry mix (Fortune 500 HQ in TX)
| Industry | F500 HQs | Revenue |
|---|---|---|
| Energy | 16 | $1,198B |
|
||
| Technology | 5 | $198B |
|
||
| Engineering / Construction | 4 | $72B |
|
||
| Energy Services | 3 | $60B |
|
||
| Utilities | 3 | $41B |
|
||
| Healthcare | 2 | $330B |
|
||
Cash-flow waterfall
monthlySold comps — $/sqft
last 12 mo · ≤1 miLoading sold comps…