 🏷️ Likely Rental
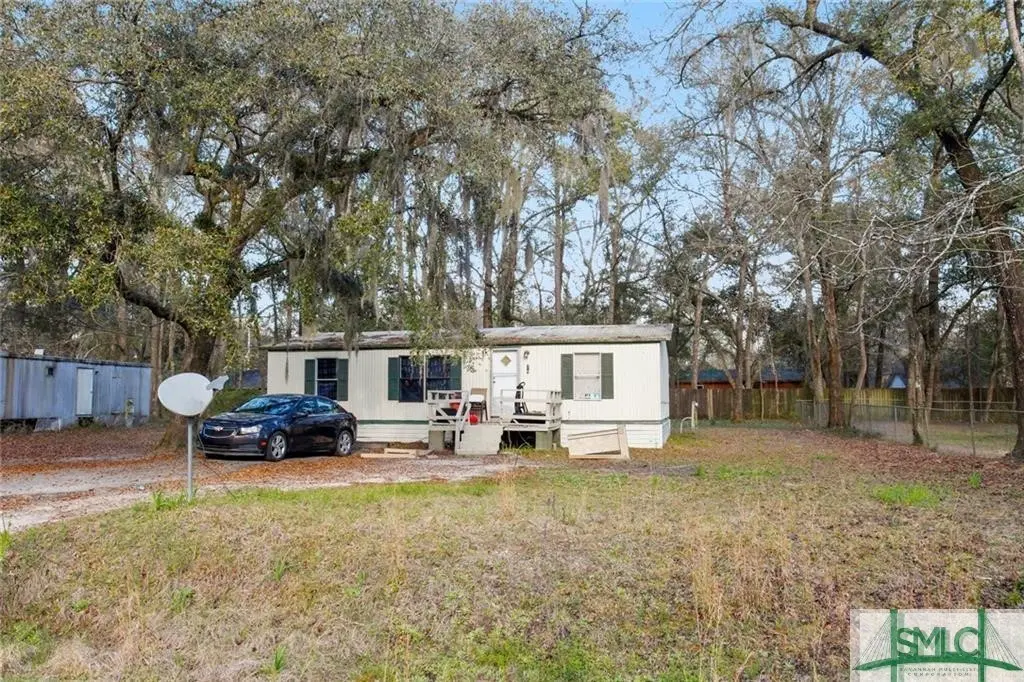
78 Button Ave · Midway, GA
Flood risk 1/10 · Minimal
- FEMA flood zone
- X (unshaded)
- Chance of flooding over 30 yrs
- 0.0%
- Est. flood insurance / yr
- $507 – $1,088
Fire risk 6/10 · Moderate
- Est. fire insurance / yr
- $963 – $1,789
Heat risk 9/10 · Severe
- Hot days now (above 109°F)
- 7 days/yr
- Hot days in 30 yrs
- 18 days/yr
Wind risk 9/10 · Severe
- Chance of severe wind over 30 yrs
- 99.0%
Air-quality risk 2/10 · Minimal
- Unhealthy air days now
- 2 days/yr
- Unhealthy air days in 30 yrs
- 2 days/yr
Risk factors via First Street. Map © Google.
Why this score? — see what drove the B- grade
The composite is a weighted blend of 9 inputs, each scored 0–100. Each bar is that input's sub-score; the figure is the points it added to the 100-point composite (weight × sub-score).
- Cash flow +30.0/30.0
- 1% rule +10.0/10.0
- DSCR +10.0/10.0
- ARV discount +7.5/15.0
- Livability +3.2/5.0
- Rent growth +2.5/5.0
- Schools +2.0/10.0
- Condition / age +2.0/5.0
- Appreciation +0.0/10.0
$99,000
🖨 Deal sheet 📄 Offer letter ✓ Due diligence
Listing remarks MLS
Rental property with good tenant. New front porch, new flooring, new bathroom vanities and toilets. Investors should love this one.
Key facts
- New toilets
- Front porch
- New flooring
Tags
Neighborhood map
What this means for you Summary
Snapshot
- This is a 3-bed/2.0-bath manufactured listed at $99k. Condition is rated fair.
Deal economics
- At list price, monthly cash flow is $790 ($9k/yr) — positive.
- The deal already cash-flows at list — no discount required.
- Meets the 1% rule at list price ($2k rent vs $99k).
- Recommended offer: $87k (12.0% below list) — sets the bar for market timing.
- Cap rate 15.9% vs local median 4.3% in Midway — top-decile yield for the area; either an underpriced asset or a hidden risk that comps aren't pricing in. Stress-test before assuming the spread holds.
Location & tenants
- Location reads 65/100 on livability (#219 in GA) — a middle-class / working-renter tenant base. Strengths: crime A+, cost of living A+, housing A+; Watch: schools D-, amenities F, commute F.
- Liberty County (urban): math 19% / reading 28% proficiency, ranked #133 of 174 in GA (top 76%) — low school quality limits family demand, transient renter base, plan for 1-2y turnover.
- Market conditions: 211 active listings in the ZIP; 1 comparable units currently listed for rent nearby; solid renter incomes; 471 units permitted in Liberty County in 2024 (0 in 5+ unit buildings).
Forward outlook
- Local home prices are declining (-3.0%/yr); year-one equity from $684 of loan paydown is wiped out by about $3k of value loss. Plan a longer hold.
- Liberty County population projected to shrink 8% by 2050 — rents likely to lag national; underwrite the cash flow, not the appreciation.
- At projected returns (-3.0% appreciation + 3.0% rent growth), your $28k cash investment doubles in ~4 years — after that, you're playing with house money.
Negotiation context
- It's been on market 190 days — a 12% lower offer ($87k) is reasonable based on typical stale-listing flexibility.
- 6 sale attempts since 9y ago with the ask held roughly flat each time — persistent listings suggest the price (not the market) is what's stuck; bring a comps-based counter.
Risks & watch-outs
- Climate carrying-cost: severe wind risk, 99% chance of damaging wind over 30y; major wildfire risk; extreme-heat days projected 7→18/yr by 2055 (HVAC capex compounding) — expect insurance premiums to compound above CPI over the hold.
Questions for the listing agent
- It's been on market 190 days. Have you received any prior offers? Is the seller open to a 12% concession, seller financing, or rate buy-down credit?
- Have any recent inspections been done? Can we get a copy of the seller's disclosures and any deferred-maintenance estimates?
- Why hasn't it sold? Are there any deal-killer items the seller is aware of (foundation, flood, title, zoning, code violations)?
- Is there a deadline driving the sale (1031 exchange, divorce, estate, relocation)? That informs how much negotiation room exists.
- Schools are D-rated, which usually means shorter tenancies and higher turnover. Who's the typical renter profile here, and what's been the actual vacancy rate?
- What's the average days-on-market for RENTAL listings here right now (not sales)? A rising rental-DOM trend means longer vacancies and softer asking-rent achievability than the comps imply.
- What's the recent tenant-quality profile in this submarket — average credit score on applications, eviction rate, late-payment / NSF rate, and stable-employment percentage? A property-management company in the area should have these aggregated.
- How much new for-sale + rental construction is in the pipeline within 1–3 miles? Heavy new supply typically softens prices + rents 12–24 months out; constrained supply supports both.
Investment metrics
- 1% rule
- 1.88% ✓
- Cap rate
- 15.86%
- Cash-on-cash
- 34.18%
- DSCR
- 2.52
- GRM
- 4.4
CMA / ARV
- ARV (median comp)
- $214,778
- List price
- $99,000
- Delta
- -53.91%
- Verdict
- UNDERPRICED
- Comps
- 1 within 2.0 mi
Show comp detail 1 sale within ~0.75 mi
| Address | Dist | Beds/Ba | Sqft | Sold | Price | $/sf | Match |
|---|---|---|---|---|---|---|---|
| 125 Otto Dr | 0.67mi | 3/2.0 | 1,150 (+6%) | 12mo | $205,000 | $178 | 48 |
Match score weights: distance 35% · size 25% · config 20% · recency 20%. Top-matched comps best support the ARV.
Projected returns pro-forma
-3.0% appreciation · 3.0% rent growth · sell at horizon
- IRR
- 29.6%
- Equity multiple
- 2.24×
- Total profit
- $34,278
- Equity at exit
- $14,761
- IRR
- 36.9%
- Equity multiple
- 4.42×
- Total profit
- $94,721
- Equity at exit
- $8,560
Cash invested: $27,720 (down + closing). Projections, not guarantees.
Landlord ↔ Tenant lean methodology
- Overall (STATE)
- 90 Strongly Landlord-Friendly
- State Georgia
- 90 Strongly Landlord-Friendly · R+3
- County
- — inherits STATE
- City
- — inherits STATE
ZIP-level market 31320
- Home prices YoY
- -9.7%
- Active inventory
- 211
- Price-to-rent
- 4.4×
Monthly cashflow live
- Estimated rent
- $1,866 medium interval (Pro) →
- Mortgage (P&I)
- −$519
- Tax est. 1.5%
- −$124 /mo · $1,485/yr
- Insurance
- −$41
- HOA
- −$0
- Vacancy / Maint / Mgmt
- −$392
- Net cashflow
- $790
Break-even live
UW: 25.0% down · 7.5% · 30yr · 1.5% tax · 5.0% vac · 8.0% maint · 8.0% mgmt
Financing live
Cash to close
- Down payment
- $24,750
- Closing costs
- $2,970
- Reserves months
- —
- Total cash needed
- —
Loan-product check · same deal, 3 products live
Conventional
25% down · 7.5% · 30yr
- Down + closing
- —
- Monthly P&I
- —
- Monthly cashflow
- —
- DSCR
- —
- Eligible?
- —
Personal DTI + credit; lowest rate.
DSCR
20% down · 8.5% · 30yr
- Down + closing
- —
- Monthly P&I
- —
- Monthly cashflow
- —
- DSCR
- —
- Eligible?
- —
No personal income docs; deal must DSCR.
Hard money
10% down · 12.0% · 12mo
- Down + closing
- —
- Monthly P&I
- —
- Monthly cashflow
- —
- DSCR
- —
- Eligible?
- —
Short-term bridge; refi at stabilization.
Rent comps 1 comps
| Address | Beds | Baths | Sqft | Rent | $/sqft | DOM | Units | Dist |
|---|---|---|---|---|---|---|---|---|
| 70 Martin Rd Midway, GA | 2.0 | 1.0 | 1000 | $1,400 | $1.40 | 43d | 1 | 0.92mi |
Listing history 28 events
-
2026-06-19days on market $99,000 Active 190 DOM
-
2026-06-18days on market $99,000 Active 189 DOM
-
2026-06-17days on market $99,000 Active 188 DOM
-
2026-06-16days on market $99,000 Active 187 DOM
-
2026-06-15days on market $99,000 Active 186 DOM
-
2026-06-14days on market $99,000 Active 184 DOM
-
2026-06-13days on market $99,000 Active 183 DOM
-
2026-06-10days on market $99,000 Active 181 DOM
-
2026-06-09days on market $99,000 Active 180 DOM
-
2026-06-08days on market $99,000 Active 179 DOM
-
2026-06-07days on market $99,000 Active 178 DOM
-
2026-06-05days on market $99,000 Active 175 DOM
-
2026-06-03days on market $99,000 Active 174 DOM
-
2026-06-02days on market $99,000 Active 173 DOM
-
2026-06-01days on market $99,000 Active 172 DOM
-
2026-05-31days on market $99,000 Active 171 DOM
-
2026-05-30days on market $99,000 Active 170 DOM
-
2025-10-31historical
-
2024-07-01$99,000
Show marketing remark (131 chars)
Rental property with good tenant. New front porch, new flooring, new bathroom vanities and toilets. Investors should love this one.
-
2024-07-01$99,000 Active 131-char remark
Show marketing remark (131 chars)
Rental property with good tenant. New front porch, new flooring, new bathroom vanities and toilets. Investors should love this one.
-
2024-03-28historical
-
2024-03-28historical
-
2024-02-23$99,900
-
2024-02-23$99,900
-
2021-11-30historical
-
2021-03-25$75,000
-
2018-03-21historical
-
2017-03-21$34,910
ⓘ Source: listings_history table (triggers on properties + properties_extension) + one-shot
backfill from property_details.listing_events for pre-trigger history.
Climate risk First Street
- Flood 1/10 Low FEMA zone X (unshaded) · 0% chance over 30 yrs
- Wildfire 6/10 Major
- Heat 9/10 Extreme 7 d/yr ≥109°F today · 18 d/yr by 30 yrs out
- Wind 9/10 Extreme 99% chance of damaging wind over 30 yrs
- Air quality 2/10 Low 2 unhealthy d/yr today · 2 by 30 yrs out
Nearby sold comps map
Loading sold comps map…
Walkable amenities ~0.75 mi
Loading nearby amenities…
Taxation est. · year 1
- Rental income
- $22,387
- − Mortgage interest
- −$5,546
- − Property taxes
- −$1,485
- − Insurance
- −$495
- − Repairs & maintenance
- −$1,791
- − Management
- −$1,791
- − Depreciation
- −$2,880
- Taxable income
- $8,399
- Est. tax owed @ 24.0%
- −$2,016
- After-tax cash flow
- $7,460/yr
For passive investors: Depreciation is non-cash, so a rental often shows a tax loss while cash-flowing — sheltering income. Rental losses are passive: they offset passive income freely, and up to $25,000/yr can offset ordinary (W-2) income if you actively participate and your MAGI is under $100k (phasing out to $0 by $150k); unused losses carry forward. On sale, claimed depreciation is recaptured at up to 25%, and gains may owe capital-gains tax (a 1031 exchange can defer both). Figures are a year-1 estimate at your 24.0% rate — not tax advice; consult a CPA.
Condition & rehab AI · 1 photo
This manufactured home requires significant repairs and updates to its exterior, interior, and systems, as well as landscaping improvements. The home has potential for substantial value increase with these improvements.
Repairs flagged
- Major roof — The roof appears old and possibly damaged, indicating a major repair is needed.
- Major exterior siding — The siding is peeling and worn, indicating a major repair is needed.
- Major flooring — The flooring is not visible, but the overall condition suggests it may need replacement.
- Major interior walls/paint — The interior walls and paint are not visible, but the exterior suggests a need for fresh paint and possibly repairs.
- Major bathrooms — The bathrooms are not visible, but the listing mentions new vanities and toilets, suggesting they may need updating.
- Major kitchen — The kitchen is not visible, but the overall condition suggests it may need updating.
- Major HVAC/mechanicals — The HVAC and mechanical systems are not visible, but the overall condition suggests they may need updating.
- Major landscaping — The landscaping and curb appeal are poor, with overgrown vegetation and a lack of maintenance.
Value-add opportunities
- Both landscaping and curb appeal — Improving the landscaping and curb appeal can significantly enhance the home's resale and rental value.
- Both roof and exterior siding — Repairing the roof and exterior siding can improve the home's appearance and increase its value.
- Both interior walls and paint — Updating the interior walls and paint can improve the home's appearance and increase its value.
- Both bathrooms and kitchen — Updating the bathrooms and kitchen can improve the home's functionality and increase its value.
- Both HVAC and mechanical systems — Updating the HVAC and mechanical systems can improve the home's comfort and increase its value.
- Both flooring — Replacing the flooring can improve the home's appearance and increase its value.
Renovation cost estimate screening
| Repair item | Severity | Est. cost |
|---|---|---|
| roof · The roof appears old and possibly damaged, indicating a major repair is needed. | Major | $15,000–50,000 |
| exterior siding · The siding is peeling and worn, indicating a major repair is needed. | Major | $15,000–50,000 |
| flooring · The flooring is not visible, but the overall condition suggests it may need replacement. | Major | $15,000–50,000 |
| interior walls/paint · The interior walls and paint are not visible, but the exterior suggests a need for fresh paint and possibly repairs. | Major | $15,000–50,000 |
| bathrooms · The bathrooms are not visible, but the listing mentions new vanities and toilets, suggesting they may need updating. | Major | $15,000–50,000 |
| kitchen · The kitchen is not visible, but the overall condition suggests it may need updating. | Major | $15,000–50,000 |
| HVAC/mechanicals · The HVAC and mechanical systems are not visible, but the overall condition suggests they may need updating. | Major | $15,000–50,000 |
| landscaping · The landscaping and curb appeal are poor, with overgrown vegetation and a lack of maintenance. | Major | $15,000–50,000 |
| Total estimated repair cost · 8 items | $120,000–400,000 |
Value-add ROI direction
- Both landscaping and curb appeal — Improving the landscaping and curb appeal can significantly enhance the home's resale and rental value. ↑
- Both roof and exterior siding — Repairing the roof and exterior siding can improve the home's appearance and increase its value. ↑
- Both interior walls and paint — Updating the interior walls and paint can improve the home's appearance and increase its value. ↑
- Both bathrooms and kitchen — Updating the bathrooms and kitchen can improve the home's functionality and increase its value. ↑
- Both HVAC and mechanical systems — Updating the HVAC and mechanical systems can improve the home's comfort and increase its value. ↑
- Both flooring — Replacing the flooring can improve the home's appearance and increase its value. ↑
ⓘ Cost ranges are severity-bucket heuristics (US national rule-of-thumb). Get contractor quotes + a written scope before underwriting a rehab budget.
Schools (NCES district)
- District
- Liberty County
- NCES district ID
- 1303300
- Math proficiency
- 19% ▼ -16.00%
- Reading proficiency
- 28% ▼ -13.00%
- Median HH income
- $43,911
- Composite
- 20.2/100
- National rank
- #8630
- State rank
- #133 of 174 in GA
Livability — Midway
- Score
- 65/100
- State rank
- #219
- US rank
- #12952
Category grades
Schools grade is shown separately in the Schools card above.
Census & demographics
- Census place
- Midway, GA
- County
- Liberty County · 58,565 people
- City population
- 10,794
- Metro
- Hinesville, GA
- Population (ZIP)
- 10,794
- Household income
- $77,195
- Rent vs Own
- Severe rent burden
- 136.0
Population outlook (Liberty County) Hauer SSP2
- Today (2025)
- 58,689 people
- By 2030
- 57,670 · -1.7%
- By 2040
- 55,750 · -5.0%
- By 2050
- 54,155 · -7.7%
- By 2075
- 58,947 · +0.4%
- By 2100
- 66,919 · +14.0%
Race, ethnicity, and origin ACS 2023
- Neighborhood character
- Diverse neighborhood (Simpson 0.57)
- Race & ethnicity
- White 56% Black 33% Two or more races 8% Hispanic / Latino 5%
- Hispanic origin (detail)
- Mexican 1% Puerto Rican 3%
- Common ancestry
- Italian 2% Slovak 2% Lithuanian 1%
- Foreign-born
- 2% · Canada
- Languages at home
- 96% English-only · Spanish 3% German/W. Germanic 1%
Political lean MEDSL · Liberty
- 2024 margin
- D (+17.4) · D 58.5% · R 41.0%
- 2008→2024 swing
- -10.9pp toward R · 2008: 28.4pp · 2024: 17.4pp
- All cycles
- 2024: D+17.4 2020: D+24.1 2016: D+21.2 2012: D+30.2 2008: D+28.4
Not yet ingested
- Civics
- —
Market trends
- HPI YoY
- ▼ -25.67%
- Current HPI
- 239.3136
- Rent YoY
- —
- Metro
- Hinesville, GA
- State GDP YoY
- ▲ 2.66%
- F500 in state
- 28
Industry mix (Fortune 500 HQ in GA)
| Industry | F500 HQs | Revenue |
|---|---|---|
| Paper / Packaging | 2 | $29B |
|
||
| Retail | 1 | $160B |
|
||
| Transportation / Logistics | 1 | $91B |
|
||
| Airlines | 1 | $62B |
|
||
| Consumer Goods | 1 | $47B |
|
||
| Utilities | 1 | $25B |
|
||
Price history
+183.6% since first listed11 events — show timeline
- 2025-10-31 Listing Removed — Hive MLS
- 2024-07-01 Listed $99,000 Hive MLS
- 2024-07-01 Listed $99,000 Hive MLS
- 2024-03-28 Listing Removed — Hive MLS
- 2024-03-28 Listing Removed — Hive MLS
- 2024-02-23 Listed $99,900 Hive MLS
- 2024-02-23 Listed $99,900 Hive MLS
- 2021-11-30 Listing Removed — Hive MLS
- 2021-03-25 Listed $75,000 Hive MLS
- 2018-03-21 Listing Removed — Hive MLS
- 2017-03-21 Listed $34,910 Hive MLS
Cash-flow waterfall
monthlySold comps — $/sqft
last 12 mo · ≤1 miLoading sold comps…