 🏗️ New Construction
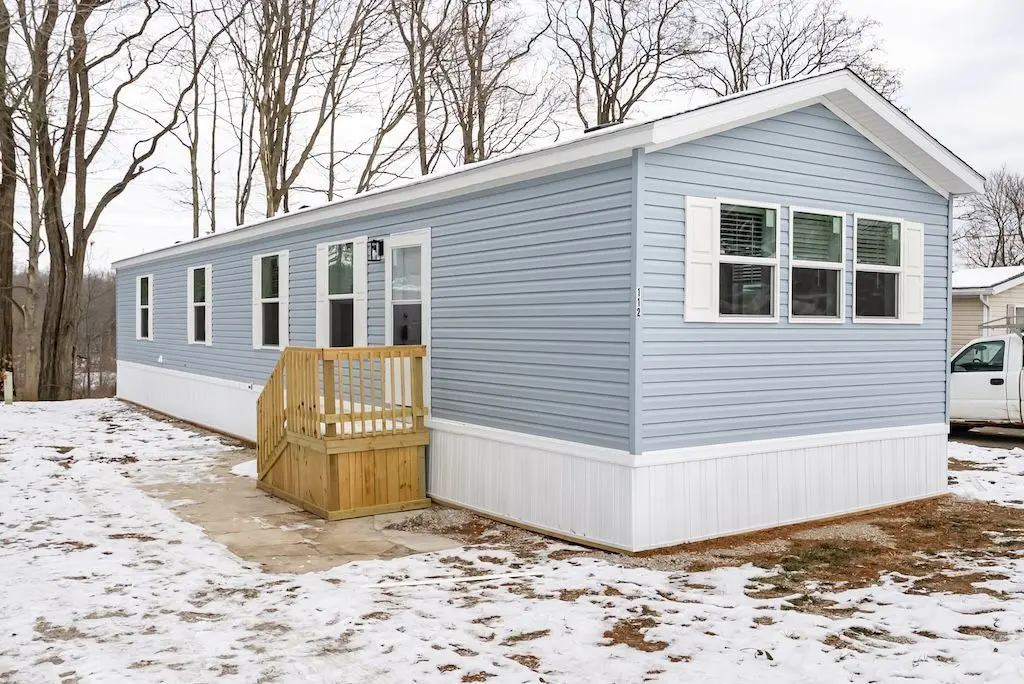
Clayton Adrenaline C Plan · Ontario, OH
Flood risk 1/10 · Minimal
- FEMA flood zone
- X (unshaded)
- Chance of flooding over 30 yrs
- 0.0%
- Est. flood insurance / yr
- $507 – $1,088
Fire risk 1/10 · Minimal
- Est. fire insurance / yr
- $713 – $1,323
Heat risk 2/10 · Minimal
- Hot days now (above 97°F)
- 7 days/yr
- Hot days in 30 yrs
- 17 days/yr
Wind risk 2/10 · Minimal
- Chance of severe wind over 30 yrs
- —
Air-quality risk 2/10 · Minimal
- Unhealthy air days now
- 0 days/yr
- Unhealthy air days in 30 yrs
- 1 days/yr
Risk factors via First Street. Map © Google.
Why this score? — see what drove the B grade
The composite is a weighted blend of 9 inputs, each scored 0–100. Each bar is that input's sub-score; the figure is the points it added to the 100-point composite (weight × sub-score).
- Cash flow +30.0/30.0
- 1% rule +10.0/10.0
- DSCR +10.0/10.0
- ARV discount +7.5/15.0
- Schools +6.3/10.0
- Condition / age +4.8/5.0
- Livability +3.3/5.0
- Rent growth +2.5/5.0
- Appreciation +0.0/10.0
$74,900
🖨 Deal sheet 📄 Offer letter ✓ Due diligence
Listing remarks MLS
This well-appointed manufactured home for sale in Mansfield, Ohio is located in the Lakeview Estates Manufactured Home Community. Featuring 3 bedrooms, 2 bathrooms, and 1,136 square feet of living space, this double-wide home offers a practical and comfortable layout ideal for everyday living. Enjoy a welcoming community setting with convenient access to shopping, dining, and major roadways.
Key facts
- 2 parking spots
- Listed 164 days
Neighborhood map
What this means for you Summary
Snapshot
- This is a 3-bed/2.0-bath manufactured listed at $75k. Condition is rated excellent.
Deal economics
- At list price, monthly cash flow is $413 ($5k/yr) — positive.
- The deal already cash-flows at list — no discount required.
- Meets the 1% rule at list price ($1k rent vs $75k).
- Recommended offer: $66k (12.0% below list) — sets the bar for market timing.
- Cap rate 12.9% vs local median 2.4% in Ontario — top-decile yield for the area; either an underpriced asset or a hidden risk that comps aren't pricing in. Stress-test before assuming the spread holds.
Location & tenants
- Location reads 66/100 on livability (#673 in OH) — a middle-class / working-renter tenant base. Strengths: cost of living A+, housing A+, schools B+; Watch: amenities F, commute F.
- Lexington Local (suburban): math 72% / reading 75% proficiency, ranked #113 of 656 in OH (top 17%) — strong family-tenant draw, lease renewals of 3-5y typical.
- Market conditions: 122 active listings in the ZIP; 129 units permitted in Morrow County in 2024 (0 in 5+ unit buildings).
Forward outlook
- Local home prices are declining (-3.0%/yr); year-one equity from $518 of loan paydown is wiped out by about $2k of value loss. Plan a longer hold.
- Morrow County population projected at -10% by 2050 — secular population decline; favor cash flow + early exit over multi-decade hold.
- At projected returns (-3.0% appreciation + 3.0% rent growth), your $21k cash investment doubles in ~6 years — after that, you're playing with house money.
Negotiation context
- It's been on market 165 days — a 12% lower offer ($66k) is reasonable based on typical stale-listing flexibility.
Questions for the listing agent
- It's been on market 165 days. Have you received any prior offers? Is the seller open to a 12% concession, seller financing, or rate buy-down credit?
- Why hasn't it sold? Are there any deal-killer items the seller is aware of (foundation, flood, title, zoning, code violations)?
- Is there a deadline driving the sale (1031 exchange, divorce, estate, relocation)? That informs how much negotiation room exists.
- Schools are B-rated — typically a magnet for longer-tenancy family renters. What's the average tenant stay here, and is there a school-zone premium baked into asking?
- What's the average days-on-market for RENTAL listings here right now (not sales)? A rising rental-DOM trend means longer vacancies and softer asking-rent achievability than the comps imply.
- What's the recent tenant-quality profile in this submarket — average credit score on applications, eviction rate, late-payment / NSF rate, and stable-employment percentage? A property-management company in the area should have these aggregated.
- How much new for-sale + rental construction is in the pipeline within 1–3 miles? Heavy new supply typically softens prices + rents 12–24 months out; constrained supply supports both.
Investment metrics
- 1% rule
- 1.57% ✓
- Cap rate
- 12.91%
- Cash-on-cash
- 23.64%
- DSCR
- 2.05
- GRM
- 5.3
CMA / ARV
No comps found within radius.
Projected returns pro-forma
-3.0% appreciation · 3.0% rent growth · sell at horizon
- IRR
- 16.8%
- Equity multiple
- 1.68×
- Total profit
- $14,199
- Equity at exit
- $11,168
- IRR
- 25.3%
- Equity multiple
- 3.21×
- Total profit
- $46,326
- Equity at exit
- $6,476
Cash invested: $20,972 (down + closing). Projections, not guarantees.
Landlord ↔ Tenant lean methodology
- Overall (STATE)
- 73 Landlord-Friendly
- State Ohio
- 73 Landlord-Friendly · R+6
- County
- — inherits STATE
- City
- — inherits STATE
ZIP-level market 44903
- Home prices YoY
- -27.7%
- Active inventory
- 122
- Price-to-rent
- 5.3×
Monthly cashflow live
- Estimated rent
- $1,178 medium interval (Pro) →
- Mortgage (P&I)
- −$393
- Tax est. 1.5%
- −$94 /mo · $1,124/yr
- Insurance
- −$31
- HOA
- −$0
- Vacancy / Maint / Mgmt
- −$247
- Net cashflow
- $413
Break-even live
UW: 25.0% down · 7.5% · 30yr · 1.5% tax · 5.0% vac · 8.0% maint · 8.0% mgmt
Financing live
Cash to close
- Down payment
- $18,725
- Closing costs
- $2,247
- Reserves months
- —
- Total cash needed
- —
Loan-product check · same deal, 3 products live
Conventional
25% down · 7.5% · 30yr
- Down + closing
- —
- Monthly P&I
- —
- Monthly cashflow
- —
- DSCR
- —
- Eligible?
- —
Personal DTI + credit; lowest rate.
DSCR
20% down · 8.5% · 30yr
- Down + closing
- —
- Monthly P&I
- —
- Monthly cashflow
- —
- DSCR
- —
- Eligible?
- —
No personal income docs; deal must DSCR.
Hard money
10% down · 12.0% · 12mo
- Down + closing
- —
- Monthly P&I
- —
- Monthly cashflow
- —
- DSCR
- —
- Eligible?
- —
Short-term bridge; refi at stabilization.
Listing history 18 events
-
2026-06-19days on market $74,900 Active 165 DOM
-
2026-06-18days on market $74,900 Active 164 DOM
-
2026-06-17days on market $74,900 Active 163 DOM
-
2026-06-16days on market $74,900 Active 162 DOM
-
2026-06-15days on market $74,900 Active 161 DOM
-
2026-06-14days on market $74,900 Active 159 DOM
-
2026-06-12days on market $74,900 Active 158 DOM
-
2026-06-09days on market $74,900 Active 155 DOM
-
2026-06-08days on market $74,900 Active 154 DOM
-
2026-06-07days on market $74,900 Active 153 DOM
-
2026-06-05days on market $74,900 Active 150 DOM
-
2026-06-03days on market $74,900 Active 149 DOM
-
2026-06-02days on market $74,900 Active 148 DOM
-
2026-06-01days on market $74,900 Active 147 DOM
-
2026-05-31days on market $74,900 Active 146 DOM
-
2026-05-30days on market $74,900 Active 145 DOM
-
2026-03-27price $74,900 394-char remark
Show marketing remark (394 chars)
This well-appointed manufactured home for sale in Mansfield, Ohio is located in the Lakeview Estates Manufactured Home Community. Featuring 3 bedrooms, 2 bathrooms, and 1,136 square feet of living space, this double-wide home offers a practical and comfortable layout ideal for everyday living. Enjoy a welcoming community setting with convenient access to shopping, dining, and major roadways.
-
2026-01-06$103,900 Active 394-char remark
Show marketing remark (394 chars)
This well-appointed manufactured home for sale in Mansfield, Ohio is located in the Lakeview Estates Manufactured Home Community. Featuring 3 bedrooms, 2 bathrooms, and 1,136 square feet of living space, this double-wide home offers a practical and comfortable layout ideal for everyday living. Enjoy a welcoming community setting with convenient access to shopping, dining, and major roadways.
ⓘ Source: listings_history table (triggers on properties + properties_extension) + one-shot
backfill from property_details.listing_events for pre-trigger history.
Climate risk First Street
- Flood 1/10 Low FEMA zone X (unshaded) · 0% chance over 30 yrs
- Wildfire 1/10 Low
- Heat 2/10 Low 7 d/yr ≥97°F today · 17 d/yr by 30 yrs out
- Wind 2/10 Low
- Air quality 2/10 Low 0 unhealthy d/yr today · 1 by 30 yrs out
Nearby sold comps map
Loading sold comps map…
Walkable amenities ~0.75 mi
Loading nearby amenities…
Taxation est. · year 1
- Rental income
- $14,139
- − Mortgage interest
- −$4,196
- − Property taxes
- −$1,124
- − Insurance
- −$374
- − Repairs & maintenance
- −$1,131
- − Management
- −$1,131
- − Depreciation
- −$2,179
- Taxable income
- $4,005
- Est. tax owed @ 24.0%
- −$961
- After-tax cash flow
- $3,998/yr
For passive investors: Depreciation is non-cash, so a rental often shows a tax loss while cash-flowing — sheltering income. Rental losses are passive: they offset passive income freely, and up to $25,000/yr can offset ordinary (W-2) income if you actively participate and your MAGI is under $100k (phasing out to $0 by $150k); unused losses carry forward. On sale, claimed depreciation is recaptured at up to 25%, and gains may owe capital-gains tax (a 1031 exchange can defer both). Figures are a year-1 estimate at your 24.0% rate — not tax advice; consult a CPA.
Condition & rehab AI · 13 photos
This well-maintained Clayton Adrenaline C Plan manufactured home in Lakeview Estates is move-in ready with excellent condition and a great location.
Value-add opportunities
- Resale Paint exterior siding — Enhances curb appeal
- Resale Replace light fixtures — Modernizes interior
- Both Install smart home devices — Improves energy efficiency and convenience
Renovation cost estimate screening
Value-add ROI direction
- Resale Paint exterior siding — Enhances curb appeal ↑
- Resale Replace light fixtures — Modernizes interior ↑
- Both Install smart home devices — Improves energy efficiency and convenience ↑
ⓘ Cost ranges are severity-bucket heuristics (US national rule-of-thumb). Get contractor quotes + a written scope before underwriting a rehab budget.
Schools (NCES district)
- District
- Lexington Local
- NCES district ID
- 3904943
- Math proficiency
- 72% ▼ -9.00%
- Reading proficiency
- 75% ▼ -4.00%
- Median HH income
- $56,984
- Composite
- 62.93/100
- National rank
- #659
- State rank
- #113 of 656 in OH
Livability — Ontario
- Score
- 66/100
- State rank
- #673
- US rank
- #11878
Category grades
Schools grade is shown separately in the Schools card above.
Census & demographics
- County
- Richland · 128,966 people
- City population
- 17,059
- Metro
- Mansfield, OH
- Population (ZIP)
- 26,804
- Household income
- $65,421
- Rent vs Own
- Severe rent burden
- 9.5
Population outlook (Morrow County) Hauer SSP2
- Today (2025)
- 35,607 people
- By 2030
- 35,482 · -0.4%
- By 2040
- 34,369 · -3.5%
- By 2050
- 32,038 · -10.0%
- By 2075
- 25,090 · -29.5%
- By 2100
- 17,123 · -51.9%
Race, ethnicity, and origin ACS 2023
- Neighborhood character
- Predominantly White (80%)
- Race & ethnicity
- White 80% Two or more races 9% Black 9% Hispanic / Latino 2% Asian 1%
- Common ancestry
- Slovak 2% Iranian 1% Romanian 1%
- Foreign-born
- 1%
- Languages at home
- 97% English-only · Spanish 1% Other Indo-European 1%
Political lean MEDSL · Morrow
- 2024 margin
- Solid R (+55.7) · D 21.7% · R 77.5%
- 2008→2024 swing
- -32.4pp toward R · 2008: -23.4pp · 2024: -55.7pp
- All cycles
- 2024: R+55.7 2020: R+54.3 2016: R+49.5 2012: R+24.6 2008: R+23.4
Not yet ingested
- Civics
- —
Market trends
- HPI YoY
- ▼ -92.50%
- Current HPI
- 241.9342
- Rent YoY
- —
- Metro
- —
- State GDP YoY
- ▲ 1.98%
- F500 in state
- 48
Industry mix (Fortune 500 HQ in OH)
| Industry | F500 HQs | Revenue |
|---|---|---|
| Insurance | 3 | $145B |
|
||
| Industrial Machinery | 3 | $49B |
|
||
| Financial Services | 3 | $24B |
|
||
| Consumer Goods | 2 | $93B |
|
||
| Aerospace / Defense | 2 | $47B |
|
||
| Utilities | 2 | $33B |
|
||
Price history
-27.9% since first listed2 events — show timeline
- 2026-03-27 Price Changed $74,900 Zillow
- 2026-01-06 Listed $103,900 Zillow
Cash-flow waterfall
monthlySold comps — $/sqft
last 12 mo · ≤1 miLoading sold comps…