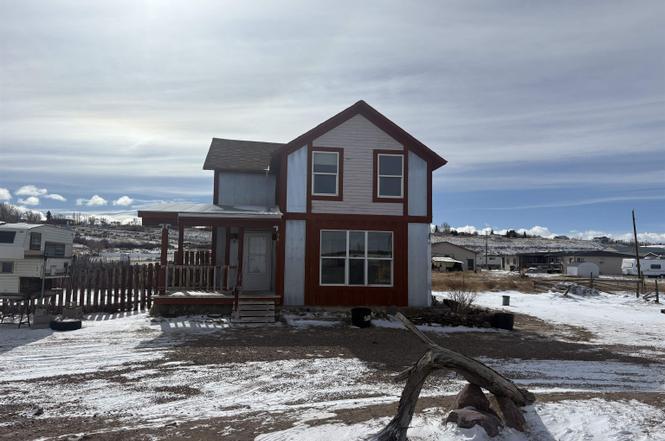
36 Brinton Rd · Lyman, WY
Flood risk 1/10 · Minimal
- FEMA flood zone
- X (unshaded)
- Chance of flooding over 30 yrs
- 0.0%
- Est. flood insurance / yr
- $507 – $1,088
Fire risk 5/10 · Moderate
- Est. fire insurance / yr
- $564 – $1,046
Heat risk 2/10 · Minimal
- Hot days now (above 85°F)
- 8 days/yr
- Hot days in 30 yrs
- 23 days/yr
Wind risk 1/10 · Minimal
- Chance of severe wind over 30 yrs
- —
Air-quality risk 1/10 · Minimal
- Unhealthy air days now
- 0 days/yr
- Unhealthy air days in 30 yrs
- 0 days/yr
Risk factors via First Street. Map © Google.
Why this score? — see what drove the C- grade
The composite is a weighted blend of 9 inputs, each scored 0–100. Each bar is that input's sub-score; the figure is the points it added to the 100-point composite (weight × sub-score).
- Cash flow +21.8/30.0
- ARV discount +7.5/15.0
- DSCR +7.0/10.0
- 1% rule +4.7/10.0
- Schools +4.3/10.0
- Livability +4.1/5.0
- Rent growth +2.5/5.0
- Condition / age +2.5/5.0
- Appreciation +0.0/10.0
$130,000
🖨 Deal sheet (PDF) 📄 Offer letter ✓ Due diligence
Key facts
- Space for garden
- Spacious lot
- Room for parking
Tags
Property features AI
Finance
- Financial info: Annual tax approximately $713
Exterior
- Parking: No garage
- Home design: Residential single family home; 2 stories
- Exterior features: 0.61-acre lot
Interior
- Heating & cooling: Has heating; Forced air
- Interior features: Forced air heating
Neighborhood map
What this means for you Summary
Snapshot
- This is a 3-bed/2.0-bath single-family listed at $130k.
Deal economics
- At list price, monthly cash flow is $201 ($2k/yr) — positive.
- The deal already cash-flows at list — no discount required.
- To meet the 1% rule (rent ≥ 1% of price), the offer needs to be $126k (3.0% below list).
- Recommended offer: $118k (9.0% below list) — sets the bar for market timing.
- Cap rate 8.2% vs local median 2.1% in Lyman — top-decile yield for the area; either an underpriced asset or a hidden risk that comps aren't pricing in. Stress-test before assuming the spread holds.
Location & tenants
- Location reads 82/100 on livability (#4 in WY, #1,119 nationally) — a professional / high-income tenant draw. Strengths: crime A+, employment A+, cost of living A+; Watch: amenities F, commute F.
- Uinta County School District #6 (rural): math 48% / reading 50% proficiency, ranked #25 of 41 in WY (top 61%) — families likely to look elsewhere, expect single-tenant / working-renter base with shorter leases; only 17% free/reduced lunch — higher-income household profile.
- Zoned schools: Urie Elementary (math 57% / reading 42%, grade D, #87 of 151 statewide, top 64%, 247 students, 25% FRL); Lyman Intermediate School (math 51% / reading 57%, grade B-, #29 of 55 statewide, top 54%, 243 students, 21% FRL); Lyman High School (math 37% / reading 47%, grade F, #47 of 75 statewide, top 66%, 235 students, 20% FRL) — zoned schools at 22% FRL track the district average.
- Market conditions: 55 active listings in the ZIP; 50 units permitted in Uinta County in 2024 (0 in 5+ unit buildings).
Forward outlook
- Local home prices are declining (-3.0%/yr); year-one equity from $899 of loan paydown is wiped out by about $4k of value loss. Plan a longer hold.
- Uinta County population projected at -21% by 2050 — secular population decline; favor cash flow + early exit over multi-decade hold.
Negotiation context
- It's been on market 117 days — a 9% lower offer ($118k) is reasonable based on typical stale-listing flexibility.
- 3 sale attempts since 10y ago with the ask held roughly flat each time — persistent listings suggest the price (not the market) is what's stuck; bring a comps-based counter.
Risks & watch-outs
- Watch-outs: built in 1920 — expect roof / HVAC / electrical / plumbing capex.
- Climate carrying-cost: moderate wildfire risk — expect insurance premiums to compound above CPI over the hold.
Questions for the listing agent
- It's been on market 117 days. Have you received any prior offers? Is the seller open to a 9% concession, seller financing, or rate buy-down credit?
- Built in 1920 — when were the roof, HVAC, electrical panel, plumbing, and water heater last replaced?
- Why hasn't it sold? Are there any deal-killer items the seller is aware of (foundation, flood, title, zoning, code violations)?
- Is there a deadline driving the sale (1031 exchange, divorce, estate, relocation)? That informs how much negotiation room exists.
- What's the average days-on-market for RENTAL listings here right now (not sales)? A rising rental-DOM trend means longer vacancies and softer asking-rent achievability than the comps imply.
- What's the recent tenant-quality profile in this submarket — average credit score on applications, eviction rate, late-payment / NSF rate, and stable-employment percentage? A property-management company in the area should have these aggregated.
- How much new for-sale + rental construction is in the pipeline within 1–3 miles? Heavy new supply typically softens prices + rents 12–24 months out; constrained supply supports both.
Investment metrics
- 1% rule
- 0.97% ✗
- Cap rate
- 8.15%
- Cash-on-cash
- 6.63%
- DSCR
- 1.30
- GRM
- 8.6
CMA / ARV
- ARV (on-the-fly)
- $282,317
- Comps found
- 6
Show comp detail 6 sales within ~0.75 mi
| Address | Dist | Beds/Ba | Sqft | Sold | Price | $/sf | Match |
|---|---|---|---|---|---|---|---|
| 121 E Walnut St | 0.59mi | 3/2.0 | 1,236 (-5%) | 9mo | $234,800 | $190 | 57 |
| 125 W Pine St | 0.62mi | 3/2.0 | 1,235 (-5%) | 13mo | $325,000 | $263 | 52 |
| 331 Village Dr | 0.75mi | 3/2.0 | 1,252 (-4%) | 9mo | $259,000 | $207 | 51 |
| 215 East St N | 0.60mi | 3/2.5 | 1,424 (+10%) | 5mo | $309,000 | $217 | 50 |
| 221 East St N | 0.61mi | 3/2.5 | 1,424 (+10%) | 6mo | $309,000 | $217 | 49 |
| 224 W Walnut Street St | 0.51mi | 3/1.8 | 1,496 (+15%) | 24mo | $249,900 | $167 | 31 |
Match score weights: distance 35% · size 25% · config 20% · recency 20%. Top-matched comps best support the ARV.
Projected returns pro-forma
-3.0% appreciation · 3.0% rent growth · sell at horizon
- IRR
- -6.1%
- Equity multiple
- 0.77×
- Total profit
- $-8,296
- Equity at exit
- $19,383
- IRR
- 3.5%
- Equity multiple
- 1.25×
- Total profit
- $9,097
- Equity at exit
- $11,240
Cash invested: $36,400 (down + closing). Projections, not guarantees.
Landlord ↔ Tenant lean methodology
- Overall (STATE)
- 90 Strongly Landlord-Friendly
- State Wyoming
- 90 Strongly Landlord-Friendly · R+25
- County
- — inherits STATE
- City
- — inherits STATE
ZIP-level market 82937
- Home prices YoY
- -26.8%
- Active inventory
- 55
- Price-to-rent
- 8.6×
Monthly cashflow live
- Estimated rent
- $1,261 medium interval (Pro) →
- Mortgage (P&I)
- −$682
- Tax from tax record
- −$59 /mo · $714/yr
- Insurance
- −$54
- HOA
- −$0
- Vacancy / Maint / Mgmt
- −$265
- Net cashflow
- $201
Break-even live
Sensitivity live
| Price | -10% $275 | -5% $238 | +0% $201 | +5% $164 | +10% $128 |
|---|---|---|---|---|---|
| Rent | -10% $102 | -5% $151 | +0% $201 | +5% $251 | +10% $301 |
| Rate | -1.0pp $267 | -0.5pp $234 | base $201 | +0.5pp $168 | +1.0pp $133 |
UW: 25.0% down · 7.5% · 30yr · 1.5% tax · 5.0% vac · 8.0% maint · 8.0% mgmt
Financing live
Cash to close
- Down payment
- $32,500
- Closing costs
- $3,900
- Reserves months
- —
- Total cash needed
- —
Loan-product check · same deal, 3 products live
Conventional
25% down · 7.5% · 30yr
- Down + closing
- —
- Monthly P&I
- —
- Monthly cashflow
- —
- DSCR
- —
- Eligible?
- —
Personal DTI + credit; lowest rate.
DSCR
20% down · 8.5% · 30yr
- Down + closing
- —
- Monthly P&I
- —
- Monthly cashflow
- —
- DSCR
- —
- Eligible?
- —
No personal income docs; deal must DSCR.
Hard money
10% down · 12.0% · 12mo
- Down + closing
- —
- Monthly P&I
- —
- Monthly cashflow
- —
- DSCR
- —
- Eligible?
- —
Short-term bridge; refi at stabilization.
Listing history 27 events
-
2026-06-21days on market $130,000 Active 117 DOM
-
2026-06-21days on market $130,000 Active 116 DOM
-
2026-06-18days on market $130,000 Active 114 DOM
-
2026-06-17days on market $130,000 Active 113 DOM
-
2026-06-16days on market $130,000 Active 112 DOM
-
2026-06-15days on market $130,000 Active 111 DOM
-
2026-06-15days on market $130,000 Active 110 DOM
-
2026-06-13days on market $130,000 Active 109 DOM
-
2026-06-12days on market $130,000 Active 108 DOM
-
2026-06-09days on market $130,000 Active 105 DOM
-
2026-06-08days on market $130,000 Active 104 DOM
-
2026-06-08days on market $130,000 Active 103 DOM
-
2026-06-05days on market $130,000 Active 101 DOM
-
2026-06-04days on market $130,000 Active 100 DOM
-
2026-06-03days on market $130,000 Active 99 DOM
-
2026-06-02days on market $130,000 Active 98 DOM
-
2026-06-01days on market $130,000 Active 97 DOM
-
2026-05-31days on market $130,000 Active 96 DOM
-
2026-02-24$130,000 Active
-
2021-05-07$139,900
-
2016-01-20$159,900
-
2008-11-07soldstatus
-
2008-01-18soldstatus
-
2008-01-18soldstatus
-
2004-05-07soldstatus
-
1997-08-08soldstatus
-
1992-02-21soldstatus
ⓘ Source: listings_history table (triggers on properties + properties_extension) + one-shot
backfill from property_details.listing_events for pre-trigger history.
Tax reassessment forecast WY · Resets to sale price
- Current annual tax
- $714 · $59/mo
- Projected year-2 tax
- $793 · $66/mo
- Expected delta
- +$79/yr (+$7/mo · 11.1%)
ⓘ Screening estimate from a state-policy table — verify with the county assessor before closing.
Climate risk First Street
- Flood 1/10 Low FEMA zone X (unshaded) · 0% chance over 30 yrs
- Wildfire 5/10 Major
- Heat 2/10 Low 8 d/yr ≥85°F today · 23 d/yr by 30 yrs out
- Wind 1/10 Low
- Air quality 1/10 Low 0 unhealthy d/yr today · 0 by 30 yrs out
Nearby sold comps map
Loading sold comps map…
Walkable amenities ~0.75 mi
Loading nearby amenities…
Taxation est. · year 1
- Rental income
- $15,138
- − Mortgage interest
- −$7,282
- − Property taxes
- −$714
- − Insurance
- −$650
- − Repairs & maintenance
- −$1,211
- − Management
- −$1,211
- − Depreciation
- −$3,782
- Taxable income
- $288
- Est. tax owed @ 24.0%
- −$69
- After-tax cash flow
- $2,345/yr
For passive investors: Depreciation is non-cash, so a rental often shows a tax loss while cash-flowing — sheltering income. Rental losses are passive: they offset passive income freely, and up to $25,000/yr can offset ordinary (W-2) income if you actively participate and your MAGI is under $100k (phasing out to $0 by $150k); unused losses carry forward. On sale, claimed depreciation is recaptured at up to 25%, and gains may owe capital-gains tax (a 1031 exchange can defer both). Figures are a year-1 estimate at your 24.0% rate — not tax advice; consult a CPA.
Schools (NCES district)
- District
- Uinta County School District #6
- NCES district ID
- 5604260
- Math proficiency
- 48% ▼ -1.00%
- Reading proficiency
- 50% ▼ -5.00%
- Median HH income
- $66,060
- Composite
- 43.49/100
- National rank
- #2997
- State rank
- #25 of 41 in WY
Livability — Lyman
- Score
- 82/100
- State rank
- #4
- US rank
- #1119
Category grades
Schools grade is shown separately in the Schools card above.
Census & demographics
- Population (ZIP)
- 3,236
Population outlook (Uinta County) Hauer SSP2
- Today (2025)
- 19,871 people
- By 2030
- 19,106 · -3.8%
- By 2040
- 17,394 · -12.5%
- By 2050
- 15,715 · -20.9%
- By 2075
- 12,193 · -38.6%
- By 2100
- 9,429 · -52.5%
Race, ethnicity, and origin ACS 2023
- Neighborhood character
- Predominantly White (84%)
- Race & ethnicity
- White 84% Hispanic / Latino 11% Two or more races 7%
- Hispanic origin (detail)
- Mexican 10%
- Common ancestry
- Slovak 8% Portuguese 7% Serbian 6%
- Foreign-born
- 2% · China, Canada
- Languages at home
- 98% English-only · Spanish 1% Other Asian/Pacific 1%
Political lean MEDSL · Uinta
- 2024 margin
- Solid R (+63.7) · D 17.4% · R 81.1% · Other 1.6%
- 2008→2024 swing
- -22.6pp toward R · 2008: -41.1pp · 2024: -63.7pp
- All cycles
- 2024: R+63.7 2020: R+62.8 2016: R+61.5 2012: R+59.0 2008: R+41.1
Not yet ingested
- Civics
- —
Market trends
- HPI YoY
- ▼ -75.90%
- Current HPI
- 207.2569
- Rent YoY
- —
- Metro
- —
- State GDP YoY
- —
- F500 in state
- 0
Price history
-18.7% since first listed9 events — show timeline
- 2026-02-24 Listed $130,000 WMLS
- 2021-05-07 Listed $139,900 WMLS
- 2016-01-20 Listed $159,900 WMLS
- 2008-11-07 Sold (Public Records) — Public Records
- 2008-01-18 Sold (Public Records) — Public Records
- 2008-01-18 Sold (Public Records) — Public Records
- 2004-05-07 Sold (Public Records) — Public Records
- 1997-08-08 Sold (Public Records) — Public Records
- 1992-02-21 Sold (Public Records) — Public Records
Property tax history
+1.1%/yrLatest (2025): $714 · -22.8% YoY. Source: county tax records.
Cash-flow waterfall
monthlySold comps — $/sqft
last 12 mo · ≤1 miLoading sold comps…