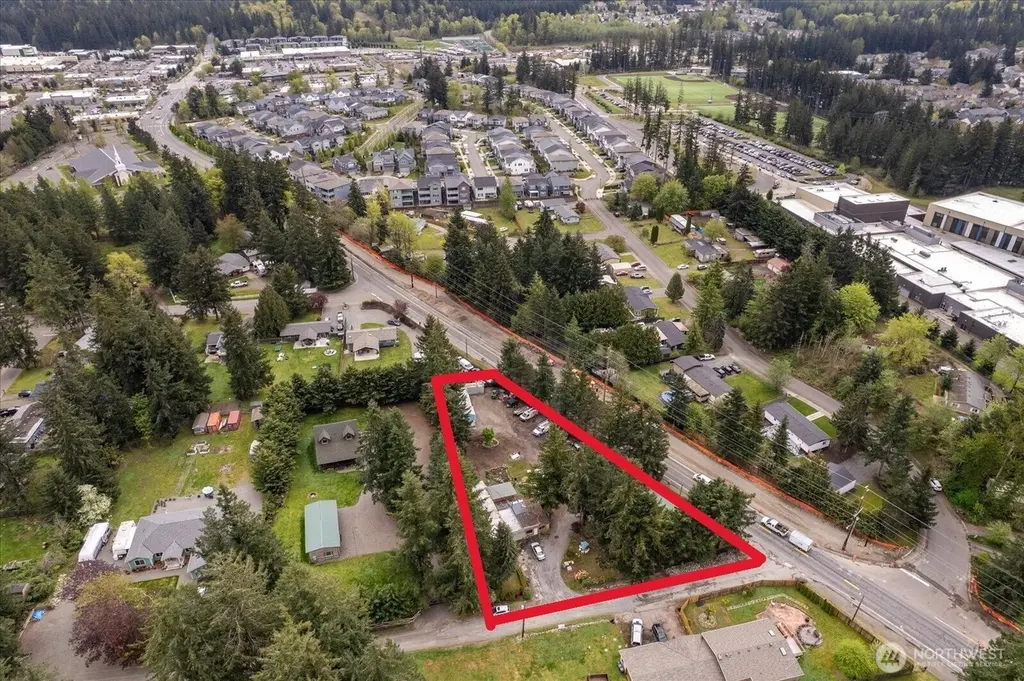
27018 233rd Pl SE · Maple Valley, WA
Flood risk 1/10 · Minimal
- FEMA flood zone
- X (unshaded)
- Chance of flooding over 30 yrs
- 0.0%
- Est. flood insurance / yr
- $507 – $1,088
Fire risk 1/10 · Minimal
- Est. fire insurance / yr
- $604 – $1,122
Heat risk 2/10 · Minimal
- Hot days now (above 87°F)
- 7 days/yr
- Hot days in 30 yrs
- 15 days/yr
Wind risk 1/10 · Minimal
- Chance of severe wind over 30 yrs
- —
Air-quality risk 7/10 · Major
- Unhealthy air days now
- 11 days/yr
- Unhealthy air days in 30 yrs
- 16 days/yr
Risk factors via First Street. Map © Google.
Why this score? — see what drove the D- grade
The composite is a weighted blend of 9 inputs, each scored 0–100. Each bar is that input's sub-score; the figure is the points it added to the 100-point composite (weight × sub-score).
- Cash flow +10.1/30.0
- ARV discount +7.5/15.0
- Schools +6.6/10.0
- Livability +4.2/5.0
- Rent growth +3.2/5.0
- 1% rule +2.9/10.0
- DSCR +2.9/10.0
- Condition / age +2.5/5.0
- Appreciation +0.0/10.0
$325,000
🖨 Deal sheet (PDF) 📄 Offer letter ✓ Due diligence
Listing remarks
Located in the heart of Maple Valley just outside Four Corners and conveniently off Kent Kangley Road, this 37,360 sq ft parcel presents an exceptional opportunity for future land banking or potential redevelopment. Zoned R-6, the property offers flexibility for long-term investment strategies in a rapidly growing area. The site includes a 1977 single-wide manufactured home served by a 2-bedroom septic system. Supporting improvements include a 48’ x 24’ (approx. 2.5-car) garage featuring a 3/4 bath, office space, and kitchenette—ideal for onsite operations or storage support. A second 48’ x 24’ metal building provides additional covered parking and storage with
Key facts
- 0.84 acre lot
- Garage
- Built 1977
Property features AI
Finance
- Other: Zoning: R6 (city jurisdiction); Lot size about 0.8372 acres (value in land noted)
- Financial info: Financing accepted: Cash, Conventional, FHA, VA
Exterior
- Parking: Covered parking available (7 covered spaces); Uncovered parking for 6 vehicles; Detached garage and detached carport; Driveway and off-street parking; RV parking; Garage area approximately 1,300 sq. ft.
- Security: Partially fenced yard
- Utilities: Public water (Covington Water); Septic sewer system; Electric power (Puget Sound Energy); Energy sources: Electric and wood
- Home design: Manufactured single-wide home on land; Single-story; Main-level entry; Facing direction not specified; Manufactured home make: Homette, model 70' x 14'; Property condition: Average
- Construction: Built/effective year 1977; Block and pier/pillar/post foundation; Metal and torch-down roofs; Construction materials: Metal/vinyl and wood
- Exterior features: Metal/vinyl and wood exterior; Partially fenced; Outbuildings; RV parking; Cable TV available; Fruit trees and garden space; Located on a dead-end street; Property has a view
Interior
- Bedrooms: 2 bedrooms (both on the main level)
- Flooring: Vinyl flooring; Carpet
- Bathrooms: 2 full bathrooms (both on the main level); 2 bathtubs and 2 showers
- Heating & cooling: Forced air heating; Wood stove / free-standing stove; No central air conditioning
- Interior features: Water heater; No basement
- Laundry & utility: Electric water heater located in the laundry room
Neighborhood map
What this means for you Summary
Snapshot
- This is a 2-bed/2.0-bath manufactured listed at $325k.
Deal economics
- At list price, monthly cash flow is $-191 ($-2k/yr) — negative.
- To cash-flow at today's rent, offer at most $291k (10.4% below list).
- To meet the 1% rule (rent ≥ 1% of price), the offer needs to be $256k (21.4% below list).
- Recommended offer: $256k (21.4% below list) — sets the bar for 1% rule.
- Cap rate 5.6% vs local median 3.2% in Maple Valley — top-decile yield for the area; either an underpriced asset or a hidden risk that comps aren't pricing in. Stress-test before assuming the spread holds.
Location & tenants
- Location reads 85/100 on livability (#24 in WA, #461 nationally) — a professional / high-income tenant draw. Strengths: employment A+, housing A+, health & safety A+; Watch: cost of living F.
- Tahoma School District (suburban): math 68% / reading 76% proficiency, ranked #10 of 291 in WA (top 3%) — strong family-tenant draw, lease renewals of 3-5y typical; only 11% free/reduced lunch — higher-income household profile.
- Zoned schools: Cedar River Elementary (601 students, 12% FRL); Maple View Middle School (1,009 students, 24% FRL); Tahoma Senior High School (2,790 students, 19% FRL).
- Market conditions: Rents rising (+2.8%/yr); 226 active listings in the ZIP; 1 comparable units currently listed for rent nearby; high-income renter base; 10,555 units permitted in King County in 2024 (7,119 in 5+ unit buildings).
Forward outlook
- Local home prices are declining (-3.0%/yr); year-one equity from $2k of loan paydown is wiped out by about $10k of value loss. Plan a longer hold.
- King County population projected at +44% by 2050 — long-run rental-demand tailwind backs the buy-and-hold thesis.
Negotiation context
- Only 1 days on market — expect competitive offers; lowballing is unlikely to land.
- 2 sale attempts since 8y ago with the ask held roughly flat each time — persistent listings suggest the price (not the market) is what's stuck; bring a comps-based counter.
- Current owner paid $165k; list at $325k implies a 97% gain — meaningful room to come down on a strong offer.
Questions for the listing agent
- What do current leases actually rent for vs. the listed asking? Can we see a recent rent roll and the last 12 months of T-12 income?
- Built in 1977 — when were the roof, HVAC, electrical panel, plumbing, and water heater last replaced?
- Is there a deadline driving the sale (1031 exchange, divorce, estate, relocation)? That informs how much negotiation room exists.
- Schools are A-rated — typically a magnet for longer-tenancy family renters. What's the average tenant stay here, and is there a school-zone premium baked into asking?
- The area grade is low — what's the realistic commute time and amenity access for the typical tenant pool here? Any planned neighborhood developments (good or bad) we should know about?
- What's the average days-on-market for RENTAL listings here right now (not sales)? A rising rental-DOM trend means longer vacancies and softer asking-rent achievability than the comps imply.
- What's the recent tenant-quality profile in this submarket — average credit score on applications, eviction rate, late-payment / NSF rate, and stable-employment percentage? A property-management company in the area should have these aggregated.
- How much new for-sale + rental construction is in the pipeline within 1–3 miles? Heavy new supply typically softens prices + rents 12–24 months out; constrained supply supports both.
Investment metrics
- 1% rule
- 0.79% ✗
- Cap rate
- 5.59%
- Cash-on-cash
- -2.52%
- DSCR
- 0.89
- GRM
- 10.6
CMA / ARV
- ARV (on-the-fly)
- $325,248
- Comps found
- 1
Show comp detail 1 sale within ~0.75 mi
| Address | Dist | Beds/Ba | Sqft | Sold | Price | $/sf | Match |
|---|---|---|---|---|---|---|---|
| 27018 233rd Pl SE | 0.00mi | 2/2.0 | 924 (0%) | 1mo | $325,000 | $352 | 99 |
Match score weights: distance 35% · size 25% · config 20% · recency 20%. Top-matched comps best support the ARV.
Projected returns pro-forma
-3.0% appreciation · 2.76% rent growth · sell at horizon
- IRR
- -20.7%
- Equity multiple
- 0.28×
- Total profit
- $-65,432
- Equity at exit
- $48,459
- IRR
- -14.6%
- Equity multiple
- 0.17×
- Total profit
- $-75,093
- Equity at exit
- $28,100
Cash invested: $91,000 (down + closing). Projections, not guarantees.
Landlord ↔ Tenant lean methodology
- Overall (STATE)
- 28 Tenant-Leaning
- State Washington
- 28 Tenant-Leaning · D+8
- County
- — inherits STATE
- City
- — inherits STATE
ZIP-level market 98038
- Rents YoY
- 2.8%
- Active inventory
- 226
- Price-to-rent
- 10.6×
Monthly cashflow live
- Estimated rent
- $2,556 medium interval (Pro) →
- Mortgage (P&I)
- −$1,704
- Tax from tax record
- −$370 /mo · $4,445/yr
- Insurance
- −$135
- HOA
- −$0
- Vacancy / Maint / Mgmt
- −$537
- Net cashflow
- $-191
Break-even live
Sensitivity live
| Price | -10% $-7 | -5% $-99 | +0% $-191 | +5% $-283 | +10% $-375 |
|---|---|---|---|---|---|
| Rent | -10% $-393 | -5% $-292 | +0% $-191 | +5% $-90 | +10% $11 |
| Rate | -1.0pp $-27 | -0.5pp $-108 | base $-191 | +0.5pp $-275 | +1.0pp $-361 |
UW: 25.0% down · 7.5% · 30yr · 1.5% tax · 5.0% vac · 8.0% maint · 8.0% mgmt
Financing live
Cash to close
- Down payment
- $81,250
- Closing costs
- $9,750
- Reserves months
- —
- Total cash needed
- —
Loan-product check · same deal, 3 products live
Conventional
25% down · 7.5% · 30yr
- Down + closing
- —
- Monthly P&I
- —
- Monthly cashflow
- —
- DSCR
- —
- Eligible?
- —
Personal DTI + credit; lowest rate.
DSCR
20% down · 8.5% · 30yr
- Down + closing
- —
- Monthly P&I
- —
- Monthly cashflow
- —
- DSCR
- —
- Eligible?
- —
No personal income docs; deal must DSCR.
Hard money
10% down · 12.0% · 12mo
- Down + closing
- —
- Monthly P&I
- —
- Monthly cashflow
- —
- DSCR
- —
- Eligible?
- —
Short-term bridge; refi at stabilization.
Rent comps 1 comps
| Address | Beds | Baths | Sqft | Rent | $/sqft | DOM | Units | Dist |
|---|---|---|---|---|---|---|---|---|
| 26285 238th Ln SE Maple Valley, WA | 1.0–3.0 | 1.0–2.0 | 865 | $2,462 | $2.85 | 0d | 9 | 0.57mi |
Listing history 7 events
-
2026-05-02status Pending
-
2026-04-30$325,000 Active
-
2018-06-21soldstatus $165,000 Sold
-
2018-05-11status Pending
-
2018-05-11$165,000 Active
-
2010-06-30soldstatus $160,000
-
2000-01-19soldstatus $95,000
ⓘ Source: listings_history table (triggers on properties + properties_extension) + one-shot
backfill from property_details.listing_events for pre-trigger history.
Tax reassessment forecast WA · Resets to sale price
- Current annual tax
- $4,445 · $370/mo
- Projected year-2 tax
- $4,445 · $370/mo
- Expected delta
- $0/yr ($0/mo · 0.0%)
ⓘ Screening estimate from a state-policy table — verify with the county assessor before closing.
Climate risk First Street
- Flood 1/10 Low FEMA zone X (unshaded) · 0% chance over 30 yrs
- Wildfire 1/10 Low
- Heat 2/10 Low 7 d/yr ≥87°F today · 15 d/yr by 30 yrs out
- Wind 1/10 Low
- Air quality 7/10 Severe 11 unhealthy d/yr today · 16 by 30 yrs out
Nearby sold comps map
Loading sold comps map…
Walkable amenities ~0.75 mi
Loading nearby amenities…
Taxation est. · year 1
- Rental income
- $30,670
- − Mortgage interest
- −$18,205
- − Property taxes
- −$4,445
- − Insurance
- −$1,625
- − Repairs & maintenance
- −$2,454
- − Management
- −$2,454
- − Depreciation
- −$9,455
- Taxable loss
- −$7,967
- Est. tax savings @ 24.0%
- +$1,912
- After-tax cash flow
- $-381/yr
For passive investors: Depreciation is non-cash, so a rental often shows a tax loss while cash-flowing — sheltering income. Rental losses are passive: they offset passive income freely, and up to $25,000/yr can offset ordinary (W-2) income if you actively participate and your MAGI is under $100k (phasing out to $0 by $150k); unused losses carry forward. On sale, claimed depreciation is recaptured at up to 25%, and gains may owe capital-gains tax (a 1031 exchange can defer both). Figures are a year-1 estimate at your 24.0% rate — not tax advice; consult a CPA.
Schools (NCES district)
- District
- Tahoma School District
- NCES district ID
- 5308760
- Math proficiency
- 68% ▬ 0.00%
- Reading proficiency
- 76% ▬ 0.00%
- Median HH income
- $94,834
- Composite
- 66.41/100
- National rank
- #925
- State rank
- #10 of 291 in WA
Livability — Maple Valley
- Score
- 85/100
- State rank
- #24
- US rank
- #461
Category grades
Schools grade is shown separately in the Schools card above.
Census & demographics
- Census place
- Maple Valley, WA
- County
- King County · 2,251,916 people
- City population
- 37,324
- Metro
- Seattle-Tacoma-Bellevue, WA
- Population (ZIP)
- 37,324
- Household income
- $152,261
- Rent vs Own
- Severe rent burden
- 580.0
Population outlook (King County) Hauer SSP2
- Today (2025)
- 2,576,485 people
- By 2030
- 2,803,316 · +8.8%
- By 2040
- 3,255,921 · +26.4%
- By 2050
- 3,706,444 · +43.9%
- By 2075
- 4,746,063 · +84.2%
- By 2100
- 5,407,730 · +109.9%
Race, ethnicity, and origin ACS 2023
- Neighborhood character
- Predominantly White (73%)
- Race & ethnicity
- White 73% Asian 10% Two or more races 9% Hispanic / Latino 6% Black 2%
- Hispanic origin (detail)
- Mexican 3%
- Common ancestry
- Portuguese 5% Italian 4% Romanian 3%
- Foreign-born
- 13% · Canada, China, South Korea
- Languages at home
- 86% English-only · Other Asian/Pacific 4% Russian/Polish/Slavic 3% Other Indo-European 2%
Political lean MEDSL · King
- 2024 margin
- Solid D (+51.7) · D 74.2% · R 22.5% · Other 3.4%
- 2008→2024 swing
- +9.6pp toward D · 2008: 42.1pp · 2024: 51.7pp
- All cycles
- 2024: D+51.7 2020: D+52.7 2016: D+50.4 2012: D+39.9 2008: D+42.1
Not yet ingested
- Civics
- —
Market trends
- HPI YoY
- ▼ -588.79%
- Current HPI
- 310.7428
- Rent YoY
- ▲ 2.76%
- Metro
- Seattle-Tacoma-Bellevue, WA
- State GDP YoY
- ▲ 4.65%
- F500 in state
- 22
Industry mix (Fortune 500 HQ in WA)
| Industry | F500 HQs | Revenue |
|---|---|---|
| Retail | 2 | $269B |
|
||
| Technology / Retail | 1 | $638B |
|
||
| Technology | 1 | $245B |
|
||
| Telecommunications | 1 | $38B |
|
||
| Food / Beverage | 1 | $36B |
|
||
| Automotive / Trucks | 1 | $34B |
|
||
Price history
+242.1% since first listed7 events — show timeline
- 2026-05-02 Pending — NWMLS as Distributed by MLS Grid
- 2026-04-30 Listed $325,000 NWMLS as Distributed by MLS Grid
- 2018-06-21 Sold (MLS) $165,000 NWMLS as Distributed by MLS Grid
- 2018-05-11 Pending — NWMLS as Distributed by MLS Grid
- 2018-05-11 Listed $165,000 NWMLS as Distributed by MLS Grid
- 2010-06-30 Sold (Public Records) $160,000 Public Records
- 2000-01-19 Sold (Public Records) $95,000 Public Records
Property tax history
+3.8%/yrLatest (2025): $4,445 · +21.8% YoY. Source: county tax records.
Cash-flow waterfall
monthlySold comps — $/sqft
last 12 mo · ≤1 miLoading sold comps…