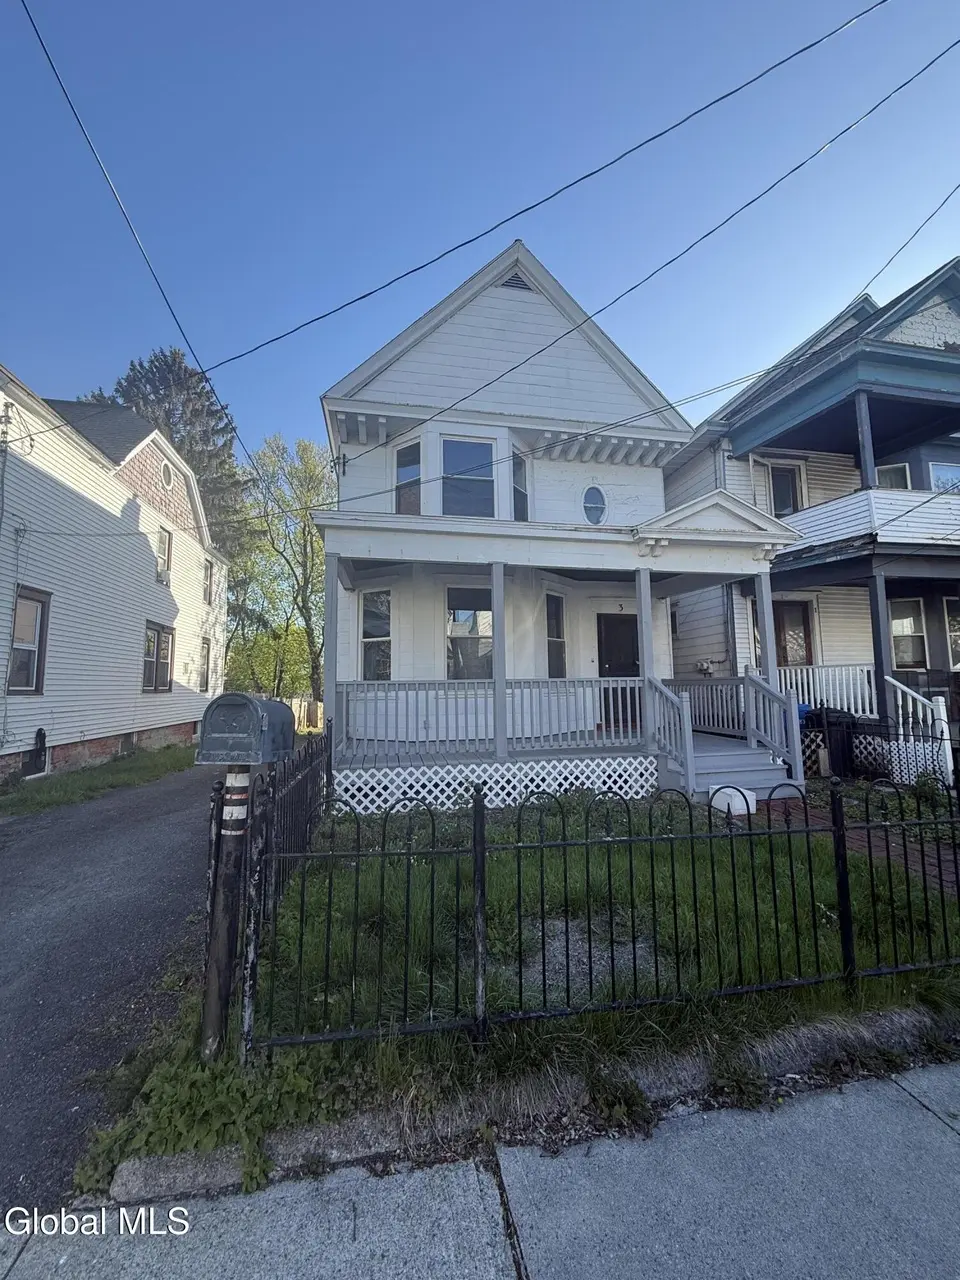
3 Providence Pl · Albany, NY
Flood risk 1/10 · Minimal
- FEMA flood zone
- X (unshaded)
- Chance of flooding over 30 yrs
- 0.0%
- Est. flood insurance / yr
- $473 – $860
Fire risk 3/10 · Minor
- Est. fire insurance / yr
- $691 – $1,283
Heat risk 4/10 · Minor
- Hot days now (above 99°F)
- 7 days/yr
- Hot days in 30 yrs
- 16 days/yr
Wind risk 3/10 · Minor
- Chance of severe wind over 30 yrs
- 6.0%
Air-quality risk 1/10 · Minimal
- Unhealthy air days now
- 0 days/yr
- Unhealthy air days in 30 yrs
- 0 days/yr
Risk factors via First Street. Map © Google.
Why this score? — see what drove the B+ grade
The composite is a weighted blend of 9 inputs, each scored 0–100. Each bar is that input's sub-score; the figure is the points it added to the 100-point composite (weight × sub-score).
- Cash flow +25.2/30.0
- ARV discount +15.0/15.0
- Appreciation +10.0/10.0
- DSCR +8.3/10.0
- 1% rule +6.6/10.0
- Rent growth +4.7/5.0
- Livability +4.0/5.0
- Schools +3.2/10.0
- Condition / age +2.2/5.0
$209,000
🖨 Deal sheet (PDF) 📄 Offer letter ✓ Due diligence
Listing remarks MLS
This lovely 4 bedroom colonial is a must see for all investors or first time home buyers! Hardwood flooring, newer appliances, roof and furnace have both been replaced within the last 5 years. This characteristic home is located on a very quiet dead end street and is a short drive away from the surrounding colleges and hospitals. Schedule your showing today!!
Key facts
- Walk out basement
- 3,920 sq ft lot
- 5 parking spots
Tags
Property features AI
Exterior
- Parking: Driveway with space for 5 vehicles
- Utilities: Public water; Public sewer
- Home design: Single family residence; Wood siding construction
- Construction: Block foundation
- Exterior features: Asphalt shingle roof
Interior
- Kitchen: Dishwasher; Range; Microwave
- Bedrooms: Bedrooms on first and second floors (mix of first- and second-floor bedrooms)
- Flooring: Vinyl flooring; Hardwood flooring
- Bathrooms: 2 full bathrooms (one on the first floor, one on the second floor)
- Heating & cooling: Baseboard heating; Hot water heating; Natural gas
- Interior features: 8 total rooms; Full walk-out basement
- Laundry & utility: Laundry in basement
Neighborhood map
What this means for you Summary
Snapshot
- This is a 5-bed/2.0-bath single-family listed at $209k. Condition is rated fair.
Deal economics
- At list price, monthly cash flow is $471 ($6k/yr) — positive.
- The deal already cash-flows at list — no discount required.
- Meets the 1% rule at list price ($2k rent vs $209k).
- Cap rate 9.0% vs local median 5.7% in Albany — top-decile yield for the area; either an underpriced asset or a hidden risk that comps aren't pricing in. Stress-test before assuming the spread holds.
Location & tenants
- Location reads 79/100 on livability (#129 in NY, #2,083 nationally) — a middle-class / working-renter tenant base. Strengths: amenities A+, commute A+, housing A+; Watch: employment C-, crime F.
- Albany City School District (urban): math 37% / reading 40% proficiency, ranked #543 of 590 in NY (top 92%) — families likely to look elsewhere, expect single-tenant / working-renter base with shorter leases; 66% free/reduced lunch — lower-income household profile, screen leases tightly.
- Zoned schools: Albany High School (math 74% / reading 67%, grade B+, #710 of 1,100 statewide, top 65%, 2,676 students, 69% FRL) — zoned schools at 69% FRL track the district average.
- Zoned-school proficiency averages 70% at this address vs 38% district-wide (+32 pts) — the actual schools serving this property are materially stronger than the Albany City School District average implies; a family-tenant draw the district grade alone would hide.
- Market conditions: Rents rising fast (+8.7%/yr); 58 active listings in the ZIP; 6 comparable units currently listed for rent nearby; rentals lingering (median 45d on market — plan ~5-8 weeks vacancy on turnover, expect pricing pressure); 67% of comp listings sitting > 30 days — soft ceiling on asking rent; 675 units permitted in Albany County in 2024 (451 in 5+ unit buildings).
Forward outlook
- In year one you build about $22k of equity ($1k loan paydown + $21k appreciation (10.0% local appreciation)).
- Albany County population projected at +9% by 2050 — modest demand growth; plan on rents tracking national, not racing it.
- At projected returns (10.0% appreciation + 8.0% rent growth), your $59k cash investment doubles in ~2 years — after that, you're playing with house money.
- By year 2, paydown + projected appreciation supports a ~$36k cash-out refi (75% LTV) — recoverable capital for the next deal without selling this one.
Negotiation context
- Only 5 days on market — expect competitive offers; lowballing is unlikely to land.
- 5 sale attempts since 15y ago with the ask held roughly flat each time — persistent listings suggest the price (not the market) is what's stuck; bring a comps-based counter.
- Current owner paid $125k; list at $209k implies a 67% gain — meaningful room to come down on a strong offer.
Risks & watch-outs
- Watch-outs: built in 1900 — expect roof / HVAC / electrical / plumbing capex.
Questions for the listing agent
- Have any recent inspections been done? Can we get a copy of the seller's disclosures and any deferred-maintenance estimates?
- Built in 1900 — when were the roof, HVAC, electrical panel, plumbing, and water heater last replaced?
- Is there a deadline driving the sale (1031 exchange, divorce, estate, relocation)? That informs how much negotiation room exists.
- Crime grade is F in this area — have there been break-ins, vandalism, or insurance claims at this property in the last 3 years? What carrier currently insures it and at what premium?
- What's the average days-on-market for RENTAL listings here right now (not sales)? A rising rental-DOM trend means longer vacancies and softer asking-rent achievability than the comps imply.
- What's the recent tenant-quality profile in this submarket — average credit score on applications, eviction rate, late-payment / NSF rate, and stable-employment percentage? A property-management company in the area should have these aggregated.
- How much new for-sale + rental construction is in the pipeline within 1–3 miles? Heavy new supply typically softens prices + rents 12–24 months out; constrained supply supports both.
Investment metrics
- 1% rule
- 1.16% ✓
- Cap rate
- 9.00%
- Cash-on-cash
- 9.66%
- DSCR
- 1.43
- GRM
- 7.2
CMA / ARV
- ARV (on-the-fly)
- $276,877
- Comps found
- 10
Show comp detail 10 sales within ~0.75 mi
| Address | Dist | Beds/Ba | Sqft | Sold | Price | $/sf | Match |
|---|---|---|---|---|---|---|---|
| 352 Hamilton St | 0.42mi | 5/2.0 | 2,028 (+0%) | 3mo | $365,000 | $180 | 77 |
| 16 Delaware Ter | 0.26mi | 5/1.5 | 2,040 (+1%) | 15mo | $253,000 | $124 | 72 |
| 8 Catalpa Dr | 0.49mi | 5/1.5 | 2,034 (+1%) | 3mo | $287,600 | $141 | 71 |
| 38 Dana Ave | 0.35mi | 5/2.0 | 2,152 (+6%) | 20mo | $180,000 | $84 | 56 |
| 18 Bertha St | 0.66mi | 5/2.0 | 1,946 (-4%) | 9mo | $293,000 | $151 | 56 |
| 19 Bleecker Pl | 0.59mi | 4/2.0 (-1) | 2,070 (+2%) | 13mo | $195,000 | $94 | 53 |
| 34 Magnolia Ter | 0.33mi | 4/2.0 (-1) | 2,142 (+6%) | 22mo | $292,500 | $137 | 51 |
| 24 Summit Ave | 0.51mi | 4/1.5 (-1) | 1,820 (-10%) | 8mo | $173,000 | $95 | 46 |
| 124 2nd Ave | 0.65mi | 5/1.5 | 2,300 (+14%) | 2mo | $85,000 | $37 | 43 |
| 136 Chestnut St | 0.60mi | 4/3.5 (-1) | 2,312 (+14%) | 14mo | $505,000 | $218 | 25 |
Match score weights: distance 35% · size 25% · config 20% · recency 20%. Top-matched comps best support the ARV.
Projected returns pro-forma
10.0% appreciation · 8.0% rent growth · sell at horizon
- IRR
- 33.6%
- Equity multiple
- 3.68×
- Total profit
- $156,686
- Equity at exit
- $188,284
- IRR
- 30.7%
- Equity multiple
- 9.03×
- Total profit
- $469,634
- Equity at exit
- $406,041
Cash invested: $58,520 (down + closing). Projections, not guarantees.
Landlord ↔ Tenant lean methodology
- Overall (STATE)
- 15 Strongly Tenant-Friendly
- State New York
- 15 Strongly Tenant-Friendly · D+10
- County
- — inherits STATE
- City
- — inherits STATE
ZIP-level market 12202
- Home prices YoY
- 14.3%
- Rents YoY
- 8.7%
- Active inventory
- 58
- Price-to-rent
- 7.2×
Monthly cashflow live
- Estimated rent
- $2,425 high interval (Pro) →
- Mortgage (P&I)
- −$1,096
- Tax est. 1.5%
- −$261 /mo · $3,135/yr
- Insurance
- −$87
- HOA
- −$0
- Vacancy / Maint / Mgmt
- −$509
- Net cashflow
- $471
Break-even live
Sensitivity live
| Price | -10% $616 | -5% $543 | +0% $471 | +5% $399 | +10% $327 |
|---|---|---|---|---|---|
| Rent | -10% $280 | -5% $375 | +0% $471 | +5% $567 | +10% $663 |
| Rate | -1.0pp $576 | -0.5pp $524 | base $471 | +0.5pp $417 | +1.0pp $362 |
UW: 25.0% down · 7.5% · 30yr · 1.5% tax · 5.0% vac · 8.0% maint · 8.0% mgmt
Financing live
Cash to close
- Down payment
- $52,250
- Closing costs
- $6,270
- Reserves months
- —
- Total cash needed
- —
Loan-product check · same deal, 3 products live
Conventional
25% down · 7.5% · 30yr
- Down + closing
- —
- Monthly P&I
- —
- Monthly cashflow
- —
- DSCR
- —
- Eligible?
- —
Personal DTI + credit; lowest rate.
DSCR
20% down · 8.5% · 30yr
- Down + closing
- —
- Monthly P&I
- —
- Monthly cashflow
- —
- DSCR
- —
- Eligible?
- —
No personal income docs; deal must DSCR.
Hard money
10% down · 12.0% · 12mo
- Down + closing
- —
- Monthly P&I
- —
- Monthly cashflow
- —
- DSCR
- —
- Eligible?
- —
Short-term bridge; refi at stabilization.
Rent comps 6 comps
| Address | Beds | Baths | Sqft | Rent | $/sqft | DOM | Units | Dist |
|---|---|---|---|---|---|---|---|---|
| 15 Stanwix St Albany, NY | 4.0 | 1.5 | 1660 | $2,500 | $1.51 | 15d | 1 | 0.76mi |
| 257 Quail St Albany, NY | 4.0 | 2.5 | 2208 | $2,800 | $1.27 | 44d | 1 | 0.93mi |
| 32 1st St Albany, NY | 4.0 | 1.5 | 1773 | $1,850 | $1.04 | 44d | 1 | 1.11mi |
| 38 W Erie St Albany, NY | 4.0 | 2.0 | 1440 | $2,800 | $1.94 | 24d | 1 | 1.27mi |
| 30 Cardinal Ave Albany, NY | 4.0 | 1.0 | 1529 | $2,800 | $1.83 | 45d | 1 | 1.38mi |
| 57 S Main Ave Albany, NY | 4.0 | 1.0 | 2695 | $1,600 | $0.59 | 44d | 1 | 1.45mi |
Listing history 11 events
-
2026-04-29status Pending
-
2026-04-24$209,000 Active
-
2013-09-27soldstatus $125,000 363-char remark
Show marketing remark (363 chars)
This lovely 4 bedroom colonial is a must see for all investors or first time home buyers! Hardwood flooring, newer appliances, roof and furnace have both been replaced within the last 5 years. This characteristic home is located on a very quiet dead end street and is a short drive away from the surrounding colleges and hospitals. Schedule your showing today!!
-
2013-08-13historical 363-char remark
Show marketing remark (363 chars)
This lovely 4 bedroom colonial is a must see for all investors or first time home buyers! Hardwood flooring, newer appliances, roof and furnace have both been replaced within the last 5 years. This characteristic home is located on a very quiet dead end street and is a short drive away from the surrounding colleges and hospitals. Schedule your showing today!!
-
2013-07-16$134,900 363-char remark
Show marketing remark (363 chars)
This lovely 4 bedroom colonial is a must see for all investors or first time home buyers! Hardwood flooring, newer appliances, roof and furnace have both been replaced within the last 5 years. This characteristic home is located on a very quiet dead end street and is a short drive away from the surrounding colleges and hospitals. Schedule your showing today!!
-
2013-05-28historical
-
2013-03-19$149,900
-
2012-10-01historical
-
2012-05-18$149,000
-
2011-09-02historical
-
2011-03-23$149,900
ⓘ Source: listings_history table (triggers on properties + properties_extension) + one-shot
backfill from property_details.listing_events for pre-trigger history.
Climate risk First Street
- Flood 1/10 Low FEMA zone X (unshaded) · 0% chance over 30 yrs
- Wildfire 3/10 Moderate
- Heat 4/10 Moderate 7 d/yr ≥99°F today · 16 d/yr by 30 yrs out
- Wind 3/10 Moderate 6% chance of damaging wind over 30 yrs
- Air quality 1/10 Low 0 unhealthy d/yr today · 0 by 30 yrs out
Nearby sold comps map
Loading sold comps map…
Walkable amenities ~0.75 mi
Loading nearby amenities…
Taxation est. · year 1
- Rental income
- $29,096
- − Mortgage interest
- −$11,707
- − Property taxes
- −$3,135
- − Insurance
- −$1,045
- − Repairs & maintenance
- −$2,328
- − Management
- −$2,328
- − Depreciation
- −$6,080
- Taxable income
- $2,474
- Est. tax owed @ 24.0%
- −$594
- After-tax cash flow
- $5,060/yr
For passive investors: Depreciation is non-cash, so a rental often shows a tax loss while cash-flowing — sheltering income. Rental losses are passive: they offset passive income freely, and up to $25,000/yr can offset ordinary (W-2) income if you actively participate and your MAGI is under $100k (phasing out to $0 by $150k); unused losses carry forward. On sale, claimed depreciation is recaptured at up to 25%, and gains may owe capital-gains tax (a 1031 exchange can defer both). Figures are a year-1 estimate at your 24.0% rate — not tax advice; consult a CPA.
Condition & rehab AI · 13 photos
This home requires moderate renovations, focusing on updating the interior walls, fixtures, and cabinets to improve its resale and rental value.
Repairs flagged
- Major paint — extensive chipping and uneven surfaces
- Major bathroom fixtures — dated and worn-out
- Moderate kitchen cabinets — dated and in need of updating
Value-add opportunities
- Resale Paint interior walls — Fresh paint can significantly improve the home's appearance and value
- Rental Replace bathroom fixtures — Modern fixtures can attract renters and increase rental value
- Both Update kitchen cabinets — A fresh kitchen can attract both buyers and renters, improving both resale and rental potential
Renovation cost estimate screening
| Repair item | Severity | Est. cost |
|---|---|---|
| paint · extensive chipping and uneven surfaces | Major | $15,000–50,000 |
| bathroom fixtures · dated and worn-out | Major | $15,000–50,000 |
| kitchen cabinets · dated and in need of updating | Moderate | $3,000–15,000 |
| Total estimated repair cost · 3 items | $33,000–115,000 |
Value-add ROI direction
- Resale Paint interior walls — Fresh paint can significantly improve the home's appearance and value ↑
- Rental Replace bathroom fixtures — Modern fixtures can attract renters and increase rental value ↑
- Both Update kitchen cabinets — A fresh kitchen can attract both buyers and renters, improving both resale and rental potential ↑
ⓘ Cost ranges are severity-bucket heuristics (US national rule-of-thumb). Get contractor quotes + a written scope before underwriting a rehab budget.
Schools (NCES district)
- District
- Albany City School District
- NCES district ID
- 3602460
- Math proficiency
- 37% ▲ 6.00%
- Reading proficiency
- 40% ▲ 7.00%
- Median HH income
- $40,568
- Composite
- 32.34/100
- National rank
- #5744
- State rank
- #543 of 590 in NY
Livability — Albany
- Score
- 79/100
- State rank
- #129
- US rank
- #2083
Category grades
Schools grade is shown separately in the Schools card above.
Census & demographics
- Census place
- Albany, NY
- County
- Albany County · 196,626 people
- City population
- 116,921
- Metro
- Albany-Schenectady-Troy, NY
- Population (ZIP)
- 10,166
- Household income
- $52,868
- Rent vs Own
- Severe rent burden
- 935.0
Population outlook (Albany County) Hauer SSP2
- Today (2025)
- 320,794 people
- By 2030
- 327,401 · +2.1%
- By 2040
- 338,218 · +5.4%
- By 2050
- 348,467 · +8.6%
- By 2075
- 381,693 · +19.0%
- By 2100
- 393,809 · +22.8%
Race, ethnicity, and origin ACS 2023
- Neighborhood character
- Highly diverse neighborhood (Simpson 0.73)
- Race & ethnicity
- Black 40% White 28% Hispanic / Latino 15% Two or more races 14% Asian 7%
- Hispanic origin (detail)
- Mexican 3% Puerto Rican 5% Dominican 5%
- Common ancestry
- Iranian 2% Romanian 1% Serbian 1%
- Foreign-born
- 14% · Canada, Philippines, China
- Languages at home
- 80% English-only · Spanish 10% Other Asian/Pacific 4% Arabic 1%
Political lean MEDSL · Albany
- 2024 margin
- Strong D (+25.8) · D 62.9% · R 37.1%
- 2008→2024 swing
- -3.6pp toward R · 2008: 29.4pp · 2024: 25.8pp
- All cycles
- 2024: D+25.8 2020: D+31.4 2016: D+24.3 2012: D+31.0 2008: D+29.4
Not yet ingested
- Civics
- —
Market trends
- HPI YoY
- ▲ 38.05%
- Current HPI
- 303.8939
- Rent YoY
- ▲ 8.70%
- Metro
- Albany-Schenectady-Troy, NY
- State GDP YoY
- ▲ 2.60%
- F500 in state
- 92
Industry mix (Fortune 500 HQ in NY)
| Industry | F500 HQs | Revenue |
|---|---|---|
| Financial Services | 10 | $950B |
|
||
| Consumer Goods | 9 | $162B |
|
||
| Insurance | 4 | $225B |
|
||
| Telecommunications | 2 | $144B |
|
||
| Pharmaceuticals | 2 | $112B |
|
||
| Media / Entertainment | 2 | $69B |
|
||
Price history
+39.4% since first listed11 events — show timeline
- 2026-04-29 Pending — Global MLS
- 2026-04-24 Listed $209,000 Global MLS
- 2013-09-27 Sold (MLS) $125,000 Global MLS
- 2013-08-13 Listing Removed — Global MLS
- 2013-07-16 Listed $134,900 Global MLS
- 2013-05-28 Listing Removed — Global MLS
- 2013-03-19 Listed $149,900 Global MLS
- 2012-10-01 Listing Removed — Global MLS
- 2012-05-18 Listed $149,000 Global MLS
- 2011-09-02 Listing Removed — Global MLS
- 2011-03-23 Listed $149,900 Global MLS
Cash-flow waterfall
monthlySold comps — $/sqft
last 12 mo · ≤1 miLoading sold comps…