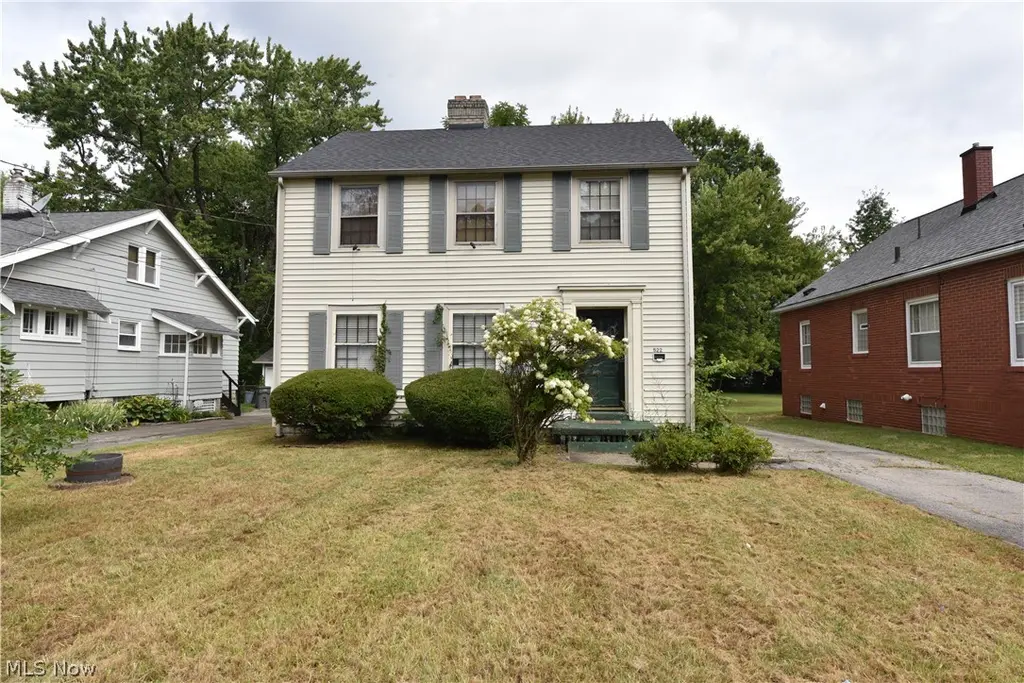
522 Parkcliffe Ave · Youngstown, OH
Flood risk 1/10 · Minimal
- FEMA flood zone
- X (unshaded)
- Chance of flooding over 30 yrs
- 0.0%
- Est. flood insurance / yr
- $473 – $860
Fire risk 1/10 · Minimal
- Est. fire insurance / yr
- $713 – $1,323
Heat risk 3/10 · Minor
- Hot days now (above 96°F)
- 7 days/yr
- Hot days in 30 yrs
- 17 days/yr
Wind risk 1/10 · Minimal
- Chance of severe wind over 30 yrs
- —
Air-quality risk 2/10 · Minimal
- Unhealthy air days now
- 1 days/yr
- Unhealthy air days in 30 yrs
- 2 days/yr
Risk factors via First Street. Map © Google.
Why this score? — see what drove the B grade
The composite is a weighted blend of 9 inputs, each scored 0–100. Each bar is that input's sub-score; the figure is the points it added to the 100-point composite (weight × sub-score).
- Cash flow +30.0/30.0
- ARV discount +15.0/15.0
- 1% rule +10.0/10.0
- DSCR +10.0/10.0
- Livability +4.0/5.0
- Rent growth +2.5/5.0
- Condition / age +2.5/5.0
- Schools +0.9/10.0
- Appreciation +0.0/10.0
$59,900
🖨 Deal sheet 📄 Offer letter ✓ Due diligence
Listing remarks
* * Seller willing to consider seller financing * * This 3-bedroom home is full of character with its original natural woodwork and solid layout. The property requires renovation, but it comes with a new roof, making it a strong starting point for your project. With vision and updates, this could be a beautiful home or rental investment in a convenient Youngstown location. A great opportunity for contractors, investors, or DIY buyers looking for their next project. Motivated seller, make an offer!
Key facts
- New roof
- 0.23 acre lot
- 2 garage spots
Tags
Property features AI
Finance
- Financial info: Annual tax amount listed (2025)
Exterior
- Parking: Attached or detached 2-car garage (has garage)
- Utilities: Public water; Public sewer
- Home design: Two-story brick home; Above-grade finished area approximately 1,344 (assessor)
- Construction: Brick construction; Asphalt and fiberglass roof; Block foundation; Built per public records
- Exterior features: Paved parking area
Interior
- Bedrooms: Total of 6 rooms (bedrooms included)
- Bathrooms: One full bathroom
- Heating & cooling: Forced air heating; Gas heating
- Interior features: Full basement; One fireplace
Neighborhood map
What this means for you Summary
Snapshot
- This is a 3-bed/1.0-bath single-family listed at $60k.
Deal economics
- At list price, monthly cash flow is $587 ($7k/yr) — positive.
- The deal already cash-flows at list — no discount required.
- Meets the 1% rule at list price ($1k rent vs $60k).
- Recommended offer: $58k (3.0% below list) — sets the bar for market timing.
- Cap rate 18.1% vs local median 7.0% in Youngstown — top-decile yield for the area; either an underpriced asset or a hidden risk that comps aren't pricing in. Stress-test before assuming the spread holds.
Location & tenants
- Location reads 81/100 on livability (#99 in OH, #1,506 nationally) — a professional / high-income tenant draw. Strengths: amenities A+, commute A+, cost of living A+; Watch: crime F, employment F.
- Youngstown City (urban): math 8% / reading 17% proficiency, ranked #649 of 656 in OH (top 99%) — low school quality limits family demand, transient renter base, plan for 1-2y turnover; 88% free/reduced lunch — lower-income household profile, screen leases tightly.
- Market conditions: 73 active listings in the ZIP; 6 comparable units currently listed for rent nearby; rentals at typical pace (median 21d on market — plan ~3-4 weeks tenant-placement turnaround); 147 units permitted in Mahoning County in 2024 (0 in 5+ unit buildings).
Forward outlook
- Local home prices are declining (-3.0%/yr); year-one equity from $414 of loan paydown is wiped out by about $2k of value loss. Plan a longer hold.
- Mahoning County population projected at -14% by 2050 — secular population decline; favor cash flow + early exit over multi-decade hold.
- At projected returns (-3.0% appreciation + 3.0% rent growth), your $17k cash investment doubles in ~3 years — after that, you're playing with house money.
Negotiation context
- It's been on market 33 days — a 3% lower offer ($58k) is reasonable based on typical stale-listing flexibility.
- 4 sale attempts since 30y ago with the ask held roughly flat each time — persistent listings suggest the price (not the market) is what's stuck; bring a comps-based counter.
- Current owner paid $37k; list at $60k implies a 63% gain — meaningful room to come down on a strong offer.
Risks & watch-outs
- Watch-outs: built in 1941 — expect roof / HVAC / electrical / plumbing capex.
Questions for the listing agent
- It's been on market 33 days. Have you received any prior offers? Is the seller open to a 3% concession, seller financing, or rate buy-down credit?
- Built in 1941 — when were the roof, HVAC, electrical panel, plumbing, and water heater last replaced?
- Is there a deadline driving the sale (1031 exchange, divorce, estate, relocation)? That informs how much negotiation room exists.
- Crime grade is F in this area — have there been break-ins, vandalism, or insurance claims at this property in the last 3 years? What carrier currently insures it and at what premium?
- What's the average days-on-market for RENTAL listings here right now (not sales)? A rising rental-DOM trend means longer vacancies and softer asking-rent achievability than the comps imply.
- What's the recent tenant-quality profile in this submarket — average credit score on applications, eviction rate, late-payment / NSF rate, and stable-employment percentage? A property-management company in the area should have these aggregated.
- How much new for-sale + rental construction is in the pipeline within 1–3 miles? Heavy new supply typically softens prices + rents 12–24 months out; constrained supply supports both.
Investment metrics
- 1% rule
- 2.01% ✓
- Cap rate
- 18.05%
- Cash-on-cash
- 42.00%
- DSCR
- 2.87
- GRM
- 4.2
CMA / ARV
- ARV (on-the-fly)
- $90,048
- Comps found
- 12
Show comp detail 12 sales within ~0.75 mi
| Address | Dist | Beds/Ba | Sqft | Sold | Price | $/sf | Match |
|---|---|---|---|---|---|---|---|
| 570 Almyra Ave | 0.20mi | 3/1.0 | 1,328 (-1%) | 14mo | $59,000 | $44 | 76 |
| 3414 Idlewood Ave | 0.35mi | 3/1.5 | 1,404 (+4%) | 5mo | $92,000 | $66 | 70 |
| 452 W Midlothian Blvd | 0.43mi | 3/1.5 | 1,409 (+5%) | 4mo | $135,000 | $96 | 66 |
| 628 Almyra Ave | 0.21mi | 3/2.0 | 1,474 (+10%) | 14mo | $23,980 | $16 | 58 |
| 970 Bonnie Brae Ave | 0.62mi | 3/2.0 | 1,409 (+5%) | 2mo | $160,000 | $114 | 58 |
| 27 W Avondale Ave | 0.50mi | 3/1.0 | 1,420 (+6%) | 15mo | $22,000 | $15 | 55 |
| 34 Labelle Ave | 0.69mi | 3/1.5 | 1,327 (-1%) | 14mo | $105,000 | $79 | 53 |
| 3631 Dover Rd | 0.67mi | 3/2.0 | 1,380 (+3%) | 12mo | $146,000 | $106 | 50 |
| 980 W Laclede Ave | 0.74mi | 3/1.0 | 1,453 (+8%) | 2mo | $97,000 | $67 | 50 |
| 950 Bonnie Brae Ave | 0.60mi | 3/2.0 | 1,206 (-10%) | 3mo | $145,000 | $120 | 49 |
| 464 W Hylda Ave | 0.34mi | 3/2.0 | 1,152 (-14%) | 12mo | $60,000 | $52 | 46 |
| 471 W Hylda | 0.30mi | 4/1.5 (+1) | 1,151 (-14%) | 12mo | $29,000 | $25 | 45 |
Match score weights: distance 35% · size 25% · config 20% · recency 20%. Top-matched comps best support the ARV.
Projected returns pro-forma
-3.0% appreciation · 3.0% rent growth · sell at horizon
- IRR
- 38.6%
- Equity multiple
- 2.65×
- Total profit
- $27,667
- Equity at exit
- $8,931
- IRR
- 45.1%
- Equity multiple
- 5.30×
- Total profit
- $72,179
- Equity at exit
- $5,179
Cash invested: $16,772 (down + closing). Projections, not guarantees.
Landlord ↔ Tenant lean methodology
- Overall (STATE)
- 73 Landlord-Friendly
- State Ohio
- 73 Landlord-Friendly · R+6
- County
- — inherits STATE
- City
- — inherits STATE
ZIP-level market 44511
- Home prices YoY
- -12.6%
- Active inventory
- 73
- Price-to-rent
- 4.2×
Monthly cashflow live
- Estimated rent
- $1,202 high interval (Pro) →
- Mortgage (P&I)
- −$314
- Tax from tax record
- −$24 /mo · $283/yr
- Insurance
- −$25
- HOA
- −$0
- Vacancy / Maint / Mgmt
- −$252
- Net cashflow
- $587
Break-even live
UW: 25.0% down · 7.5% · 30yr · 1.5% tax · 5.0% vac · 8.0% maint · 8.0% mgmt
Financing live
Cash to close
- Down payment
- $14,975
- Closing costs
- $1,797
- Reserves months
- —
- Total cash needed
- —
Loan-product check · same deal, 3 products live
Conventional
25% down · 7.5% · 30yr
- Down + closing
- —
- Monthly P&I
- —
- Monthly cashflow
- —
- DSCR
- —
- Eligible?
- —
Personal DTI + credit; lowest rate.
DSCR
20% down · 8.5% · 30yr
- Down + closing
- —
- Monthly P&I
- —
- Monthly cashflow
- —
- DSCR
- —
- Eligible?
- —
No personal income docs; deal must DSCR.
Hard money
10% down · 12.0% · 12mo
- Down + closing
- —
- Monthly P&I
- —
- Monthly cashflow
- —
- DSCR
- —
- Eligible?
- —
Short-term bridge; refi at stabilization.
Rent comps 6 comps
| Address | Beds | Baths | Sqft | Rent | $/sqft | DOM | Units | Dist |
|---|---|---|---|---|---|---|---|---|
| 3639 Shelby Rd Youngstown, OH | 2.0 | 1.0 | 936 | $1,200 | $1.28 | 20d | 1 | 0.79mi |
| 4322 Southern Blvd Youngstown, OH | 2.0 | 1.0 | 1000 | $875 | $0.88 | 13d | 1 | 1.08mi |
| 236 Hilton Ave Youngstown, OH | 4.0 | 1.5 | 1488 | $1,195 | $0.80 | 20d | 1 | 1.10mi |
| 158 Beechwood Dr Youngstown, OH | 3.0 | 1.5 | 1438 | $1,100 | $0.76 | 13d | 1 | 1.39mi |
| 512 E Philadelphia Ave Unit 1 Youngstown, OH | 2.0 | 1.0 | 1200 | $899 | $0.75 | 20d | 1 | 1.39mi |
| 360 Shields Rd Unit 360 Youngstown, OH | 2.0 | 1.0 | 974 | $925 | $0.95 | 20d | 1 | 1.40mi |
Listing history 10 events
-
2026-05-14status Pending
-
2026-04-08$59,900 Active
-
2025-11-22historical
-
2025-09-16price $79,900
-
2025-08-22$89,000 Active
-
1997-02-21soldstatus $36,700
-
1997-01-09historical
-
1996-09-30historical
-
1996-07-09$38,500
-
1996-04-09$38,900
ⓘ Source: listings_history table (triggers on properties + properties_extension) + one-shot
backfill from property_details.listing_events for pre-trigger history.
Tax reassessment forecast OH · Partial reset (capped growth)
- Current annual tax
- $283 · $24/mo
- Projected year-2 tax
- $609 · $51/mo
- Expected delta
- +$325/yr (+$27/mo · 114.8%)
ⓘ Screening estimate from a state-policy table — verify with the county assessor before closing.
Climate risk First Street
- Flood 1/10 Low FEMA zone X (unshaded) · 0% chance over 30 yrs
- Wildfire 1/10 Low
- Heat 3/10 Moderate 7 d/yr ≥96°F today · 17 d/yr by 30 yrs out
- Wind 1/10 Low
- Air quality 2/10 Low 1 unhealthy d/yr today · 2 by 30 yrs out
Nearby sold comps map
Loading sold comps map…
Walkable amenities ~0.75 mi
Loading nearby amenities…
Taxation est. · year 1
- Rental income
- $14,426
- − Mortgage interest
- −$3,355
- − Property taxes
- −$283
- − Insurance
- −$300
- − Repairs & maintenance
- −$1,154
- − Management
- −$1,154
- − Depreciation
- −$1,743
- Taxable income
- $6,437
- Est. tax owed @ 24.0%
- −$1,545
- After-tax cash flow
- $5,499/yr
For passive investors: Depreciation is non-cash, so a rental often shows a tax loss while cash-flowing — sheltering income. Rental losses are passive: they offset passive income freely, and up to $25,000/yr can offset ordinary (W-2) income if you actively participate and your MAGI is under $100k (phasing out to $0 by $150k); unused losses carry forward. On sale, claimed depreciation is recaptured at up to 25%, and gains may owe capital-gains tax (a 1031 exchange can defer both). Figures are a year-1 estimate at your 24.0% rate — not tax advice; consult a CPA.
Schools (NCES district)
- District
- Youngstown City
- NCES district ID
- 3904516
- Math proficiency
- 8% ▼ -15.00%
- Reading proficiency
- 17% ▼ -10.00%
- Median HH income
- $25,257
- Composite
- 9.29/100
- National rank
- #9858
- State rank
- #649 of 656 in OH
Livability — Youngstown
- Score
- 81/100
- State rank
- #99
- US rank
- #1506
Category grades
Schools grade is shown separately in the Schools card above.
Census & demographics
- Census place
- Youngstown, OH
- County
- Mahoning County · 84,956 people
- City population
- 28,503
- Metro
- Youngstown-Warren-Boardman, OH-PA
- Population (ZIP)
- 18,909
- Household income
- $56,880
- Rent vs Own
- Severe rent burden
- 336.0
Population outlook (Mahoning County) Hauer SSP2
- Today (2025)
- 223,932 people
- By 2030
- 218,387 · -2.5%
- By 2040
- 205,367 · -8.3%
- By 2050
- 193,606 · -13.5%
- By 2075
- 173,694 · -22.4%
- By 2100
- 151,147 · -32.5%
Race, ethnicity, and origin ACS 2023
- Neighborhood character
- Majority White (64%)
- Race & ethnicity
- White 64% Black 23% Hispanic / Latino 8% Two or more races 7% Native American 1%
- Hispanic origin (detail)
- Mexican 2% Puerto Rican 4%
- Common ancestry
- Romanian 5% Lithuanian 1% Slovak 1%
- Foreign-born
- 1% · Canada
- Languages at home
- 96% English-only · Spanish 3%
Political lean MEDSL · Mahoning
- 2024 margin
- Lean R (+9.4) · D 44.9% · R 54.4%
- 2008→2024 swing
- -36.1pp toward R · 2008: 26.6pp · 2024: -9.4pp
- All cycles
- 2024: R+9.4 2020: R+1.9 2016: D+3.0 2012: D+27.7 2008: D+26.6
Not yet ingested
- Civics
- —
Market trends
- HPI YoY
- ▼ -40.81%
- Current HPI
- 283.9088
- Rent YoY
- —
- Metro
- Youngstown-Warren-Boardman, OH-PA
- State GDP YoY
- ▲ 1.98%
- F500 in state
- 48
Industry mix (Fortune 500 HQ in OH)
| Industry | F500 HQs | Revenue |
|---|---|---|
| Insurance | 3 | $145B |
|
||
| Industrial Machinery | 3 | $49B |
|
||
| Financial Services | 3 | $24B |
|
||
| Consumer Goods | 2 | $93B |
|
||
| Aerospace / Defense | 2 | $47B |
|
||
| Utilities | 2 | $33B |
|
||
Price history
+54.0% since first listed10 events — show timeline
- 2026-05-14 Pending — MLSNOW
- 2026-04-08 Listed $59,900 MLSNOW
- 2025-11-22 Listing Removed — MLSNOW
- 2025-09-16 Price Changed $79,900 MLSNOW
- 2025-08-22 Listed $89,000 MLSNOW
- 1997-02-21 Sold (Public Records) $36,700 Public Records
- 1997-01-09 Listing Removed — MLSNOW
- 1996-09-30 Listing Removed — MLSNOW
- 1996-07-09 Listed $38,500 MLSNOW
- 1996-04-09 Listed $38,900 MLSNOW
Property tax history
-2.5%/yrLatest (2025): $283 · -11.8% YoY. Source: county tax records.
Cash-flow waterfall
monthlySold comps — $/sqft
last 12 mo · ≤1 miLoading sold comps…