301 N Oscar St · Primera, TX
Flood risk 4/10 · Minor
- FEMA flood zone
- X (unshaded)
- Chance of flooding over 30 yrs
- 0.22%
- Est. flood insurance / yr
- $507 – $1,088
Fire risk 3/10 · Minor
- Est. fire insurance / yr
- $1,222 – $2,270
Heat risk 9/10 · Severe
- Hot days now (above 110°F)
- 7 days/yr
- Hot days in 30 yrs
- 24 days/yr
Wind risk 9/10 · Severe
- Chance of severe wind over 30 yrs
- 99.0%
Air-quality risk 1/10 · Minimal
- Unhealthy air days now
- 0 days/yr
- Unhealthy air days in 30 yrs
- 0 days/yr
Risk factors via First Street. Map © Google.
Why this score? — see what drove the B- grade
The composite is a weighted blend of 9 inputs, each scored 0–100. Each bar is that input's sub-score; the figure is the points it added to the 100-point composite (weight × sub-score).
- Cash flow +30.0/30.0
- 1% rule +10.0/10.0
- DSCR +10.0/10.0
- ARV discount +7.5/15.0
- Livability +2.9/5.0
- Schools +2.5/10.0
- Condition / age +2.2/5.0
- Rent growth +2.0/5.0
- Appreciation +0.0/10.0
$95,000
🖨 Deal sheet 📄 Offer letter ✓ Due diligence
Listing remarks
Affordable 4 Bed / 2 Bath Home & acirc; & euro; & ldquo; Cash or Owner Financing Available! Don & acirc; & euro; & trade; t miss this great opportunity to own a 4 bedroom, 2 bathroom home with 1200 sqft of living space. This property features central A/C to keep you comfortable year-round and a brand new roof, giving you peace of mind on major expenses. Outside, you & acirc; & euro; & trade; ll find a spacious backyard that includes a trailer and a large shed & acirc; & euro; & rdquo; perfect for extra storage, workspace, or additional use. ?? Pricing Options: Cash Price: $95,000 Owner Financing: $130,000 $20,000 down 12% interest This is
Key facts
- Spacious backyard
- Brand new roof
- Central a/c
Tags
Neighborhood map
What this means for you Summary
Snapshot
- This is a 4-bed/2.0-bath other listed at $95k. Condition is rated fair.
Deal economics
- At list price, monthly cash flow is $743 ($9k/yr) — positive.
- The deal already cash-flows at list — no discount required.
- Meets the 1% rule at list price ($2k rent vs $95k).
- Recommended offer: $94k (1.5% below list) — sets the bar for market timing.
Location & tenants
- Location reads 57/100 on livability (#1,263 in TX) — a working-class tenant base; expect higher turnover. Strengths: cost of living A+, housing A-; Watch: employment D+, schools F, crime D-.
- Harlingen CISD (urban): math 25% / reading 35% proficiency, ranked #647 of 826 in TX (top 78%) — families likely to look elsewhere, expect single-tenant / working-renter base with shorter leases; 74% free/reduced lunch — lower-income household profile, screen leases tightly.
- Market conditions: Rents soft (-1.9%/yr); 534 active listings in the ZIP; 3 comparable units currently listed for rent nearby; rentals lingering (median 44d on market — plan ~5-8 weeks vacancy on turnover, expect pricing pressure); 67% of comp listings sitting > 30 days — soft ceiling on asking rent; 2,326 units permitted in Cameron County in 2024 (503 in 5+ unit buildings).
- This rent runs 30% of the median local income ($70k/yr) — at the standard rent-burdened threshold; future hikes will face affordability resistance.
Forward outlook
- Local home prices are declining (-3.0%/yr); year-one equity from $657 of loan paydown is wiped out by about $3k of value loss. Plan a longer hold.
- Cameron County population projected at +3% by 2050 — modest demand growth; plan on rents tracking national, not racing it.
- At projected returns (-3.0% appreciation + 0.0% rent growth), your $27k cash investment doubles in ~4 years — after that, you're playing with house money.
Negotiation context
- It's been on market 23 days — a 2% lower offer ($94k) is reasonable based on typical stale-listing flexibility.
Risks & watch-outs
- Climate carrying-cost: severe wind risk, 99% chance of damaging wind over 30y; extreme-heat days projected 7→24/yr by 2055 (HVAC capex compounding) — expect insurance premiums to compound above CPI over the hold.
Questions for the listing agent
- Have any recent inspections been done? Can we get a copy of the seller's disclosures and any deferred-maintenance estimates?
- Built in 1967 — when were the roof, HVAC, electrical panel, plumbing, and water heater last replaced?
- Is there a deadline driving the sale (1031 exchange, divorce, estate, relocation)? That informs how much negotiation room exists.
- Schools are F-rated, which usually means shorter tenancies and higher turnover. Who's the typical renter profile here, and what's been the actual vacancy rate?
- Crime grade is D in this area — have there been break-ins, vandalism, or insurance claims at this property in the last 3 years? What carrier currently insures it and at what premium?
- What's the average days-on-market for RENTAL listings here right now (not sales)? A rising rental-DOM trend means longer vacancies and softer asking-rent achievability than the comps imply.
- What's the recent tenant-quality profile in this submarket — average credit score on applications, eviction rate, late-payment / NSF rate, and stable-employment percentage? A property-management company in the area should have these aggregated.
- How much new for-sale + rental construction is in the pipeline within 1–3 miles? Heavy new supply typically softens prices + rents 12–24 months out; constrained supply supports both.
Investment metrics
- 1% rule
- 1.86% ✓
- Cap rate
- 15.67%
- Cash-on-cash
- 33.50%
- DSCR
- 2.49
- GRM
- 4.5
CMA / ARV
No comps found within radius.
Projected returns pro-forma
-3.0% appreciation · 0.0% rent growth · sell at horizon
- IRR
- 25.3%
- Equity multiple
- 2.01×
- Total profit
- $26,735
- Equity at exit
- $14,165
- IRR
- 31.1%
- Equity multiple
- 3.41×
- Total profit
- $64,227
- Equity at exit
- $8,214
Cash invested: $26,600 (down + closing). Projections, not guarantees.
Landlord ↔ Tenant lean methodology
- Overall (STATE)
- 87 Strongly Landlord-Friendly
- State Texas
- 87 Strongly Landlord-Friendly · R+5
- County
- — inherits STATE
- City
- — inherits STATE
ZIP-level market 78552
- Home prices YoY
- -13.8%
- Rents YoY
- -1.9%
- Active inventory
- 534
- Price-to-rent
- 4.5×
Monthly cashflow live
- Estimated rent
- $1,771 medium interval (Pro) →
- Mortgage (P&I)
- −$498
- Tax est. 1.5%
- −$119 /mo · $1,425/yr
- Insurance
- −$40
- HOA
- −$0
- Vacancy / Maint / Mgmt
- −$372
- Net cashflow
- $743
Break-even live
UW: 25.0% down · 7.5% · 30yr · 1.5% tax · 5.0% vac · 8.0% maint · 8.0% mgmt
Financing live
Cash to close
- Down payment
- $23,750
- Closing costs
- $2,850
- Reserves months
- —
- Total cash needed
- —
Loan-product check · same deal, 3 products live
Conventional
25% down · 7.5% · 30yr
- Down + closing
- —
- Monthly P&I
- —
- Monthly cashflow
- —
- DSCR
- —
- Eligible?
- —
Personal DTI + credit; lowest rate.
DSCR
20% down · 8.5% · 30yr
- Down + closing
- —
- Monthly P&I
- —
- Monthly cashflow
- —
- DSCR
- —
- Eligible?
- —
No personal income docs; deal must DSCR.
Hard money
10% down · 12.0% · 12mo
- Down + closing
- —
- Monthly P&I
- —
- Monthly cashflow
- —
- DSCR
- —
- Eligible?
- —
Short-term bridge; refi at stabilization.
Rent comps 3 comps
| Address | Beds | Baths | Sqft | Rent | $/sqft | DOM | Units | Dist |
|---|---|---|---|---|---|---|---|---|
| 17931 Spruce St Harlingen, TX | 3.0 | 2.0 | 1284 | $1,850 | $1.44 | 43d | 1 | 1.19mi |
| 1007 El Paso Cir Harlingen, TX | 3.0 | 2.0 | 1201 | $1,600 | $1.33 | 43d | 1 | 1.30mi |
| 23861 Ellie Ln Harlingen, TX | 3.0 | 2.0 | 1220 | $1,650 | $1.35 | 21d | 1 | 1.41mi |
Listing history 15 events
-
2026-06-18days on market $95,000 Active 23 DOM
-
2026-06-17days on market $95,000 Active 22 DOM
-
2026-06-16days on market $95,000 Active 21 DOM
-
2026-06-15days on market $95,000 Active 20 DOM
-
2026-06-14days on market $95,000 Active 18 DOM
-
2026-06-10days on market $95,000 Active 15 DOM
-
2026-06-09days on market $95,000 Active 14 DOM
-
2026-06-09days on market $95,000 Active 13 DOM
-
2026-06-07days on market $95,000 Active 12 DOM
-
2026-06-03days on market $95,000 Active 8 DOM
-
2026-06-02days on market $95,000 Active 7 DOM
-
2026-06-01days on market $95,000 Active 6 DOM
-
2026-05-31days on market $95,000 Active 5 DOM
-
2026-05-30days on market $95,000 Active 4 DOM
-
2026-05-26$95,000 Active
ⓘ Source: listings_history table (triggers on properties + properties_extension) + one-shot
backfill from property_details.listing_events for pre-trigger history.
Climate risk First Street
- Flood 4/10 Moderate FEMA zone X (unshaded) · 22% chance over 30 yrs
- Wildfire 3/10 Moderate
- Heat 9/10 Extreme 7 d/yr ≥110°F today · 24 d/yr by 30 yrs out
- Wind 9/10 Extreme 99% chance of damaging wind over 30 yrs
- Air quality 1/10 Low 0 unhealthy d/yr today · 0 by 30 yrs out
Nearby sold comps map
Loading sold comps map…
Walkable amenities ~0.75 mi
Loading nearby amenities…
Taxation est. · year 1
- Rental income
- $21,251
- − Mortgage interest
- −$5,321
- − Property taxes
- −$1,425
- − Insurance
- −$475
- − Repairs & maintenance
- −$1,700
- − Management
- −$1,700
- − Depreciation
- −$2,764
- Taxable income
- $7,866
- Est. tax owed @ 24.0%
- −$1,888
- After-tax cash flow
- $7,022/yr
For passive investors: Depreciation is non-cash, so a rental often shows a tax loss while cash-flowing — sheltering income. Rental losses are passive: they offset passive income freely, and up to $25,000/yr can offset ordinary (W-2) income if you actively participate and your MAGI is under $100k (phasing out to $0 by $150k); unused losses carry forward. On sale, claimed depreciation is recaptured at up to 25%, and gains may owe capital-gains tax (a 1031 exchange can defer both). Figures are a year-1 estimate at your 24.0% rate — not tax advice; consult a CPA.
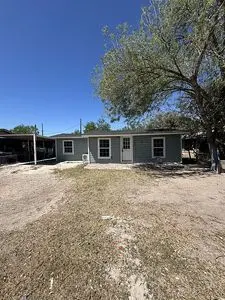
Condition & rehab AI · 1 photo
This home requires significant repairs and maintenance, including exterior siding, flooring, and landscaping, to improve its condition and value.
Repairs flagged
- Major exterior siding — The siding appears weathered and possibly damaged in places.
- Major flooring — The flooring in the visible areas appears worn and uneven.
- Major interior walls/paint — The interior walls and paint appear to be in need of repair and repainting.
- Major landscaping — The landscaping appears overgrown and unkempt, which detracts from the curb appeal.
Value-add opportunities
- Both painting the interior and exterior — Painting will improve the home's appearance and curb appeal, making it more attractive to potential buyers or renters.
- Both landscaping and yard maintenance — A well-maintained yard and landscaping can significantly enhance the home's curb appeal and overall value.
- Both replacing worn flooring — Replacing worn flooring will improve the home's condition and make it more appealing to potential buyers or renters.
- Both repairing exterior siding — Repairing the exterior siding will address a major issue and improve the home's overall appearance and value.
- Both HVAC maintenance or replacement — Ensuring the HVAC system is in good condition will improve comfort and energy efficiency, which is important for both resale and rental value.
Renovation cost estimate screening
| Repair item | Severity | Est. cost |
|---|---|---|
| exterior siding · The siding appears weathered and possibly damaged in places. | Major | $15,000–50,000 |
| flooring · The flooring in the visible areas appears worn and uneven. | Major | $15,000–50,000 |
| interior walls/paint · The interior walls and paint appear to be in need of repair and repainting. | Major | $15,000–50,000 |
| landscaping · The landscaping appears overgrown and unkempt, which detracts from the curb appeal. | Major | $15,000–50,000 |
| Total estimated repair cost · 4 items | $60,000–200,000 |
Value-add ROI direction
- Both painting the interior and exterior — Painting will improve the home's appearance and curb appeal, making it more attractive to potential buyers or renters. ↑
- Both landscaping and yard maintenance — A well-maintained yard and landscaping can significantly enhance the home's curb appeal and overall value. ↑
- Both replacing worn flooring — Replacing worn flooring will improve the home's condition and make it more appealing to potential buyers or renters. ↑
- Both repairing exterior siding — Repairing the exterior siding will address a major issue and improve the home's overall appearance and value. ↑
- Both HVAC maintenance or replacement — Ensuring the HVAC system is in good condition will improve comfort and energy efficiency, which is important for both resale and rental value. ↑
ⓘ Cost ranges are severity-bucket heuristics (US national rule-of-thumb). Get contractor quotes + a written scope before underwriting a rehab budget.
Schools (NCES district)
- District
- Harlingen CISD
- NCES district ID
- 4822530
- Math proficiency
- 25% ▼ -28.00%
- Reading proficiency
- 35% ▼ -11.00%
- Median HH income
- $37,182
- Composite
- 24.94/100
- National rank
- #7566
- State rank
- #647 of 826 in TX
Livability — Primera
- Score
- 57/100
- State rank
- #1263
- US rank
- #21994
Category grades
Schools grade is shown separately in the Schools card above.
Census & demographics
- Census place
- Primera, TX
- County
- Cameron County · 310,734 people
- Metro
- Brownsville-Harlingen, TX
- Population (ZIP)
- 42,332
- Household income
- $69,811
- Rent vs Own
- Severe rent burden
- 487.0
Population outlook (Cameron County) Hauer SSP2
- Today (2025)
- 441,603 people
- By 2030
- 448,113 · +1.5%
- By 2040
- 456,385 · +3.3%
- By 2050
- 456,294 · +3.3%
- By 2075
- 423,851 · -4.0%
- By 2100
- 342,787 · -22.4%
Race, ethnicity, and origin ACS 2023
- Neighborhood character
- Predominantly Hispanic (80%)
- Race & ethnicity
- Hispanic / Latino 80% Two or more races 31% White 16% Asian 2%
- Hispanic origin (detail)
- Mexican 75%
- Common ancestry
- Lithuanian 1% Romanian 1% Slovak 1%
- Foreign-born
- 15% · Canada
- Languages at home
- 49% English-only · Spanish 49% Vietnamese 1%
Political lean MEDSL · Cameron
- 2024 margin
- Lean R (+5.8) · D 46.7% · R 52.5%
- 2008→2024 swing
- -34.6pp toward R · 2008: 28.8pp · 2024: -5.8pp
- All cycles
- 2024: R+5.8 2020: D+13.2 2016: D+32.5 2012: D+32.4 2008: D+28.8
Not yet ingested
- Civics
- —
Market trends
- HPI YoY
- ▼ -31.61%
- Current HPI
- 197.1906
- Rent YoY
- ▼ -1.87%
- Metro
- Brownsville-Harlingen, TX
- State GDP YoY
- ▲ 3.95%
- F500 in state
- 110
Industry mix (Fortune 500 HQ in TX)
| Industry | F500 HQs | Revenue |
|---|---|---|
| Energy | 16 | $1,198B |
|
||
| Technology | 5 | $198B |
|
||
| Engineering / Construction | 4 | $72B |
|
||
| Energy Services | 3 | $60B |
|
||
| Utilities | 3 | $41B |
|
||
| Healthcare | 2 | $330B |
|
||
Price history
1 event — show timeline
- 2026-05-26 Listed $95,000 FSBO.com
Cash-flow waterfall
monthlySold comps — $/sqft
last 12 mo · ≤1 miLoading sold comps…