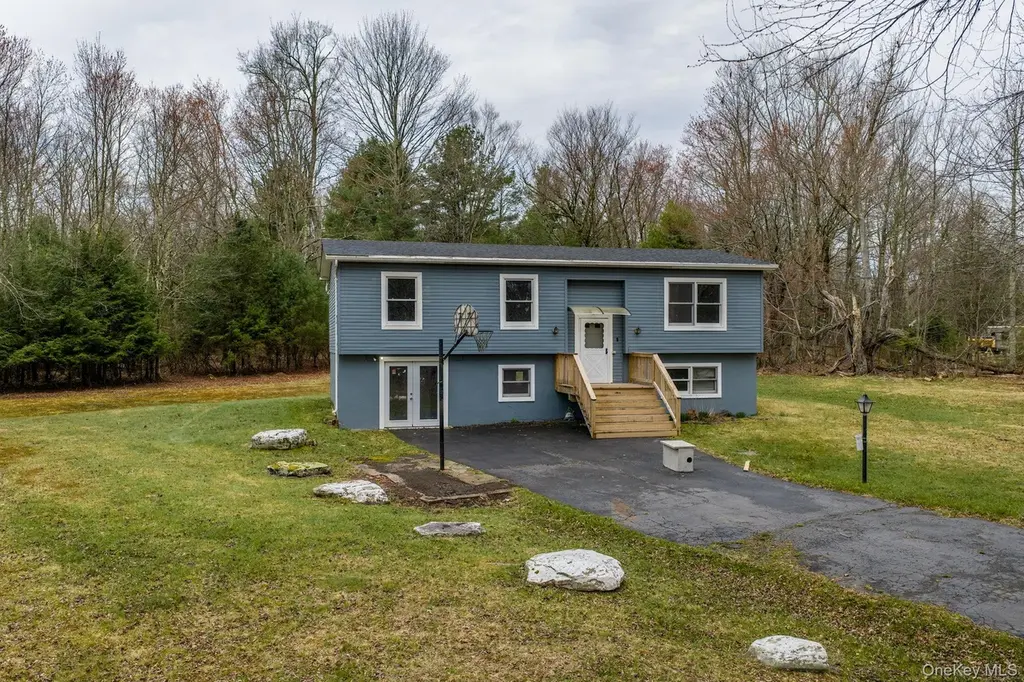
39 Dingle Daisy Rd · Monticello, NY
Flood risk 1/10 · Minimal
- FEMA flood zone
- X (unshaded)
- Chance of flooding over 30 yrs
- 0.0%
- Est. flood insurance / yr
- $473 – $860
Fire risk 4/10 · Minor
- Est. fire insurance / yr
- $691 – $1,283
Heat risk 2/10 · Minimal
- Hot days now (above 92°F)
- 7 days/yr
- Hot days in 30 yrs
- 15 days/yr
Wind risk 3/10 · Minor
- Chance of severe wind over 30 yrs
- 5.0%
Air-quality risk 2/10 · Minimal
- Unhealthy air days now
- 1 days/yr
- Unhealthy air days in 30 yrs
- 1 days/yr
Risk factors via First Street. Map © Google.
Why this score? — see what drove the D- grade
The composite is a weighted blend of 9 inputs, each scored 0–100. Each bar is that input's sub-score; the figure is the points it added to the 100-point composite (weight × sub-score).
- ARV discount +15.0/15.0
- Appreciation +10.0/10.0
- Cash flow +3.1/30.0
- Livability +3.1/5.0
- Rent growth +2.5/5.0
- Schools +2.5/10.0
- Condition / age +2.5/5.0
- 1% rule +0.0/10.0
- DSCR +0.0/10.0
$430,000
🖨 Deal sheet (PDF) 📄 Offer letter ✓ Due diligence
Listing remarks
This raised ranch style home, featuring 5 bedrooms and 2 full baths, provides spacious living perfect for guests or anyone needing extra room. Situated on a generous 1.97-acre lot, it offers ample outdoor space for recreation, gardening, or future expansion. The property has a full basement with a convenient walk-in basement entrance, adding both functionality and the potential for additional finished living areas or storage. Recent upgrades include a brand-new roof and a new septic system, ensuring worry-free maintenance. Located just 10 minutes from Monticello, this home combines quiet country living with easy access to local amenities.
Key facts
- Generous lot
- Recent upgrades
- Full basement
Tags
Property features AI
Exterior
- Parking: Driveway; Parking for 2 vehicles
- Utilities: Electricity connected (NYSEG); Septic tank
- Home design: Single family residence; Bi-level; Updated/remodeled; Living area per public records
- Construction: Concrete perimeter foundation
- Exterior features: Aluminum siding; No fencing; No additional exterior structures; Not waterfront
Interior
- Kitchen: Oven; Refrigerator
- Bedrooms: Bedrooms include a first-floor bedroom
- Bathrooms: 2 full bathrooms
- Heating & cooling: Electric heating; No cooling
- Interior features: First-floor bedroom; First-floor full bathroom; Finished full basement; Dormer attic; Deck
- Laundry & utility: Washer; Dryer; Electric dryer hookup
Neighborhood map
What this means for you Summary
Snapshot
- This is a 3-bed/1.5-bath single-family listed at $430k.
Deal economics
- At list price, monthly cash flow is $-1k ($-16k/yr) — negative.
- To cash-flow at today's rent, offer at most $188k (56.3% below list).
- To meet the 1% rule (rent ≥ 1% of price), the offer needs to be $206k (52.2% below list).
- Recommended offer: $188k (56.3% below list) — sets the bar for cash-flow.
- Cap rate 2.5% vs local median 3.4% in Monticello — below-typical yield; the buyer is paying a premium for something (appreciation thesis, condition, location) that the cap rate doesn't capture.
Location & tenants
- Location reads 61/100 on livability (#899 in NY) — a middle-class / working-renter tenant base. Strengths: housing A+, cost of living A-; Watch: crime D, amenities F, commute F.
- Monticello Central School District (town): math 29% / reading 30% proficiency, ranked #577 of 590 in NY (top 98%) — low school quality limits family demand, transient renter base, plan for 1-2y turnover.
- Zoned schools: George L Cooke School (592 students, 71% FRL); Robert J Kaiser Middle School (math 7% / reading 35%, grade F, #661 of 729 statewide, top 91%, 595 students, 66% FRL); Monticello High School (math 82% / reading 34%, grade C, #879 of 1,100 statewide, top 80%, 844 students, 63% FRL) — zoned schools average 67% FRL vs 50% district-wide (16 pts higher); higher-poverty schools than district average — tighter screening recommended.
- Market conditions: 188 active listings in the ZIP; 739 units permitted in Sullivan County in 2024 (5 in 5+ unit buildings).
- This rent runs 43% of the median local income ($57k/yr) — at the standard rent-burdened threshold; future hikes will face affordability resistance.
Forward outlook
- In year one you build about $46k of equity ($3k loan paydown + $43k appreciation (10.0% local appreciation)).
- Sullivan County population projected at -24% by 2050 — secular population decline; favor cash flow + early exit over multi-decade hold.
- By year 2, paydown + projected appreciation supports a ~$74k cash-out refi (75% LTV) — recoverable capital for the next deal without selling this one.
Negotiation context
- It's been on market 38 days — a 3% lower offer ($417k) is reasonable based on typical stale-listing flexibility.
- 9 sale attempts since 13y ago with the ask held roughly flat each time — persistent listings suggest the price (not the market) is what's stuck; bring a comps-based counter.
- Current owner paid $210k; list at $430k implies a 105% gain — meaningful room to come down on a strong offer.
Questions for the listing agent
- What do current leases actually rent for vs. the listed asking? Can we see a recent rent roll and the last 12 months of T-12 income?
- It's been on market 38 days. Have you received any prior offers? Is the seller open to a 56% concession, seller financing, or rate buy-down credit?
- Is there a deadline driving the sale (1031 exchange, divorce, estate, relocation)? That informs how much negotiation room exists.
- Schools are F-rated, which usually means shorter tenancies and higher turnover. Who's the typical renter profile here, and what's been the actual vacancy rate?
- Crime grade is D in this area — have there been break-ins, vandalism, or insurance claims at this property in the last 3 years? What carrier currently insures it and at what premium?
- The area grade is low — what's the realistic commute time and amenity access for the typical tenant pool here? Any planned neighborhood developments (good or bad) we should know about?
- What's the average days-on-market for RENTAL listings here right now (not sales)? A rising rental-DOM trend means longer vacancies and softer asking-rent achievability than the comps imply.
- What's the recent tenant-quality profile in this submarket — average credit score on applications, eviction rate, late-payment / NSF rate, and stable-employment percentage? A property-management company in the area should have these aggregated.
- How much new for-sale + rental construction is in the pipeline within 1–3 miles? Heavy new supply typically softens prices + rents 12–24 months out; constrained supply supports both.
Investment metrics
- 1% rule
- 0.48% ✗
- Cap rate
- 2.47%
- Cash-on-cash
- -13.65%
- DSCR
- 0.39
- GRM
- 17.4
CMA / ARV
- ARV (median comp)
- $824,848
- List price
- $430,000
- Delta
- -47.87%
- Verdict
- UNDERPRICED
- Comps
- 4 within 1.0 mi
Show comp detail 1 sale within ~0.75 mi
| Address | Dist | Beds/Ba | Sqft | Sold | Price | $/sf | Match |
|---|---|---|---|---|---|---|---|
| 3342 State Route 42 | 0.75mi | 3/3.0 | 1,918 (-7%) | 3mo | $467,250 | $244 | 45 |
Match score weights: distance 35% · size 25% · config 20% · recency 20%. Top-matched comps best support the ARV.
Projected returns pro-forma
10.0% appreciation · 3.0% rent growth · sell at horizon
- IRR
- 14.8%
- Equity multiple
- 2.22×
- Total profit
- $146,988
- Equity at exit
- $387,378
- IRR
- 14.6%
- Equity multiple
- 5.17×
- Total profit
- $501,555
- Equity at exit
- $835,395
Cash invested: $120,400 (down + closing). Projections, not guarantees.
Landlord ↔ Tenant lean methodology
- Overall (STATE)
- 15 Strongly Tenant-Friendly
- State New York
- 15 Strongly Tenant-Friendly · D+10
- County
- — inherits STATE
- City
- — inherits STATE
ZIP-level market 12701
- Home prices YoY
- 16.7%
- Active inventory
- 188
- Price-to-rent
- 17.4×
Monthly cashflow live
- Estimated rent
- $2,057 medium interval (Pro) →
- Mortgage (P&I)
- −$2,255
- Tax from tax record
- −$561 /mo · $6,728/yr
- Insurance
- −$179
- HOA
- −$0
- Vacancy / Maint / Mgmt
- −$432
- Net cashflow
- $-1,370
Break-even live
Sensitivity live
| Price | -10% $-1,126 | -5% $-1,248 | +0% $-1,370 | +5% $-1,492 | +10% $-1,613 |
|---|---|---|---|---|---|
| Rent | -10% $-1,532 | -5% $-1,451 | +0% $-1,370 | +5% $-1,289 | +10% $-1,207 |
| Rate | -1.0pp $-1,153 | -0.5pp $-1,260 | base $-1,370 | +0.5pp $-1,481 | +1.0pp $-1,595 |
UW: 25.0% down · 7.5% · 30yr · 1.5% tax · 5.0% vac · 8.0% maint · 8.0% mgmt
Financing live
Cash to close
- Down payment
- $107,500
- Closing costs
- $12,900
- Reserves months
- —
- Total cash needed
- —
Loan-product check · same deal, 3 products live
Conventional
25% down · 7.5% · 30yr
- Down + closing
- —
- Monthly P&I
- —
- Monthly cashflow
- —
- DSCR
- —
- Eligible?
- —
Personal DTI + credit; lowest rate.
DSCR
20% down · 8.5% · 30yr
- Down + closing
- —
- Monthly P&I
- —
- Monthly cashflow
- —
- DSCR
- —
- Eligible?
- —
No personal income docs; deal must DSCR.
Hard money
10% down · 12.0% · 12mo
- Down + closing
- —
- Monthly P&I
- —
- Monthly cashflow
- —
- DSCR
- —
- Eligible?
- —
Short-term bridge; refi at stabilization.
Listing history 37 events
-
2026-06-21days on market $430,000 Active 38 DOM
-
2026-06-18days on market $430,000 Active 35 DOM
-
2026-06-17days on market $430,000 Active 34 DOM
-
2026-06-16days on market $430,000 Active 33 DOM
-
2026-06-15days on market $430,000 Active 32 DOM
-
2026-06-14days on market $430,000 Active 30 DOM
-
2026-06-10days on market $430,000 Active 27 DOM
-
2026-06-09days on market $430,000 Active 26 DOM
-
2026-06-08days on market $430,000 Active 25 DOM
-
2026-06-07days on market $430,000 Active 24 DOM
-
2026-06-03days on market $430,000 Active 20 DOM
-
2026-06-02days on market $430,000 Active 19 DOM
-
2026-06-01days on market $430,000 Active 18 DOM
-
2026-05-31days on market $430,000 Active 17 DOM
-
2026-05-31days on market $430,000 Active 16 DOM
-
2026-05-14$430,000 Active 646-char remark
-
2026-02-06historical
-
2026-01-16price $449,999
-
2025-08-05$479,999 Active
-
2024-05-12$479,999 Active
-
2022-05-25soldstatus $210,000
-
2022-05-16soldstatus $210,000 Closed
-
2022-03-04status Pending
-
2022-03-04status Active
-
2022-02-05historical
-
2021-12-23price $249,995
-
2021-11-05$260,000 Active
-
2021-10-01historical
-
2021-07-28$369,900 Active
-
2021-01-28historical
-
2020-09-11price $250,000
-
2020-08-29price $275,000
-
2020-08-14$285,000 Active
-
2013-10-08historical
-
2013-10-08historical
-
2013-07-08
-
2013-07-08$355,100
ⓘ Source: listings_history table (triggers on properties + properties_extension) + one-shot
backfill from property_details.listing_events for pre-trigger history.
Tax reassessment forecast NY · Partial reset (capped growth)
- Current annual tax
- $6,728 · $561/mo
- Projected year-2 tax
- $6,997 · $583/mo
- Expected delta
- +$270/yr (+$22/mo · 4.0%)
ⓘ Screening estimate from a state-policy table — verify with the county assessor before closing.
Climate risk First Street
- Flood 1/10 Low FEMA zone X (unshaded) · 0% chance over 30 yrs
- Wildfire 4/10 Moderate
- Heat 2/10 Low 7 d/yr ≥92°F today · 15 d/yr by 30 yrs out
- Wind 3/10 Moderate 5% chance of damaging wind over 30 yrs
- Air quality 2/10 Low 1 unhealthy d/yr today · 1 by 30 yrs out
Nearby sold comps map
Loading sold comps map…
Walkable amenities ~0.75 mi
Loading nearby amenities…
Taxation est. · year 1
- Rental income
- $24,682
- − Mortgage interest
- −$24,087
- − Property taxes
- −$6,728
- − Insurance
- −$2,150
- − Repairs & maintenance
- −$1,975
- − Management
- −$1,975
- − Depreciation
- −$12,509
- Taxable loss
- −$24,740
- Est. tax savings @ 24.0%
- +$5,938
- After-tax cash flow
- $-10,501/yr
For passive investors: Depreciation is non-cash, so a rental often shows a tax loss while cash-flowing — sheltering income. Rental losses are passive: they offset passive income freely, and up to $25,000/yr can offset ordinary (W-2) income if you actively participate and your MAGI is under $100k (phasing out to $0 by $150k); unused losses carry forward. On sale, claimed depreciation is recaptured at up to 25%, and gains may owe capital-gains tax (a 1031 exchange can defer both). Figures are a year-1 estimate at your 24.0% rate — not tax advice; consult a CPA.
Schools (NCES district)
- District
- Monticello Central School District
- NCES district ID
- 3619740
- Math proficiency
- 29% ▼ -4.00%
- Reading proficiency
- 30% ▼ -2.00%
- Median HH income
- $44,696
- Composite
- 25.28/100
- National rank
- #7491
- State rank
- #577 of 590 in NY
Livability — Monticello
- Score
- 61/100
- State rank
- #899
- US rank
- #17510
Category grades
Schools grade is shown separately in the Schools card above.
Census & demographics
- County
- Sullivan County · 12,197 people
- City population
- 12,197
- Metro
- nan
- Population (ZIP)
- 12,197
- Household income
- $57,222
- Rent vs Own
- Severe rent burden
- 814.0
Population outlook (Sullivan County) Hauer SSP2
- Today (2025)
- 68,974 people
- By 2030
- 65,609 · -4.9%
- By 2040
- 58,878 · -14.6%
- By 2050
- 52,500 · -23.9%
- By 2075
- 39,941 · -42.1%
- By 2100
- 28,880 · -58.1%
Race, ethnicity, and origin ACS 2023
- Neighborhood character
- Diverse neighborhood (Simpson 0.69)
- Race & ethnicity
- White 43% Hispanic / Latino 31% Black 15% Two or more races 15% Asian 5%
- Hispanic origin (detail)
- Mexican 1% Puerto Rican 19% Dominican 3%
- Common ancestry
- Scotch-Irish 3% Romanian 2% Iranian 1%
- Foreign-born
- 15% · Canada, China, Jamaica
- Languages at home
- 71% English-only · Spanish 20% Other Indo-European 3% Russian/Polish/Slavic 2%
Political lean MEDSL · Sullivan
- 2024 margin
- R (+16.7) · D 41.6% · R 58.4%
- 2008→2024 swing
- -26.2pp toward R · 2008: 9.5pp · 2024: -16.7pp
- All cycles
- 2024: R+16.7 2020: R+9.2 2016: R+13.7 2012: D+10.4 2008: D+9.5
Not yet ingested
- Civics
- —
Market trends
- HPI YoY
- ▲ 72.71%
- Current HPI
- 507.739
- Rent YoY
- —
- Metro
- nan
- State GDP YoY
- ▲ 2.60%
- F500 in state
- 92
Industry mix (Fortune 500 HQ in NY)
| Industry | F500 HQs | Revenue |
|---|---|---|
| Financial Services | 10 | $950B |
|
||
| Consumer Goods | 9 | $162B |
|
||
| Insurance | 4 | $225B |
|
||
| Telecommunications | 2 | $144B |
|
||
| Pharmaceuticals | 2 | $112B |
|
||
| Media / Entertainment | 2 | $69B |
|
||
Price history
+21.1% since first listed22 events — show timeline
- 2026-05-14 Listed $430,000 OneKey® MLS as Distributed by MLS Grid
- 2026-02-06 Listing Removed — OneKey® MLS as Distributed by MLS Grid
- 2026-01-16 Price Changed $449,999 OneKey® MLS as Distributed by MLS Grid
- 2025-08-05 Listed $479,999 OneKey® MLS as Distributed by MLS Grid
- 2024-05-12 Listed $479,999 OneKey® MLS as Distributed by MLS Grid
- 2022-05-25 Sold (Public Records) $210,000 Public Records
- 2022-05-16 Sold (MLS) $210,000 OneKey® MLS as Distributed by MLS Grid
- 2022-03-04 Pending — OneKey® MLS as Distributed by MLS Grid
- 2022-03-04 Relisted — OneKey® MLS as Distributed by MLS Grid
- 2022-02-05 Listing Removed — OneKey® MLS as Distributed by MLS Grid
- 2021-12-23 Price Changed $249,995 OneKey® MLS as Distributed by MLS Grid
- 2021-11-05 Listed $260,000 OneKey® MLS as Distributed by MLS Grid
- 2021-10-01 Listing Removed — OneKey® MLS as Distributed by MLS Grid
- 2021-07-28 Listed $369,900 OneKey® MLS as Distributed by MLS Grid
- 2021-01-28 Listing Removed — OneKey® MLS as Distributed by MLS Grid
- 2020-09-11 Price Changed $250,000 OneKey® MLS as Distributed by MLS Grid
- 2020-08-29 Price Changed $275,000 OneKey® MLS as Distributed by MLS Grid
- 2020-08-14 Listed $285,000 OneKey® MLS as Distributed by MLS Grid
- 2013-10-08 Listing Removed — OneKey® MLS as Distributed by MLS Grid
- 2013-10-08 Delisted — HGMLS
- 2013-07-08 Listed $355,100 OneKey® MLS as Distributed by MLS Grid
- 2013-07-08 Listed — HGMLS
Property tax history
+0.5%/yrLatest (2025): $6,728 · +2.7% YoY. Source: county tax records.
Cash-flow waterfall
monthlySold comps — $/sqft
last 12 mo · ≤1 miLoading sold comps…