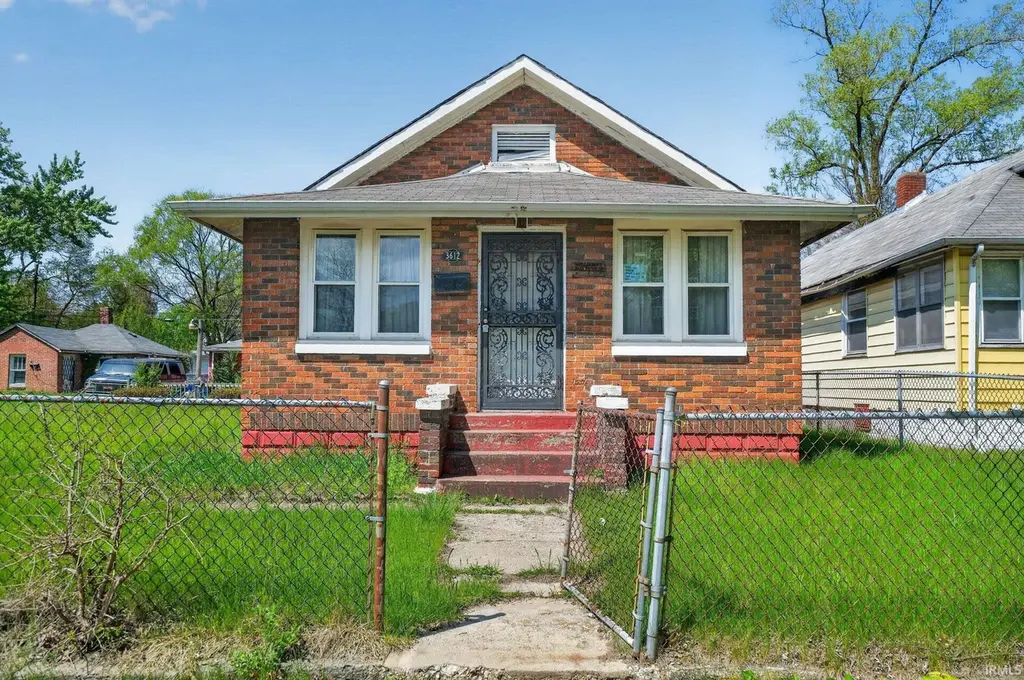
3612 Pennysylvania St · Gary, IN
Flood risk 1/10 · Minimal
- FEMA flood zone
- X (unshaded)
- Chance of flooding over 30 yrs
- 0.0%
- Est. flood insurance / yr
- $473 – $860
Fire risk 1/10 · Minimal
- Est. fire insurance / yr
- $717 – $1,331
Heat risk 3/10 · Minor
- Hot days now (above 102°F)
- 7 days/yr
- Hot days in 30 yrs
- 15 days/yr
Wind risk 2/10 · Minimal
- Chance of severe wind over 30 yrs
- 0.0%
Air-quality risk 4/10 · Minor
- Unhealthy air days now
- 6 days/yr
- Unhealthy air days in 30 yrs
- 7 days/yr
Risk factors via First Street. Map © Google.
Why this score? — see what drove the C+ grade
The composite is a weighted blend of 9 inputs, each scored 0–100. Each bar is that input's sub-score; the figure is the points it added to the 100-point composite (weight × sub-score).
- Cash flow +30.0/30.0
- 1% rule +10.0/10.0
- DSCR +10.0/10.0
- Rent growth +3.7/5.0
- Livability +3.7/5.0
- Appreciation +3.0/10.0
- Condition / age +2.5/5.0
- Schools +0.5/10.0
- ARV discount +0.0/15.0
$79,900
🖨 Deal sheet 📄 Offer letter ✓ Due diligence
Listing remarks
One address, two houses, and a detached garage—this unique Gary property is packed with possibilities. With both a 3-bedroom main home and a separate 1-bedroom studio on a generous multi-lot parcel, you get instant flexibility for rental income, multi-generational living, or house-hacking. The detached garage adds even more value for storage, workshop space, or extra parking. Both homes are vacant and ready for your vision. The main house features an unfinished basement with room to add custom touches, while the second home offers a private setup for guests or tenants. With utilities on and no HOA, this as-is opportunity is perfect for investors or buyers looking to create value in a
Key facts
- 0.36 acre lot
- 2 garage spots
- Built 1925
Property features AI
Finance
- Other: Property listed as residential; Subdivision: None
Exterior
- Parking: Detached 2-car garage
- Utilities: Public water; Public sewer
- Home design: Single-family residence; Site-built home; 1 story
- Construction: Brick, vinyl siding, and asphalt exterior materials
- Exterior features: Level lot; Lot dimensions approximately 118 x 126
Interior
- Bathrooms: 1 full bathroom (main level)
- Heating & cooling: Natural gas forced-air heating; No cooling
- Interior features: Full basement; Total of 3 rooms
- Laundry & utility: Laundry located in basement
Neighborhood map
What this means for you Summary
Snapshot
- This is a 3-bed/1.0-bath single-family listed at $80k.
Deal economics
- At list price, monthly cash flow is $581 ($7k/yr) — positive.
- The deal already cash-flows at list — no discount required.
- Meets the 1% rule at list price ($1k rent vs $80k).
- Recommended offer: $79k (1.5% below list) — sets the bar for market timing.
- Cap rate 15.0% vs local median 9.1% in Gary — top-decile yield for the area; either an underpriced asset or a hidden risk that comps aren't pricing in. Stress-test before assuming the spread holds.
Location & tenants
- Location reads 73/100 on livability (#105 in IN) — a middle-class / working-renter tenant base. Strengths: commute A+, cost of living A+, housing A+; Watch: crime F, employment F.
- Gary Community School Corporation (urban): math 3% / reading 11% proficiency, ranked #299 of 301 in IN (top 99%) — low school quality limits family demand, transient renter base, plan for 1-2y turnover; 80% free/reduced lunch — lower-income household profile, screen leases tightly.
- Zoned schools: Daniel Hale Williams Elem Sch (math 5% / reading 6%, grade F, #967 of 994 statewide, top 97%, 442 students, 86% FRL); West Side Leadership Academy (math 2% / reading 42%, grade F, #339 of 369 statewide, top 93%, 1,013 students, 86% FRL).
- Market conditions: Rents rising fast (+4.8%/yr); 75 active listings in the ZIP; 22 comparable units currently listed for rent nearby; rentals leasing fast (median 3d on market — plan ~1-2 weeks tenant-placement turnaround); lower-income renter base — watch delinquency; 1,642 units permitted in Lake County in 2024 (14 in 5+ unit buildings).
- This rent runs 38% of the median local income ($45k/yr) — at the standard rent-burdened threshold; future hikes will face affordability resistance.
Forward outlook
- Local home prices are declining (-3.0%/yr); year-one equity from $552 of loan paydown is wiped out by about $2k of value loss. Plan a longer hold.
- Lake County population projected to shrink 7% by 2050 — rents likely to lag national; underwrite the cash flow, not the appreciation.
- At projected returns (-3.0% appreciation + 4.8% rent growth), your $22k cash investment doubles in ~4 years — after that, you're playing with house money.
Negotiation context
- It's been on market 18 days — a 2% lower offer ($79k) is reasonable based on typical stale-listing flexibility.
- 3 sale attempts since 24y ago; this cycle's ask has dropped $10k (11%) from the opening price — seller is motivated, your offer sets the floor, not the list.
Risks & watch-outs
- Watch-outs: built in 1925 — expect roof / HVAC / electrical / plumbing capex.
Questions for the listing agent
- Built in 1925 — when were the roof, HVAC, electrical panel, plumbing, and water heater last replaced?
- Is there a deadline driving the sale (1031 exchange, divorce, estate, relocation)? That informs how much negotiation room exists.
- Schools are F-rated, which usually means shorter tenancies and higher turnover. Who's the typical renter profile here, and what's been the actual vacancy rate?
- Crime grade is F in this area — have there been break-ins, vandalism, or insurance claims at this property in the last 3 years? What carrier currently insures it and at what premium?
- What's the average days-on-market for RENTAL listings here right now (not sales)? A rising rental-DOM trend means longer vacancies and softer asking-rent achievability than the comps imply.
- What's the recent tenant-quality profile in this submarket — average credit score on applications, eviction rate, late-payment / NSF rate, and stable-employment percentage? A property-management company in the area should have these aggregated.
- How much new for-sale + rental construction is in the pipeline within 1–3 miles? Heavy new supply typically softens prices + rents 12–24 months out; constrained supply supports both.
Investment metrics
- 1% rule
- 1.75% ✓
- Cap rate
- 15.02%
- Cash-on-cash
- 31.15%
- DSCR
- 2.39
- GRM
- 4.8
CMA / ARV
- ARV (on-the-fly)
- $66,858
- Comps found
- 12
Show comp detail 12 sales within ~0.75 mi
| Address | Dist | Beds/Ba | Sqft | Sold | Price | $/sf | Match |
|---|---|---|---|---|---|---|---|
| 3540 Pennsylvania St | 0.09mi | 3/1.5 | 1,035 (+2%) | 3mo | $68,000 | $66 | 88 |
| 3346 Delaware St | 0.34mi | 3/1.0 | 1,017 (+0%) | 10mo | $74,000 | $73 | 75 |
| 3471 Pennsylvania St | 0.19mi | 2/1.0 (-1) | 960 (-5%) | 10mo | $75,000 | $78 | 70 |
| 3608 Virginia St | 0.19mi | 2/1.0 (-1) | 1,115 (+10%) | 1mo | $36,500 | $33 | 69 |
| 3624 Georgia St | 0.31mi | 3/2.0 | 954 (-6%) | 7mo | $77,000 | $81 | 66 |
| 3326 Delaware St | 0.37mi | 3/1.0 | 896 (-12%) | 1mo | $77,000 | $86 | 63 |
| 3992 Adams St | 0.56mi | 3/1.0 | 1,042 (+3%) | 10mo | $66,880 | $64 | 61 |
| 1407 E 36th Ave | 0.72mi | 3/1.0 | 950 (-6%) | 3mo | $55,100 | $58 | 54 |
| 3370 Pennsylvania St | 0.31mi | 2/1.0 (-1) | 894 (-12%) | 9mo | $14,900 | $17 | 53 |
| 4016 Connecticut St | 0.51mi | 2/1.0 (-1) | 920 (-9%) | 4mo | $25,000 | $27 | 52 |
| 828 E 35th Pl | 0.38mi | 2/1.0 (-1) | 900 (-11%) | 10mo | $50,000 | $56 | 51 |
| 3320 Delaware St | 0.38mi | 3/1.0 | 864 (-15%) | 9mo | $57,000 | $66 | 50 |
Match score weights: distance 35% · size 25% · config 20% · recency 20%. Top-matched comps best support the ARV.
Projected returns pro-forma
-3.0% appreciation · 4.85% rent growth · sell at horizon
- IRR
- 28.0%
- Equity multiple
- 2.19×
- Total profit
- $26,698
- Equity at exit
- $11,913
- IRR
- 36.5%
- Equity multiple
- 4.67×
- Total profit
- $82,190
- Equity at exit
- $6,908
Cash invested: $22,372 (down + closing). Projections, not guarantees.
Landlord ↔ Tenant lean methodology
- Overall (STATE)
- 90 Strongly Landlord-Friendly
- State Indiana
- 90 Strongly Landlord-Friendly · R+11
- County
- — inherits STATE
- City
- — inherits STATE
ZIP-level market 46409
- Home prices YoY
- -2.0%
- Rents YoY
- 4.8%
- Active inventory
- 75
- Price-to-rent
- 4.8×
Monthly cashflow live
- Estimated rent
- $1,398 high interval (Pro) →
- Mortgage (P&I)
- −$419
- Tax from tax record
- −$71 /mo · $858/yr
- Insurance
- −$33
- HOA
- −$0
- Vacancy / Maint / Mgmt
- −$294
- Net cashflow
- $581
Break-even live
UW: 25.0% down · 7.5% · 30yr · 1.5% tax · 5.0% vac · 8.0% maint · 8.0% mgmt
Financing live
Cash to close
- Down payment
- $19,975
- Closing costs
- $2,397
- Reserves months
- —
- Total cash needed
- —
Loan-product check · same deal, 3 products live
Conventional
25% down · 7.5% · 30yr
- Down + closing
- —
- Monthly P&I
- —
- Monthly cashflow
- —
- DSCR
- —
- Eligible?
- —
Personal DTI + credit; lowest rate.
DSCR
20% down · 8.5% · 30yr
- Down + closing
- —
- Monthly P&I
- —
- Monthly cashflow
- —
- DSCR
- —
- Eligible?
- —
No personal income docs; deal must DSCR.
Hard money
10% down · 12.0% · 12mo
- Down + closing
- —
- Monthly P&I
- —
- Monthly cashflow
- —
- DSCR
- —
- Eligible?
- —
Short-term bridge; refi at stabilization.
Rent comps 22 comps
| Address | Beds | Baths | Sqft | Rent | $/sqft | DOM | Units | Dist |
|---|---|---|---|---|---|---|---|---|
| 3395 Pennsylvania St Gary, IN | 3.0 | 1.0 | 1300 | $1,495 | $1.15 | 1d | 1 | 0.26mi |
| 816 E 35th Ct Gary, IN | 2.0 | 1.0 | 810 | $1,075 | $1.33 | 1d | 1 | 0.36mi |
| 801 E 32nd Ave Unit 2 Gary, IN | 2.0 | 1.0 | 850 | $1,300 | $1.53 | 1d | 1 | 0.56mi |
| 3708 Harrison St Gary, IN | 3.0 | 1.5 | 904 | $1,400 | $1.55 | 2d | 1 | 0.71mi |
| 4009 Kentucky St Gary, IN | 4.0 | 1.0 | 1307 | $1,595 | $1.22 | 43d | 1 | 0.74mi |
| 4018 Tyler St Gary, IN | 3.0 | 1.0 | 880 | $1,350 | $1.53 | 1d | 1 | 0.92mi |
| 4208 Jackson St Gary, IN | 3.0 | 1.0 | 1411 | $1,350 | $0.96 | 44d | 1 | 0.95mi |
| 3449 Buchanan St Gary, IN | 3.0 | 1.0 | 1301 | $1,395 | $1.07 | 43d | 1 | 1.01mi |
| 4040 Fillmore St Gary, IN | 2.0 | 1.0 | 1000 | $1,000 | $1.00 | 10d | 1 | 1.03mi |
| 4430 Broadway Gary, IN | 3.0 | 1.0 | 1200 | $1,250 | $1.04 | 1d | 1 | 1.06mi |
| 3777 Lincoln St Gary, IN | 2.0 | 1.0 | 800 | $1,150 | $1.44 | 1d | 1 | 1.07mi |
| 4456 Connecticut St Gary, IN | 3.0 | 1.0 | 1044 | $1,300 | $1.25 | 3d | 1 | 1.07mi |
| 3788 Lincoln St Gary, IN | 3.0 | 2.0 | 1398 | $1,400 | $1.00 | 10d | 1 | 1.10mi |
| 4170 Fillmore St Gary, IN | 2.0 | 1.0 | 720 | $950 | $1.32 | 19d | 1 | 1.13mi |
| 4416 Vermont Ct Gary, IN | 3.0 | 1.0 | 1162 | $1,350 | $1.16 | 43d | 1 | 1.14mi |
| 624 W 44th Pl Gary, IN | 3.0 | 1.0 | 836 | $1,250 | $1.50 | 7d | 1 | 1.20mi |
| 837 W 27th Ave Unit A Gary, IN | 2.0 | 1.0 | 750 | $1,150 | $1.53 | 1d | 1 | 1.34mi |
| 3820 Colbourne St Hobart, IN | 3.0 | 2.0 | 1209 | $1,695 | $1.40 | 43d | 1 | 1.34mi |
| 4364 Buchanan St Gary, IN | 3.0 | 1.0 | 900 | $1,500 | $1.67 | 1d | 1 | 1.38mi |
| 3852 Sandusky St Hobart, IN | 4.0 | 1.0 | 1209 | $1,800 | $1.49 | 17d | 1 | 1.41mi |
| 2572-76 Van Buren Pl Gary, IN | 2.0 | 1.0 | 700 | $1,025 | $1.46 | 1d | 1 | 1.44mi |
| 2453 Prospect St Gary, IN | 2.0 | 1.0 | 704 | $1,095 | $1.56 | 1d | 1 | 1.47mi |
Listing history 16 events
-
2026-06-09status $79,900 Pending 18 DOM
-
2026-06-08days on market $79,900 Active 18 DOM
-
2026-06-07days on market $79,900 Active 17 DOM
-
2026-06-04days on market $79,900 Active 14 DOM
-
2026-06-03days on market $79,900 Active 13 DOM
-
2026-06-02days on market $79,900 Active 12 DOM
-
2026-06-02price $79,900 Active 11 DOM
-
2026-06-01days on market $84,900 Active 11 DOM
-
2026-05-31days on market $84,900 Active 10 DOM
-
2026-05-15status Pending
-
2026-05-11price $84,900
-
2026-05-08$89,900 Active
-
2003-04-01historical
-
2002-09-24historical
-
2002-09-24$49,000
-
2002-03-11$55,000
ⓘ Source: listings_history table (triggers on properties + properties_extension) + one-shot
backfill from property_details.listing_events for pre-trigger history.
Tax reassessment forecast IN · Partial reset (capped growth)
- Current annual tax
- $858 · $71/mo
- Projected year-2 tax
- $858 · $71/mo
- Expected delta
- $0/yr ($0/mo · 0.0%)
ⓘ Screening estimate from a state-policy table — verify with the county assessor before closing.
Climate risk First Street
- Flood 1/10 Low FEMA zone X (unshaded) · 0% chance over 30 yrs
- Wildfire 1/10 Low
- Heat 3/10 Moderate 7 d/yr ≥102°F today · 15 d/yr by 30 yrs out
- Wind 2/10 Low 0% chance of damaging wind over 30 yrs
- Air quality 4/10 Moderate 6 unhealthy d/yr today · 7 by 30 yrs out
Nearby sold comps map
Loading sold comps map…
Walkable amenities ~0.75 mi
Loading nearby amenities…
Taxation est. · year 1
- Rental income
- $16,778
- − Mortgage interest
- −$4,476
- − Property taxes
- −$858
- − Insurance
- −$400
- − Repairs & maintenance
- −$1,342
- − Management
- −$1,342
- − Depreciation
- −$2,324
- Taxable income
- $6,036
- Est. tax owed @ 24.0%
- −$1,449
- After-tax cash flow
- $5,521/yr
For passive investors: Depreciation is non-cash, so a rental often shows a tax loss while cash-flowing — sheltering income. Rental losses are passive: they offset passive income freely, and up to $25,000/yr can offset ordinary (W-2) income if you actively participate and your MAGI is under $100k (phasing out to $0 by $150k); unused losses carry forward. On sale, claimed depreciation is recaptured at up to 25%, and gains may owe capital-gains tax (a 1031 exchange can defer both). Figures are a year-1 estimate at your 24.0% rate — not tax advice; consult a CPA.
Schools (NCES district)
- District
- Gary Community School Corporation
- NCES district ID
- 1803870
- Math proficiency
- 3% ▼ -10.00%
- Reading proficiency
- 11% ▼ -6.00%
- Median HH income
- $27,739
- Composite
- 4.98/100
- National rank
- #10039
- State rank
- #299 of 301 in IN
Livability — Gary
- Score
- 73/100
- State rank
- #105
- US rank
- #5592
Category grades
Schools grade is shown separately in the Schools card above.
Census & demographics
- Census place
- Gary, IN
- County
- Lake County · 422,878 people
- City population
- 63,701
- Metro
- Chicago-Naperville-Elgin, IL-IN-WI
- Population (ZIP)
- 7,184
- Household income
- $44,667
- Rent vs Own
- Severe rent burden
- 516.0
Population outlook (Lake County) Hauer SSP2
- Today (2025)
- 484,026 people
- By 2030
- 478,091 · -1.2%
- By 2040
- 462,974 · -4.3%
- By 2050
- 449,894 · -7.1%
- By 2075
- 436,169 · -9.9%
- By 2100
- 426,607 · -11.9%
Race, ethnicity, and origin ACS 2023
- Neighborhood character
- Predominantly Black (68%)
- Race & ethnicity
- Black 68% Two or more races 17% Hispanic / Latino 14% White 11%
- Hispanic origin (detail)
- Mexican 8% Puerto Rican 5%
- Common ancestry
- Iranian 1% Romanian 1%
- Foreign-born
- 2% · Canada
- Languages at home
- 94% English-only · Spanish 6%
Political lean MEDSL · Lake
- 2024 margin
- Lean D (+5.6) · D 52.1% · R 46.5% · Other 1.5%
- 2008→2024 swing
- -28.6pp toward R · 2008: 34.3pp · 2024: 5.6pp
- All cycles
- 2024: D+5.6 2020: D+15.1 2016: D+20.6 2012: D+31.0 2008: D+34.3
Not yet ingested
- Civics
- —
Market trends
- HPI YoY
- ▼ -3.91%
- Current HPI
- 190.6724
- Rent YoY
- ▲ 4.85%
- Metro
- Chicago-Naperville-Elgin, IL-IN-WI
- State GDP YoY
- ▲ 2.90%
- F500 in state
- 18
Industry mix (Fortune 500 HQ in IN)
| Industry | F500 HQs | Revenue |
|---|---|---|
| Industrial Machinery | 2 | $37B |
|
||
| Healthcare | 1 | $177B |
|
||
| Pharmaceuticals | 1 | $45B |
|
||
| Metals / Steel | 1 | $18B |
|
||
| Agriculture | 1 | $17B |
|
||
| Packaging | 1 | $12B |
|
||
Price history
+54.4% since first listed7 events — show timeline
- 2026-05-15 Pending — IRMLS
- 2026-05-11 Price Changed $84,900 IRMLS
- 2026-05-08 Listed $89,900 IRMLS
- 2003-04-01 Listing Removed — NIRA MLS as Distributed by MLS Grid
- 2002-09-24 Listing Removed — NIRA MLS as Distributed by MLS Grid
- 2002-09-24 Listed $49,000 NIRA MLS as Distributed by MLS Grid
- 2002-03-11 Listed $55,000 NIRA MLS as Distributed by MLS Grid
Property tax history
-0.7%/yrLatest (2024): $858 · +21.8% YoY. Source: county tax records.
Cash-flow waterfall
monthlySold comps — $/sqft
last 12 mo · ≤1 miLoading sold comps…