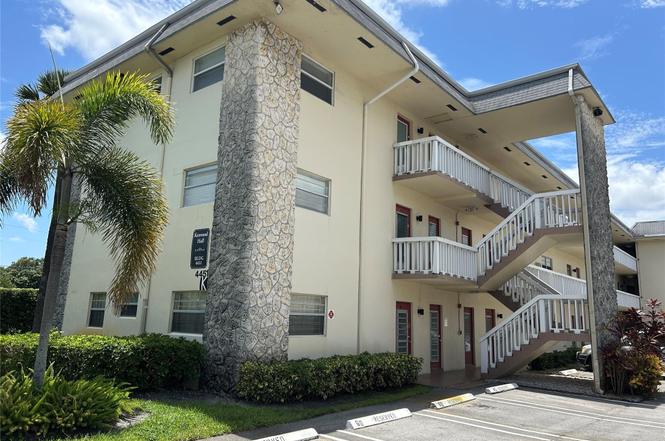
4451 NW 16th St Unit k308 · Lauderhill, FL
Flood risk 3/10 · Minor
- FEMA flood zone
- X (shaded)
- Chance of flooding over 30 yrs
- 0.2%
- Est. flood insurance / yr
- $507 – $1,088
Fire risk 1/10 · Minimal
- Est. fire insurance / yr
- $947 – $1,759
Heat risk 10/10 · Severe
- Hot days now (above 105°F)
- 7 days/yr
- Hot days in 30 yrs
- 26 days/yr
Wind risk 10/10 · Severe
- Chance of severe wind over 30 yrs
- 99.0%
Air-quality risk 2/10 · Minimal
- Unhealthy air days now
- 2 days/yr
- Unhealthy air days in 30 yrs
- 2 days/yr
Risk factors via First Street. Map © Google.
Why this score? — see what drove the B grade
The composite is a weighted blend of 9 inputs, each scored 0–100. Each bar is that input's sub-score; the figure is the points it added to the 100-point composite (weight × sub-score).
- Cash flow +30.0/30.0
- 1% rule +10.0/10.0
- DSCR +10.0/10.0
- ARV discount +7.5/15.0
- Schools +4.1/10.0
- Livability +4.0/5.0
- Rent growth +2.6/5.0
- Condition / age +2.5/5.0
- Appreciation +0.0/10.0
$67,000
🖨 Deal sheet (PDF) 📄 Offer letter ✓ Due diligence
Listing remarks
One Bedroom, One bathroom probate listing. Priced to sell quickly. Great opportunity. Showings will start 7/28/2025 and after. 55+ community with 2 POOLS, BBQ areas, FITNESS CENTER, clubhouse with a Billiards and Library. Steps from Lauderhill 9-hole GOLF COURSE.
Key facts
- $340 HOA
- Built 1969
Neighborhood map
What this means for you Summary
Snapshot
- This is a 1-bed/1.0-bath condo listed at $67k.
Deal economics
- At list price, monthly cash flow is $452 ($5k/yr) — positive.
- The deal already cash-flows at list — no discount required.
- Meets the 1% rule at list price ($2k rent vs $67k).
- Cap rate 14.4% vs local median 4.3% in Lauderhill — top-decile yield for the area; either an underpriced asset or a hidden risk that comps aren't pricing in. Stress-test before assuming the spread holds.
Location & tenants
- Location reads 79/100 on livability (#139 in FL, #2,059 nationally) — a middle-class / working-renter tenant base. Strengths: commute A+, cost of living A+, housing A+; Watch: schools D, employment D, amenities F.
- Broward (suburban): math 42% / reading 53% proficiency, ranked #46 of 73 in FL (top 63%) — families likely to look elsewhere, expect single-tenant / working-renter base with shorter leases.
- Market conditions: Rents flat; 664 active listings in the ZIP; 40 comparable units currently listed for rent nearby; rentals at typical pace (median 23d on market — plan ~3-4 weeks tenant-placement turnaround); 2,111 units permitted in Broward County in 2024 (1,265 in 5+ unit buildings).
- This rent runs 41% of the median local income ($46k/yr) — at the standard rent-burdened threshold; future hikes will face affordability resistance.
Forward outlook
- Local home prices are declining (-3.0%/yr); year-one equity from $463 of loan paydown is wiped out by about $2k of value loss. Plan a longer hold.
- Broward County population projected at +34% by 2050 — long-run rental-demand tailwind backs the buy-and-hold thesis.
- At projected returns (-3.0% appreciation + 0.3% rent growth), your $19k cash investment doubles in ~5 years — after that, you're playing with house money.
Negotiation context
- Only 0 days on market — expect competitive offers; lowballing is unlikely to land.
Risks & watch-outs
- Watch-outs: HOA is 21% of rent.
- Climate carrying-cost: severe wind risk, 99% chance of damaging wind over 30y; extreme-heat days projected 7→26/yr by 2055 (HVAC capex compounding) — expect insurance premiums to compound above CPI over the hold.
Questions for the listing agent
- Built in 1969 — when were the roof, HVAC, electrical panel, plumbing, and water heater last replaced?
- What does the HOA fee cover, when was the last increase, and are there any pending special assessments or reserve-fund shortfalls?
- Any open or pending special assessments — roof, HVAC, plumbing, elevator, façade? What's the per-unit balance and payoff schedule, and is the seller paying it off at close or rolling it to the buyer?
- Is there a deadline driving the sale (1031 exchange, divorce, estate, relocation)? That informs how much negotiation room exists.
- Schools are D-rated, which usually means shorter tenancies and higher turnover. Who's the typical renter profile here, and what's been the actual vacancy rate?
- What's the average days-on-market for RENTAL listings here right now (not sales)? A rising rental-DOM trend means longer vacancies and softer asking-rent achievability than the comps imply.
- What's the recent tenant-quality profile in this submarket — average credit score on applications, eviction rate, late-payment / NSF rate, and stable-employment percentage? A property-management company in the area should have these aggregated.
- How much new apartment / multifamily construction is in the pipeline within 1–3 miles? Heavy new supply (>2% of stock underway) typically softens rents 12–24 months out; light construction supports rent growth.
Investment metrics
- 1% rule
- 2.37% ✓
- Cap rate
- 14.38%
- Cash-on-cash
- 28.90%
- DSCR
- 2.29
- GRM
- 3.5
CMA / ARV
No comps found within radius.
Projected returns pro-forma
-3.0% appreciation · 0.26% rent growth · sell at horizon
- IRR
- 19.1%
- Equity multiple
- 1.74×
- Total profit
- $13,885
- Equity at exit
- $9,990
- IRR
- 24.8%
- Equity multiple
- 2.79×
- Total profit
- $33,528
- Equity at exit
- $5,793
Cash invested: $18,760 (down + closing). Projections, not guarantees.
Landlord ↔ Tenant lean methodology
- Overall (STATE)
- 87 Strongly Landlord-Friendly
- State Florida
- 87 Strongly Landlord-Friendly · R+3
- County
- — inherits STATE
- City
- — inherits STATE
ZIP-level market 33313
- Rents YoY
- 0.3%
- Active inventory
- 664
- Price-to-rent
- 3.5×
Monthly cashflow live
- Estimated rent
- $1,588 high interval (Pro) →
- Mortgage (P&I)
- −$351
- Tax est. 1.5%
- −$84 /mo · $1,005/yr
- Insurance
- −$28
- HOA
- −$340
- Vacancy / Maint / Mgmt
- −$334
- Net cashflow
- $452
Break-even live
Sensitivity live
| Price | -10% $498 | -5% $475 | +0% $452 | +5% $429 | +10% $405 |
|---|---|---|---|---|---|
| Rent | -10% $326 | -5% $389 | +0% $452 | +5% $514 | +10% $577 |
| Rate | -1.0pp $485 | -0.5pp $469 | base $452 | +0.5pp $434 | +1.0pp $417 |
UW: 25.0% down · 7.5% · 30yr · 1.5% tax · 5.0% vac · 8.0% maint · 8.0% mgmt
Financing live
Cash to close
- Down payment
- $16,750
- Closing costs
- $2,010
- Reserves months
- —
- Total cash needed
- —
Loan-product check · same deal, 3 products live
Conventional
25% down · 7.5% · 30yr
- Down + closing
- —
- Monthly P&I
- —
- Monthly cashflow
- —
- DSCR
- —
- Eligible?
- —
Personal DTI + credit; lowest rate.
DSCR
20% down · 8.5% · 30yr
- Down + closing
- —
- Monthly P&I
- —
- Monthly cashflow
- —
- DSCR
- —
- Eligible?
- —
No personal income docs; deal must DSCR.
Hard money
10% down · 12.0% · 12mo
- Down + closing
- —
- Monthly P&I
- —
- Monthly cashflow
- —
- DSCR
- —
- Eligible?
- —
Short-term bridge; refi at stabilization.
Rent comps 40 comps
| Address | Beds | Baths | Sqft | Rent | $/sqft | DOM | Units | Dist |
|---|---|---|---|---|---|---|---|---|
| 4321 NW 16th St Unit 202C Lauderhill, FL | 2.0 | 2.0 | 867 | $1,700 | $1.96 | 25d | 1 | 0.08mi |
| 1621 NW 46th Ave #101 Lauderhill, FL | 1.0 | 1.0 | 576 | $1,600 | $2.78 | 25d | 1 | 0.10mi |
| 1631 NW 46th Ave #118 Lauderhill, FL | 2.0 | 2.0 | 828 | $1,750 | $2.11 | 25d | 1 | 0.11mi |
| 1599 NW 43rd Ave #106 Lauderhill, FL | 1.0 | 1.0 | 730 | $1,499 | $2.05 | 18d | 1 | 0.11mi |
| 1701 NW 46th Ave #109 Lauderhill, FL | 2.0 | 2.0 | 828 | $1,800 | $2.17 | 23d | 1 | 0.13mi |
| 4299 NW 16th St #103 Lauderhill, FL | 1.0 | 1.0 | 700 | $1,400 | $2.00 | 25d | 1 | 0.14mi |
| 4299 NW 16th St #103 Lauderhill, FL | 1.0 | 1.0 | 700 | $1,400 | $2.00 | 9d | 1 | 0.14mi |
| 1501 NW 43rd Ave #204 Lauderhill, FL | 2.0 | 2.0 | 950 | $1,650 | $1.74 | 25d | 1 | 0.16mi |
| 1490 NW 43rd Ave #206 Lauderhill, FL | 2.0 | 2.0 | 950 | $1,800 | $1.89 | 21d | 1 | 0.17mi |
| 1861 NW 46th Ave Lauderhill, FL | 2.0 | 1.0–2.0 | 730 | $1,475 | $2.02 | 0d | 14 | 0.24mi |
| 1310 NW 43rd Ave #303 Lauderhill, FL | 1.0 | 1.0 | 950 | $1,400 | $1.47 | 25d | 1 | 0.26mi |
| 4491 NW 19th St Lauderhill, FL | 1.0–3.0 | 1.0–2.5 | 1358 | $1,615 | $1.19 | 0d | 37 | 0.32mi |
| 4047 NW 16th St #109 Lauderhill, FL | 1.0 | 1.0 | 725 | $1,300 | $1.79 | 25d | 1 | 0.33mi |
| 4310 NW 12th Ct #205 Lauderhill, FL | 1.0 | 1.0 | 730 | $1,500 | $2.05 | 18d | 1 | 0.34mi |
| 4310 NW 12th Ct #205 Lauderhill, FL | 1.0 | 1.0 | 730 | $1,500 | $2.05 | 6d | 1 | 0.34mi |
| 1196 NW 40th Ave Lauderhill, FL | 1.0–2.0 | 1.0 | 825 | $1,540 | $1.87 | 2d | 10 | 0.42mi |
| 2017 NW 46th Ave Unit A110 Lauderhill, FL | 1.0 | 1.5 | 800 | $1,650 | $2.06 | 25d | 1 | 0.45mi |
| 2029 NW 46th Ave Lauderhill, FL | 1.0 | 1.5 | 800 | $1,500 | $1.88 | 25d | 1 | 0.45mi |
| 2061 NW 47th Ter Lauderhill, FL | 1.0 | 1.5 | 928 | $1,620 | $1.75 | 5d | 2 | 0.49mi |
| 4160 NW 21st St Lauderhill, FL | 1.0–2.0 | 1.0 | 810 | $1,675 | $2.07 | 25d | 3 | 0.50mi |
| 4160 NW 21st St Lauderhill, FL | 1.0–2.0 | 1.0 | 810 | $1,599 | $1.97 | 0d | 3 | 0.50mi |
| 4240 NW 21st St #134 Lauderhill, FL | 1.0 | 1.0 | 812 | $1,500 | $1.85 | 25d | 1 | 0.51mi |
| 2070 NW 43rd Ter #6 Lauderhill, FL | 1.0 | 1.0 | 600 | $1,600 | $2.67 | 23d | 1 | 0.52mi |
| 4740 NW 21st St Lauderhill, FL | 1.0 | 1.5 | 1003 | $1,575 | $1.57 | 21d | 2 | 0.53mi |
| 2060 NW 48th Ter Lauderhill, FL | 1.0–2.0 | 1.0–2.0 | 886 | $1,395 | $1.57 | 9d | 2 | 0.58mi |
| 4401 NW 10th Ct Plantation, FL | 1.0–2.0 | 1.0 | 860 | $1,389 | $1.62 | 0d | 20 | 0.61mi |
| 4851 NW 21st St Unit 2P Lauderhill, FL | 1.0 | 1.5 | 1074 | $1,400 | $1.30 | 25d | 1 | 0.63mi |
| 4750 NW 22nd Ct #502 Lauderhill, FL | 1.0 | 1.5 | 928 | $1,600 | $1.72 | 25d | 1 | 0.65mi |
| 4770 NW 10th Ct #312 Plantation, FL | 1.0 | 1.0 | 748 | $1,600 | $2.14 | 0d | 1 | 0.75mi |
| 5224 NW 16th St Unit 3 Lauderhill, FL | 2.0 | 2.0 | 900 | $2,200 | $2.44 | 14d | 1 | 0.75mi |
| 4700 NW 9th Ct #4700 Plantation, FL | 2.0 | 1.5 | 938 | $2,250 | $2.40 | 25d | 1 | 0.80mi |
| 1752 NW 55th Ave #102 Lauderhill, FL | 1.0 | 1.0 | 550 | $1,390 | $2.53 | 25d | 1 | 0.81mi |
| 4817 NW 9th Dr #4817 Plantation, FL | 2.0 | 1.5 | 938 | $1,700 | $1.81 | 25d | 1 | 0.82mi |
| 3700 NW 21st St #203 Lauderdale Lakes, FL | 1.0 | 1.0 | 800 | $1,500 | $1.88 | 22d | 1 | 0.83mi |
| 5421-5425 NW 15th Ct Unit 5425 Lauderhill, FL | 2.0 | 1.0 | 890 | $1,950 | $2.19 | 14d | 1 | 0.84mi |
| 4848 NW 24th Ct Lauderdale Lakes, FL | 1.0–3.0 | 1.0–2.0 | 1045 | $1,550 | $1.48 | 18d | 3 | 0.85mi |
| 4848 NW 24th Ct Lauderdale Lakes, FL | 1.0–3.0 | 1.0–2.0 | 1045 | $1,450 | $1.39 | 6d | 4 | 0.85mi |
| 4719 NW 9th Dr #4719 Plantation, FL | 2.0 | 1.5 | 938 | $1,900 | $2.03 | 25d | 1 | 0.85mi |
| 4625 NW 9th Dr #4625 Plantation, FL | 2.0 | 1.5 | 938 | $2,000 | $2.13 | 0d | 1 | 0.85mi |
| 4851 NW 9th Dr #4851 Plantation, FL | 2.0 | 1.0 | 736 | $1,650 | $2.24 | 25d | 1 | 0.85mi |
HOA detail condo
- Monthly dues
- $340 · $4,080/yr
- Likely covers
- poolgym
- Assessments
- None detected in remarks — confirm with the listing agent.
Listing history 2 events
-
2026-02-19historical
-
2025-03-20$67,000
ⓘ Source: listings_history table (triggers on properties + properties_extension) + one-shot
backfill from property_details.listing_events for pre-trigger history.
Climate risk First Street
- Flood 3/10 Moderate FEMA zone X (shaded) · 20% chance over 30 yrs
- Wildfire 1/10 Low
- Heat 10/10 Extreme 7 d/yr ≥105°F today · 26 d/yr by 30 yrs out
- Wind 10/10 Extreme 99% chance of damaging wind over 30 yrs
- Air quality 2/10 Low 2 unhealthy d/yr today · 2 by 30 yrs out
Nearby sold comps map
Loading sold comps map…
Walkable amenities ~0.75 mi
Loading nearby amenities…
Taxation est. · year 1
- Rental income
- $19,060
- − Mortgage interest
- −$3,753
- − Property taxes
- −$1,005
- − Insurance
- −$335
- − Repairs & maintenance
- −$1,525
- − Management
- −$1,525
- − HOA
- −$4,080
- − Depreciation
- −$1,949
- Taxable income
- $4,888
- Est. tax owed @ 24.0%
- −$1,173
- After-tax cash flow
- $4,248/yr
For passive investors: Depreciation is non-cash, so a rental often shows a tax loss while cash-flowing — sheltering income. Rental losses are passive: they offset passive income freely, and up to $25,000/yr can offset ordinary (W-2) income if you actively participate and your MAGI is under $100k (phasing out to $0 by $150k); unused losses carry forward. On sale, claimed depreciation is recaptured at up to 25%, and gains may owe capital-gains tax (a 1031 exchange can defer both). Figures are a year-1 estimate at your 24.0% rate — not tax advice; consult a CPA.
Schools (NCES district)
- District
- Broward
- NCES district ID
- 1200180
- Math proficiency
- 42% ▼ -18.00%
- Reading proficiency
- 53% ▼ -5.00%
- Median HH income
- $52,139
- Composite
- 40.88/100
- National rank
- #3621
- State rank
- #46 of 73 in FL
Livability — Lauderhill
- Score
- 79/100
- State rank
- #139
- US rank
- #2059
Category grades
Schools grade is shown separately in the Schools card above.
Census & demographics
- Census place
- Lauderhill, FL
- County
- Broward County · 1,963,430 people
- City population
- 77,492
- Metro
- Miami-Fort Lauderdale-Pompano Beach, FL
- Population (ZIP)
- 62,807
- Household income
- $46,305
- Rent vs Own
- Severe rent burden
- 5692.0
Population outlook (Broward County) Hauer SSP2
- Today (2025)
- 2,207,033 people
- By 2030
- 2,360,704 · +7.0%
- By 2040
- 2,661,208 · +20.6%
- By 2050
- 2,946,698 · +33.5%
- By 2075
- 3,602,273 · +63.2%
- By 2100
- 3,970,984 · +79.9%
Race, ethnicity, and origin ACS 2023
- Neighborhood character
- Predominantly Black (77%)
- Race & ethnicity
- Black 77% Hispanic / Latino 12% Two or more races 8% White 7% Asian 2%
- Hispanic origin (detail)
- Puerto Rican 2% Cuban 3% Dominican 1%
- Common ancestry
- Hispanic 20%
- Foreign-born
- 39% · Canada, Jamaica, Dominican Republic
- Languages at home
- 66% English-only · French/Haitian/Cajun 22% Spanish 10%
Political lean MEDSL · Broward
- 2024 margin
- D (+17.0) · D 58.0% · R 41.0%
- 2008→2024 swing
- -17.8pp toward R · 2008: 34.7pp · 2024: 17.0pp
- All cycles
- 2024: D+17.0 2020: D+29.8 2016: D+35.0 2012: D+34.9 2008: D+34.7
Not yet ingested
- Civics
- —
Market trends
- HPI YoY
- ▼ -338.15%
- Current HPI
- 288.9345
- Rent YoY
- ▲ 0.26%
- Metro
- Miami-Fort Lauderdale-Pompano Beach, FL
- State GDP YoY
- ▲ 3.28%
- F500 in state
- 36
Industry mix (Fortune 500 HQ in FL)
| Industry | F500 HQs | Revenue |
|---|---|---|
| Industrial Technology | 2 | $29B |
|
||
| Insurance | 2 | $17B |
|
||
| Retail | 1 | $60B |
|
||
| Technology Distribution | 1 | $58B |
|
||
| Homebuilding | 1 | $35B |
|
||
| Technology Manufacturing | 1 | $35B |
|
||
Price history
2 events — show timeline
- 2026-02-19 Listing Removed — Beaches MLS
- 2025-03-20 Listed $67,000 Beaches MLS
Cash-flow waterfall
monthlySold comps — $/sqft
last 12 mo · ≤1 miLoading sold comps…