 Duplex
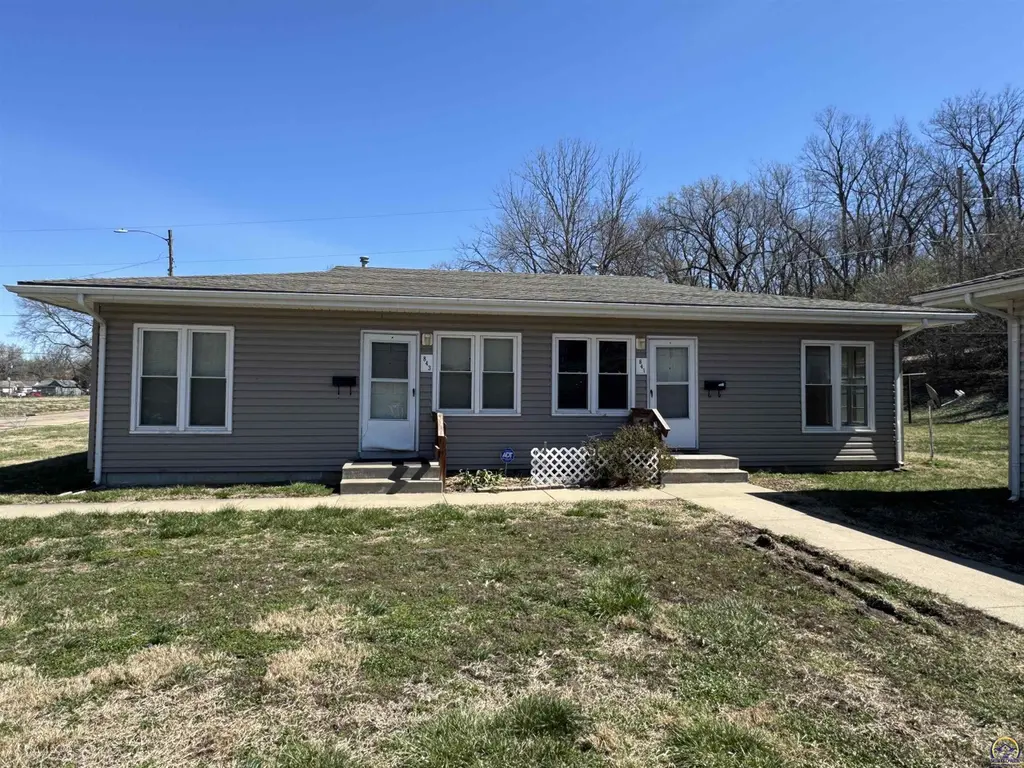
841/843 SE 14th St · Topeka, KS
Flood risk 4/10 · Minor
- FEMA flood zone
- AE
- Chance of flooding over 30 yrs
- 0.24%
- Est. flood insurance / yr
- $1,737 – $8,500
Fire risk 1/10 · Minimal
- Est. fire insurance / yr
- $1,154 – $2,142
Heat risk 4/10 · Minor
- Hot days now (above 107°F)
- 7 days/yr
- Hot days in 30 yrs
- 17 days/yr
Wind risk 2/10 · Minimal
- Chance of severe wind over 30 yrs
- —
Air-quality risk 3/10 · Minor
- Unhealthy air days now
- 3 days/yr
- Unhealthy air days in 30 yrs
- 4 days/yr
Risk factors via First Street. Map © Google.
Why this score? — see what drove the C+ grade
The composite is a weighted blend of 9 inputs, each scored 0–100. Each bar is that input's sub-score; the figure is the points it added to the 100-point composite (weight × sub-score).
- Cash flow +25.2/30.0
- DSCR +8.3/10.0
- ARV discount +7.5/15.0
- 1% rule +6.6/10.0
- Appreciation +4.9/10.0
- Livability +3.5/5.0
- Condition / age +2.8/5.0
- Rent growth +2.5/5.0
- Schools +1.7/10.0
$145,000
🖨 Deal sheet (PDF) 📄 Offer letter ✓ Due diligence
Multi-family units
County records classify this as Multi-Family (2-4 Unit). Listing-text estimate: 2 units. confirmed
Listing remarks
Both sides of this duplex are for sale! 2 bedrooms and 1 bath each side and just under 800 square feet each. Close to highway access, and large yard areas. Good rent history with rents averaging $850 per month (financials available upon request). Good parking spaces included, and platted for a future build. These are the 4 duplexes on the South side of the road on 1 parcel.
Key facts
- 0.93 acre lot
- 4 parking spots
- Built 1962
Property features AI
Exterior
- Parking: 4 parking spaces
- Utilities: Public water; Public sewer
- Home design: Residential income property; Multi-family (2–4 units)
- Construction: Vinyl siding
- Exterior features: Paved parking
Interior
- Kitchen: Refrigerator; Range
- Heating & cooling: Central heating; Electric cooling; Window unit(s) for cooling
- Interior features: Refrigerator; Range
Neighborhood map
What this means for you Summary
Snapshot
- This is a 2 × 2-bed/1.0-bath units multifamily listed at $145k. Condition is rated average.
Deal economics
- At list price, monthly cash flow is $-100 ($-1k/yr) — negative. Per door: $-50/mo.
- To cash-flow at today's rent, offer at most $131k (10.0% below list).
- Meets the 1% rule at list price ($2k rent vs $145k).
- Recommended offer: $131k (10.0% below list) — sets the bar for cash-flow.
- Cap rate 9.0% vs local median 4.3% in Topeka — top-decile yield for the area; either an underpriced asset or a hidden risk that comps aren't pricing in. Stress-test before assuming the spread holds.
Location & tenants
- Location reads 69/100 on livability (#195 in KS) — a middle-class / working-renter tenant base. Strengths: cost of living A+, housing A+, health & safety A+; Watch: employment C-, crime F, commute F.
- Topeka Public Schools (urban): math 17% / reading 23% proficiency, ranked #158 of 169 in KS (top 94%) — low school quality limits family demand, transient renter base, plan for 1-2y turnover; 69% free/reduced lunch — lower-income household profile, screen leases tightly.
- Zoned schools: Eisenhower Middle School (math 10% / reading 8%, grade F, #204 of 219 statewide, top 94%, 486 students, 90% FRL); Topeka High (math 11% / reading 20%, grade F, #248 of 327 statewide, top 76%, 1,514 students, 72% FRL).
- Market conditions: 22 active listings in the ZIP; 38 comparable units currently listed for rent nearby; rentals at typical pace (median 22d on market — plan ~3-4 weeks tenant-placement turnaround); 219 units permitted in Shawnee County in 2024 (25 in 5+ unit buildings).
Forward outlook
- In year one you build about $640 of equity ($1k loan paydown + $-362 appreciation (-0.2% local appreciation)).
- Shawnee County population projected to shrink 7% by 2050 — rents likely to lag national; underwrite the cash flow, not the appreciation.
Negotiation context
- It's been on market 94 days — a 9% lower offer ($132k) is reasonable based on typical stale-listing flexibility.
Risks & watch-outs
- Watch-outs: flood insurance adds $427/mo.
- Climate carrying-cost: in FEMA flood zone AE (mandatory federal flood insurance) — expect insurance premiums to compound above CPI over the hold.
Questions for the listing agent
- What do current leases actually rent for vs. the listed asking? Can we see a recent rent roll and the last 12 months of T-12 income?
- It's been on market 94 days. Have you received any prior offers? Is the seller open to a 10% concession, seller financing, or rate buy-down credit?
- Can we see the unit-by-unit rent roll, current vacancy, and any below-market leases? What's the average tenancy length?
- What capital expenditures (roof, boiler, parking lot, exteriors) have been made in the last 5 years, and what's planned in the next 2?
- Built in 1962 — when were the roof, HVAC, electrical panel, plumbing, and water heater last replaced?
- What's the actual annual flood-insurance premium (NFIP or private), and is the property in a SFHA with mandatory coverage?
- Why hasn't it sold? Are there any deal-killer items the seller is aware of (foundation, flood, title, zoning, code violations)?
- Is there a deadline driving the sale (1031 exchange, divorce, estate, relocation)? That informs how much negotiation room exists.
- Schools are D-rated, which usually means shorter tenancies and higher turnover. Who's the typical renter profile here, and what's been the actual vacancy rate?
- Crime grade is F in this area — have there been break-ins, vandalism, or insurance claims at this property in the last 3 years? What carrier currently insures it and at what premium?
- What's the average days-on-market for RENTAL listings here right now (not sales)? A rising rental-DOM trend means longer vacancies and softer asking-rent achievability than the comps imply.
- What's the recent tenant-quality profile in this submarket — average credit score on applications, eviction rate, late-payment / NSF rate, and stable-employment percentage? A property-management company in the area should have these aggregated.
- How much new apartment / multifamily construction is in the pipeline within 1–3 miles? Heavy new supply (>2% of stock underway) typically softens rents 12–24 months out; light construction supports rent growth.
Investment metrics
- 1% rule
- 1.16% ✓
- Cap rate
- 9.00%
- Cash-on-cash
- 9.66%
- DSCR
- 1.43
- GRM
- 7.2
CMA / ARV
No comps found within radius.
Projected returns pro-forma
-0.25% appreciation · 3.0% rent growth · sell at horizon
- IRR
- -6.4%
- Equity multiple
- 0.70×
- Total profit
- $-12,007
- Equity at exit
- $40,301
- IRR
- -0.1%
- Equity multiple
- 0.99×
- Total profit
- $-344
- Equity at exit
- $47,027
Cash invested: $40,600 (down + closing). Projections, not guarantees.
Landlord ↔ Tenant lean methodology
- Overall (STATE)
- 83 Strongly Landlord-Friendly
- State Kansas
- 83 Strongly Landlord-Friendly · R+10
- County
- — inherits STATE
- City
- — inherits STATE
ZIP-level market 66607
- Home prices YoY
- -0.1%
- Active inventory
- 22
- Price-to-rent
- 14.4×
Monthly cashflow live
- Estimated rent
- $1,682 high interval (Pro) →
- Mortgage (P&I)
- −$760
- Tax est. 1.5%
- −$181 /mo · $2,175/yr
- Insurance
- −$60
- Flood insurance flood zone
- −$427 /mo · $5,118/yr
- HOA
- −$0
- Vacancy / Maint / Mgmt
- −$353
- Net cashflow
- $-100
Break-even live
Sensitivity live
| Price | -10% $0 | -5% $-50 | +0% $-100 | +5% $-150 | +10% $-200 |
|---|---|---|---|---|---|
| Rent | -10% $-233 | -5% $-166 | +0% $-100 | +5% $-33 | +10% $33 |
| Rate | -1.0pp $-27 | -0.5pp $-63 | base $-100 | +0.5pp $-137 | +1.0pp $-176 |
2-unit breakdown (identical units grouped — click to expand)
| Units | Beds | Baths | Est. rent |
|---|---|---|---|
| 2× units | 2 | 1 | $1,682 |
| #1 | 2 | 1 | $841 |
| #2 | 2 | 1 | $841 |
| Total (2 units) | $1,682 | ||
UW: 25.0% down · 7.5% · 30yr · 1.5% tax · 5.0% vac · 8.0% maint · 8.0% mgmt
Financing live
Cash to close
- Down payment
- $36,250
- Closing costs
- $4,350
- Reserves months
- —
- Total cash needed
- —
Loan-product check · same deal, 3 products live
Conventional
25% down · 7.5% · 30yr
- Down + closing
- —
- Monthly P&I
- —
- Monthly cashflow
- —
- DSCR
- —
- Eligible?
- —
Personal DTI + credit; lowest rate.
DSCR
20% down · 8.5% · 30yr
- Down + closing
- —
- Monthly P&I
- —
- Monthly cashflow
- —
- DSCR
- —
- Eligible?
- —
No personal income docs; deal must DSCR.
Hard money
10% down · 12.0% · 12mo
- Down + closing
- —
- Monthly P&I
- —
- Monthly cashflow
- —
- DSCR
- —
- Eligible?
- —
Short-term bridge; refi at stabilization.
Rent comps 38 comps
| Address | Beds | Baths | Sqft | Rent | $/sqft | DOM | Units | Dist |
|---|---|---|---|---|---|---|---|---|
| 1724 SE Pennsylvania Ave Unit B Topeka, KS | 2.0 | 1.0 | 960 | $850 | $0.89 | 21d | 1 | 0.49mi |
| 600 SE Madison St Topeka, KS | 2.0 | 1.0 | — | $950 | — | 21d | 1 | 0.79mi |
| 1110 SE Powell St Topeka, KS | 2.0 | 1.5 | 765 | $695 | $0.91 | 21d | 1 | 0.80mi |
| 1110 SE Powell St Unit 12-2169 Topeka, KS | 3.0 | 1.5 | 909 | $980 | $1.08 | 21d | 1 | 0.84mi |
| 1438 SW Van Buren St Apt 4 Topeka, KS | 2.0 | 1.0 | 700 | $825 | $1.18 | 21d | 1 | 0.94mi |
| 1438 SW Van Buren St Unit 1 Topeka, KS | 1.0 | 1.0 | — | $775 | — | 21d | 1 | 0.94mi |
| 1438 SW Van Buren St Apt 3 Topeka, KS | 2.0 | 1.0 | — | $775 | — | 21d | 1 | 0.94mi |
| 2316 SE Ohio Ave Topeka, KS | 3.0 | 1.0 | — | $1,350 | — | 21d | 1 | 1.01mi |
| 1307 SW Harrison St Topeka, KS | 1.0 | 1.0 | 585 | $718 | $1.23 | 21d | 1 | 1.06mi |
| 1307 SW Harrison St Unit 1301 B33 Topeka, KS | 1.0 | 1.0 | 585 | $742 | $1.27 | 21d | 1 | 1.07mi |
| 1307 SW Harrison St Unit 1301 C31 Topeka, KS | 1.0 | 1.0 | 585 | $749 | $1.28 | 21d | 1 | 1.07mi |
| 1252 SW Topeka Blvd Unit B Topeka, KS | 1.0 | 1.0 | — | $845 | — | 21d | 1 | 1.13mi |
| 1252 SW Topeka Blvd Topeka, KS | 1.0 | 1.0 | — | $895 | — | 21d | 1 | 1.13mi |
| 512 SW 14th St Topeka, KS | 2.0 | 1.0 | 815 | $895 | $1.10 | 21d | 1 | 1.16mi |
| 1001 NE Atchison Ave Topeka, KS | 2.0 | 1.0 | 689 | $809 | $1.17 | 21d | 19 | 1.16mi |
| 1251 SW Topeka Blvd Topeka, KS | 1.0 | 1.0 | — | $750 | — | 21d | 1 | 1.17mi |
| 1300 SW Tyler St Topeka, KS | 1.0 | 1.0 | 550 | $590 | $1.07 | 21d | 1 | 1.20mi |
| 2435 SE Colorado Ave Topeka, KS | 3.0 | 1.0 | 1100 | $1,200 | $1.09 | 21d | 1 | 1.29mi |
| 1624 SW Polk St Topeka, KS | 3.0 | 2.0 | 1288 | $1,350 | $1.05 | 21d | 1 | 1.29mi |
| 837 SW Tyler St Unit 827-Unit 19 Topeka, KS | 1.0 | 1.0 | 505 | $662 | $1.31 | 21d | 1 | 1.29mi |
| 837 SW Tyler St Topeka, KS | 1.0 | 1.0 | 505 | $686 | $1.36 | 21d | 1 | 1.29mi |
| 603 SW Topeka Blvd Topeka, KS | 1.0 | 1.0 | 710 | $700 | $0.99 | 21d | 1 | 1.30mi |
| 501 SE 25th St Topeka, KS | 3.0 | 1.5 | 1200 | $1,295 | $1.08 | 21d | 1 | 1.32mi |
| 507 SW 6th Ave Unit 001 Topeka, KS | 1.0 | 1.0 | 710 | $700 | $0.99 | 21d | 1 | 1.32mi |
| 1125 SW Polk St Topeka, KS | 1.0 | 1.0 | 670 | $725 | $1.08 | 21d | 2 | 1.34mi |
| 1205 SW Polk St Topeka, KS | 1.0 | 1.0 | 415 | $686 | $1.65 | 21d | 1 | 1.35mi |
| 1003 SE 26th St Topeka, KS | 2.0 | 1.0 | 656 | $700 | $1.07 | 21d | 1 | 1.35mi |
| 1268 SW Western Ave Unit 1A Topeka, KS | 2.0 | 1.0 | 1404 | $1,000 | $0.71 | 21d | 1 | 1.38mi |
| 101 N Kansas Ave Topeka, KS | 2.0 | 1.0 | 1009 | $1,325 | $1.31 | 21d | 3 | 1.40mi |
| 721 SW Polk St Topeka, KS | 2.0 | 1.0 | 691 | $599 | $0.87 | 21d | 1 | 1.41mi |
| 2351 SE Bellview Ave Topeka, KS | 1.0–3.0 | 1.0–1.5 | 1132 | $1,105 | $0.98 | 21d | 1 | 1.41mi |
| 1256 SW Fillmore St Topeka, KS | 1.0 | 1.0 | — | $495 | — | 21d | 1 | 1.46mi |
| 925 SW Huntoon St Topeka, KS | 1.0 | 1.0 | — | $695 | — | 21d | 1 | 1.47mi |
| 423 SE Winfield Ave Unit 426 Topeka, KS | 1.0 | 1.0 | 675 | $642 | $0.95 | 21d | 1 | 1.48mi |
| 423 SE Winfield Ave Unit 440 Topeka, KS | 2.0 | 1.0 | 675 | $716 | $1.06 | 21d | 1 | 1.48mi |
| 423 SE Winfield Ave Unit 421-23 Arter-423 Arter Topeka, KS | 3.0 | 1.0 | 775 | $910 | $1.17 | 21d | 1 | 1.48mi |
| 423 SE Winfield Ave Unit 430 Topeka, KS | 2.0 | 1.0 | 675 | $728 | $1.08 | 21d | 1 | 1.48mi |
| 423 SE Winfield Ave Unit 441 Topeka, KS | 2.0 | 1.0 | 675 | $682 | $1.01 | 21d | 1 | 1.48mi |
Listing history 16 events
-
2026-06-19days on market $145,000 Active 94 DOM
-
2026-06-18days on market $145,000 Active 93 DOM
-
2026-06-17days on market $145,000 Active 92 DOM
-
2026-06-16days on market $145,000 Active 91 DOM
-
2026-06-15days on market $145,000 Active 90 DOM
-
2026-06-14days on market $145,000 Active 88 DOM
-
2026-06-13days on market $145,000 Active 87 DOM
-
2026-06-10days on market $145,000 Active 85 DOM
-
2026-06-09days on market $145,000 Active 84 DOM
-
2026-06-08days on market $145,000 Active 83 DOM
-
2026-06-07days on market $145,000 Active 82 DOM
-
2026-06-02days on market $145,000 Active 77 DOM
-
2026-06-01days on market $145,000 Active 76 DOM
-
2026-05-31days on market $145,000 Active 75 DOM
-
2026-05-30days on market $145,000 Active 74 DOM
-
2026-03-17$145,000 Active
ⓘ Source: listings_history table (triggers on properties + properties_extension) + one-shot
backfill from property_details.listing_events for pre-trigger history.
Climate risk First Street
- Flood 4/10 Moderate FEMA zone AE · 24% chance over 30 yrs
- Wildfire 1/10 Low
- Heat 4/10 Moderate 7 d/yr ≥107°F today · 17 d/yr by 30 yrs out
- Wind 2/10 Low
- Air quality 3/10 Moderate 3 unhealthy d/yr today · 4 by 30 yrs out
Nearby sold comps map
Loading sold comps map…
Walkable amenities ~0.75 mi
Loading nearby amenities…
Taxation est. · year 1
- Rental income
- $20,184
- − Mortgage interest
- −$8,122
- − Property taxes
- −$2,175
- − Insurance
- −$5,844
- − Repairs & maintenance
- −$1,615
- − Management
- −$1,615
- − Depreciation
- −$4,218
- Taxable loss
- −$3,404
- Est. tax savings @ 24.0%
- +$817
- After-tax cash flow
- $-381/yr
For passive investors: Depreciation is non-cash, so a rental often shows a tax loss while cash-flowing — sheltering income. Rental losses are passive: they offset passive income freely, and up to $25,000/yr can offset ordinary (W-2) income if you actively participate and your MAGI is under $100k (phasing out to $0 by $150k); unused losses carry forward. On sale, claimed depreciation is recaptured at up to 25%, and gains may owe capital-gains tax (a 1031 exchange can defer both). Figures are a year-1 estimate at your 24.0% rate — not tax advice; consult a CPA.
Condition & rehab AI · 6 photos
This two-unit duplex requires moderate renovations to improve its condition and appeal. Upgrading the kitchen and bathrooms, along with enhancing the HVAC system, can significantly increase its value.
Repairs flagged
- Minor Kitchen appliances — Older models may need replacement.
- Minor Bathroom fixtures — Older models may need replacement.
- Minor HVAC units — May need maintenance or minor repairs to ensure efficiency.
Value-add opportunities
- Both Kitchen renovation — Modernizing the kitchen can significantly increase both resale and rental value.
- Both Bathroom updates — Updating bathrooms can also boost both resale and rental value.
- Both HVAC system upgrade — A more efficient HVAC system can improve comfort and energy efficiency, enhancing both resale and rental appeal.
Renovation cost estimate screening
| Repair item | Severity | Est. cost |
|---|---|---|
| Kitchen appliances · Older models may need replacement. | Minor | $500–3,000 |
| Bathroom fixtures · Older models may need replacement. | Minor | $500–3,000 |
| HVAC units · May need maintenance or minor repairs to ensure efficiency. | Minor | $500–3,000 |
| Total estimated repair cost · 3 items | $1,500–9,000 |
Value-add ROI direction
- Both Kitchen renovation — Modernizing the kitchen can significantly increase both resale and rental value. ↑
- Both Bathroom updates — Updating bathrooms can also boost both resale and rental value. ↑
- Both HVAC system upgrade — A more efficient HVAC system can improve comfort and energy efficiency, enhancing both resale and rental appeal. ↑
ⓘ Cost ranges are severity-bucket heuristics (US national rule-of-thumb). Get contractor quotes + a written scope before underwriting a rehab budget.
Schools (NCES district)
- District
- Topeka Public Schools
- NCES district ID
- 2012260
- Math proficiency
- 17% ▼ -8.00%
- Reading proficiency
- 23% ▼ -2.00%
- Median HH income
- $37,405
- Composite
- 16.69/100
- National rank
- #9167
- State rank
- #158 of 169 in KS
Livability — Topeka
- Score
- 69/100
- State rank
- #195
- US rank
- #8848
Category grades
Schools grade is shown separately in the Schools card above.
Census & demographics
- Census place
- Topeka, KS
- City population
- 118,130
- Population (ZIP)
- 9,873
Population outlook (Shawnee County) Hauer SSP2
- Today (2025)
- 179,277 people
- By 2030
- 177,762 · -0.8%
- By 2040
- 172,341 · -3.9%
- By 2050
- 166,330 · -7.2%
- By 2075
- 152,417 · -15.0%
- By 2100
- 134,782 · -24.8%
Race, ethnicity, and origin ACS 2023
- Neighborhood character
- Diverse neighborhood (Simpson 0.67)
- Race & ethnicity
- Hispanic / Latino 43% White 32% Black 20% Two or more races 16% Native American 1%
- Hispanic origin (detail)
- Mexican 38% Puerto Rican 2% Cuban 1%
- Common ancestry
- Lithuanian 2% Iranian 1%
- Foreign-born
- 12% · Canada, Dominican Republic
- Languages at home
- 76% English-only · Spanish 23%
Political lean MEDSL · Shawnee
- 2024 margin
- Toss-up / Even · D 49.3% · R 48.8% · Other 2.0%
- 2008→2024 swing
- +0.8pp no change · 2008: -0.3pp · 2024: 0.5pp
- All cycles
- 2024: D+0.5 2020: D+3.0 2016: R+2.8 2012: R+1.7 2008: R+0.3
Not yet ingested
- Civics
- —
Market trends
- HPI YoY
- ▼ -0.25%
- Current HPI
- 171.7381
- Rent YoY
- —
- Metro
- —
- State GDP YoY
- —
- F500 in state
- 0
Price history
1 event — show timeline
- 2026-03-17 Listed $145,000 Sunflower MLS as distributed by MLS GRID
Cash-flow waterfall
monthlySold comps — $/sqft
last 12 mo · ≤1 miLoading sold comps…