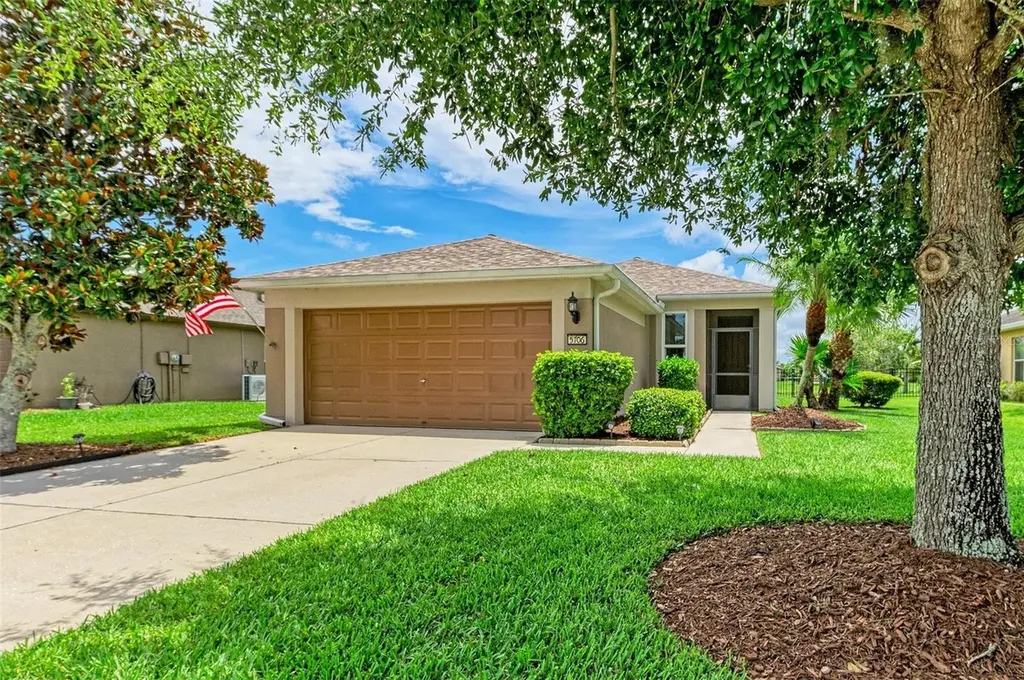
5706 106th Ave E · Bradenton, FL
Flood risk 1/10 · Minimal
- FEMA flood zone
- X (unshaded)
- Chance of flooding over 30 yrs
- 0.0%
- Est. flood insurance / yr
- $507 – $1,088
Fire risk 3/10 · Minor
- Est. fire insurance / yr
- $947 – $1,759
Heat risk 10/10 · Severe
- Hot days now (above 107°F)
- 7 days/yr
- Hot days in 30 yrs
- 28 days/yr
Wind risk 10/10 · Severe
- Chance of severe wind over 30 yrs
- 99.0%
Air-quality risk 3/10 · Minor
- Unhealthy air days now
- 3 days/yr
- Unhealthy air days in 30 yrs
- 3 days/yr
Risk factors via First Street. Map © Google.
Why this score? — see what drove the D- grade
The composite is a weighted blend of 9 inputs, each scored 0–100. Each bar is that input's sub-score; the figure is the points it added to the 100-point composite (weight × sub-score).
- Cash flow +12.9/30.0
- ARV discount +5.6/15.0
- Schools +4.4/10.0
- Livability +4.0/5.0
- DSCR +3.9/10.0
- 1% rule +3.1/10.0
- Condition / age +2.5/5.0
- Rent growth +2.3/5.0
- Appreciation +0.0/10.0
$359,000
🖨 Deal sheet (PDF) 📄 Offer letter ✓ Due diligence
Listing remarks MLS
This "Barclay" floorplan is 1,461 square feet with a large living area that enjoys the home's lot view through 8'-tall sliding glass doors. The entry door opens into a foyer next to the eat in kitchen at the front of the home. The kitchen's breakfastbar overlooks the spacious living/dining area. The owner's suite and bathroom are located at the rear of the home for a private retreat from the two secondary bedrooms. Extra details such as the 9' 4" ceilings, 8' entry door, 8' sliding glass doors, recessed owner's bedroom doorway and vaulted ceiling, and large owner's walk-in closet are a few of the luxuries you'll enjoy as you make this house your home. These homes boast 15-feet or 20-feet distances from the neighbors on either side which is largerthan expected in this area! Located in the quiet town of Parrish, just 25 minutes from downtown St. Petersburg, discover the friendly, walkable neighborhood of Harrison Ranch. This friendly neighborhood boasts an impressive list of reasons why you'll love calling this place home-and it's a great place to raise a family. Ideally situated between the Tampa/St. Pete metropolitan area and the gulf side communities of Sarasota and Bradenton, Harrison Ranch's desirable location is close to great Gulf Coast beaches, shopping centers, family entertainment, and recreation destinations. Residents of Harrison Ranch enjoy a relaxed lifestyle, entertaining and playing within a splendid, state-of-the-art 6,500-square foot community center.
Key facts
- Water views
- Newer roof
- Tile flooring
Tags
Property features AI
Finance
- Other: CDD applies; Homestead exempt; Lease restrictions apply
- HOA & community: HOA managed by Rizzetta & Company; Monthly HOA approximately $12.50 (annual fee $150); HOA covers pool, management and recreational facilities; Community amenities include clubhouse, fitness center, park, playground, pool, tennis courts, basketball court, pickleball courts, trails
Exterior
- Parking: Attached 2-car garage (approx. 19 x 19); Driveway; Garage door opener
- Utilities: Public water; Public sewer; Electricity connected; Cable connected; Water connected; Sewer connected
- Home design: Single family residence; One story; Home faces west; Residential property
- Construction: Block and stucco construction; Shingle roof; Slab foundation; Built using public records building area
- Exterior features: Covered and screened porches (front and rear); Enclosed porch/patio areas; Patio; Porch; Sliding doors; Hurricane shutters; Rain gutters; Exterior lighting; Private mailbox; Sprinkler (metered); Sidewalks; Fenced (other); Irrigation equipment
Interior
- Kitchen: Dishwasher; Range; Microwave; Refrigerator; Eat-in kitchen
- Bedrooms: 3 bedrooms
- Flooring: Hardwood floors; Tile floors
- Bathrooms: 2 full bathrooms
- Heating & cooling: Central heating; Central air conditioning
- Interior features: Ceiling fans; Eat-in kitchen; High ceilings; In-wall pest system; Kitchen/family room combo; Open floorplan; Split bedroom plan; Walk-in closets; Storm windows
- Laundry & utility: Washer; Dryer; Inside laundry / utility
Neighborhood map
What this means for you Summary
Snapshot
- This is a 3-bed/2.0-bath single-family listed at $359k.
Deal economics
- At list price, monthly cash flow is $-28 ($-339/yr) — negative.
- To cash-flow at today's rent, offer at most $354k (1.4% below list).
- To meet the 1% rule (rent ≥ 1% of price), the offer needs to be $290k (19.3% below list).
- Recommended offer: $290k (19.3% below list) — sets the bar for 1% rule.
- Cap rate 6.2% vs local median 3.6% in Bradenton — top-decile yield for the area; either an underpriced asset or a hidden risk that comps aren't pricing in. Stress-test before assuming the spread holds.
Location & tenants
- Location reads 81/100 on livability (#101 in FL, #1,528 nationally) — a professional / high-income tenant draw. Strengths: commute A+, cost of living A+, housing A+; Watch: employment D+, crime D, amenities F.
- Manatee (suburban): math 54% / reading 50% proficiency, ranked #26 of 73 in FL (top 36%) — acceptable for families but not a draw, mixed tenant base, ~2y average lease.
- Zoned schools: Barbara A Harvey Elementary School (math 74% / reading 59%, grade B+, #473 of 2,144 statewide, top 23%, 1,069 students, 33% FRL); Parrish Community High School (math 47% / reading 57%, grade D+, #160 of 667 statewide, top 25%, 2,017 students, 32% FRL) — zoned schools average 33% FRL vs 51% district-wide (18 pts lower); this property's tenant base skews higher-income than the district average.
- Market conditions: Rents soft (-0.9%/yr); 2194 active listings in the ZIP; 6 comparable units currently listed for rent nearby; rentals at typical pace (median 18d on market — plan ~3-4 weeks tenant-placement turnaround); high-income renter base; 7,472 units permitted in Manatee County in 2024 (1,782 in 5+ unit buildings).
- This rent runs 31% of the median local income ($114k/yr) — at the standard rent-burdened threshold; future hikes will face affordability resistance.
Forward outlook
- Local home prices are declining (-3.0%/yr); year-one equity from $2k of loan paydown is wiped out by about $11k of value loss. Plan a longer hold.
- Manatee County population projected at +43% by 2050 — long-run rental-demand tailwind backs the buy-and-hold thesis.
Negotiation context
- It's been on market 20 days — a 2% lower offer ($354k) is reasonable based on typical stale-listing flexibility.
- 2 sale attempts since 15y ago with the ask held roughly flat each time — persistent listings suggest the price (not the market) is what's stuck; bring a comps-based counter.
- Current owner paid $152k; list at $359k implies a 136% gain — meaningful room to come down on a strong offer.
Risks & watch-outs
- Climate carrying-cost: severe wind risk, 99% chance of damaging wind over 30y; extreme-heat days projected 7→28/yr by 2055 (HVAC capex compounding) — expect insurance premiums to compound above CPI over the hold.
Questions for the listing agent
- What do current leases actually rent for vs. the listed asking? Can we see a recent rent roll and the last 12 months of T-12 income?
- What does the HOA fee cover, when was the last increase, and are there any pending special assessments or reserve-fund shortfalls?
- Is there a deadline driving the sale (1031 exchange, divorce, estate, relocation)? That informs how much negotiation room exists.
- Crime grade is D in this area — have there been break-ins, vandalism, or insurance claims at this property in the last 3 years? What carrier currently insures it and at what premium?
- The area grade is low — what's the realistic commute time and amenity access for the typical tenant pool here? Any planned neighborhood developments (good or bad) we should know about?
- What's the average days-on-market for RENTAL listings here right now (not sales)? A rising rental-DOM trend means longer vacancies and softer asking-rent achievability than the comps imply.
- What's the recent tenant-quality profile in this submarket — average credit score on applications, eviction rate, late-payment / NSF rate, and stable-employment percentage? A property-management company in the area should have these aggregated.
- How much new for-sale + rental construction is in the pipeline within 1–3 miles? Heavy new supply typically softens prices + rents 12–24 months out; constrained supply supports both.
Investment metrics
- 1% rule
- 0.81% ✗
- Cap rate
- 6.20%
- Cash-on-cash
- -0.34%
- DSCR
- 0.99
- GRM
- 10.3
CMA / ARV
- ARV (on-the-fly)
- $344,560
- Comps found
- 7
Show comp detail 7 sales within ~0.75 mi
| Address | Dist | Beds/Ba | Sqft | Sold | Price | $/sf | Match |
|---|---|---|---|---|---|---|---|
| 5616 107th Ter E | 0.10mi | 3/2.0 | 1,423 (-2%) | 5mo | $365,000 | $257 | 87 |
| 10817 56th St E | 0.21mi | 3/2.0 | 1,443 (-1%) | 15mo | $341,000 | $236 | 76 |
| 9953 50th Street Cir E | 0.68mi | 3/2.0 | 1,460 (0%) | 16mo | $315,000 | $216 | 56 |
| 9918 50th Street Cir E | 0.73mi | 3/2.0 | 1,460 (0%) | 15mo | $348,000 | $238 | 54 |
| 9767 50th Street Cir E | 0.67mi | 3/2.0 | 1,270 (-13%) | 8mo | $300,000 | $236 | 41 |
| 11311 63rd St E | 0.66mi | 3/2.0 | 1,675 (+15%) | 13mo | $379,000 | $226 | 34 |
| 9766 50th Street Cir E | 0.67mi | 3/2.0 | 1,270 (-13%) | 19mo | $330,000 | $260 | 31 |
Match score weights: distance 35% · size 25% · config 20% · recency 20%. Top-matched comps best support the ARV.
Projected returns pro-forma
-3.0% appreciation · 0.0% rent growth · sell at horizon
- IRR
- -20.1%
- Equity multiple
- 0.32×
- Total profit
- $-68,515
- Equity at exit
- $53,528
- IRR
- -20.7%
- Equity multiple
- 0.05×
- Total profit
- $-95,010
- Equity at exit
- $31,040
Cash invested: $100,520 (down + closing). Projections, not guarantees.
Landlord ↔ Tenant lean methodology
- Overall (STATE)
- 87 Strongly Landlord-Friendly
- State Florida
- 87 Strongly Landlord-Friendly · R+3
- County
- — inherits STATE
- City
- — inherits STATE
ZIP-level market 34219
- Home prices YoY
- -23.7%
- Rents YoY
- -0.9%
- Active inventory
- 2194
- Price-to-rent
- 10.3×
Monthly cashflow live
- Estimated rent
- $2,896 high interval (Pro) →
- Mortgage (P&I)
- −$1,883
- Tax from tax record
- −$272 /mo · $3,262/yr
- Insurance
- −$150
- HOA
- −$12
- Vacancy / Maint / Mgmt
- −$608
- Net cashflow
- $-28
Break-even live
Sensitivity live
| Price | -10% $175 | -5% $73 | +0% $-28 | +5% $-130 | +10% $-231 |
|---|---|---|---|---|---|
| Rent | -10% $-257 | -5% $-143 | +0% $-28 | +5% $86 | +10% $201 |
| Rate | -1.0pp $153 | -0.5pp $63 | base $-28 | +0.5pp $-121 | +1.0pp $-216 |
UW: 25.0% down · 7.5% · 30yr · 1.5% tax · 5.0% vac · 8.0% maint · 8.0% mgmt
Financing live
Cash to close
- Down payment
- $89,750
- Closing costs
- $10,770
- Reserves months
- —
- Total cash needed
- —
Loan-product check · same deal, 3 products live
Conventional
25% down · 7.5% · 30yr
- Down + closing
- —
- Monthly P&I
- —
- Monthly cashflow
- —
- DSCR
- —
- Eligible?
- —
Personal DTI + credit; lowest rate.
DSCR
20% down · 8.5% · 30yr
- Down + closing
- —
- Monthly P&I
- —
- Monthly cashflow
- —
- DSCR
- —
- Eligible?
- —
No personal income docs; deal must DSCR.
Hard money
10% down · 12.0% · 12mo
- Down + closing
- —
- Monthly P&I
- —
- Monthly cashflow
- —
- DSCR
- —
- Eligible?
- —
Short-term bridge; refi at stabilization.
Rent comps 6 comps
| Address | Beds | Baths | Sqft | Rent | $/sqft | DOM | Units | Dist |
|---|---|---|---|---|---|---|---|---|
| 10508 55th Ct E Parrish, FL | 3.0 | 2.0 | 1447 | $3,000 | $2.07 | 25d | 1 | 0.26mi |
| 9922 52nd St E Parrish, FL | 3.0 | 2.0 | 1270 | $2,250 | $1.77 | 5d | 1 | 0.65mi |
| 10610 Eddy Cir Parrish, FL | 1.0–3.0 | 1.0–2.0 | 1082 | $2,495 | $2.30 | 4d | 89 | 0.87mi |
| 11106 Sand Pine Ln Parrish, FL | 3.0 | 2.0 | 1766 | $2,579 | $1.46 | 5d | 1 | 0.99mi |
| 11639 Old Florida Ln Parrish, FL | 3.0 | 2.5 | 1692 | $2,350 | $1.39 | 21d | 1 | 1.34mi |
| 11230 82nd St E Parrish, FL | 3.0 | 2.0 | 1758 | $2,495 | $1.42 | 18d | 1 | 1.49mi |
HOA detail
- Monthly dues
- $12 · $144/yr
Listing history 14 events
-
2026-06-22days on market $359,000 Active 20 DOM
-
2026-06-18days on market $359,000 Active 17 DOM
-
2026-06-17days on market $359,000 Active 16 DOM
-
2026-06-16days on market $359,000 Active 15 DOM
-
2026-06-15days on market $359,000 Active 14 DOM
-
2026-06-13days on market $359,000 Active 12 DOM
-
2026-06-13days on market $359,000 Active 11 DOM
-
2026-06-10days on market $359,000 Active 9 DOM
-
2026-06-09days on market $359,000 Active 8 DOM
-
2026-06-08days on market $359,000 Active 7 DOM
-
2026-06-07days on market $359,000 Active 6 DOM
-
2026-06-03days on market $359,000 Active 2 DOM
-
2026-06-01remarks 699-char remark
-
2026-06-01$359,000 Active 1 DOM
ⓘ Source: listings_history table (triggers on properties + properties_extension) + one-shot
backfill from property_details.listing_events for pre-trigger history.
Tax reassessment forecast FL · Resets to sale price
- Current annual tax
- $3,262 · $272/mo
- Projected year-2 tax
- $3,262 · $272/mo
- Expected delta
- $0/yr ($0/mo · 0.0%)
ⓘ Screening estimate from a state-policy table — verify with the county assessor before closing.
Climate risk First Street
- Flood 1/10 Low FEMA zone X (unshaded) · 0% chance over 30 yrs
- Wildfire 3/10 Moderate
- Heat 10/10 Extreme 7 d/yr ≥107°F today · 28 d/yr by 30 yrs out
- Wind 10/10 Extreme 99% chance of damaging wind over 30 yrs
- Air quality 3/10 Moderate 3 unhealthy d/yr today · 3 by 30 yrs out
Nearby sold comps map
Loading sold comps map…
Walkable amenities ~0.75 mi
Loading nearby amenities…
Taxation est. · year 1
- Rental income
- $34,752
- − Mortgage interest
- −$20,110
- − Property taxes
- −$3,262
- − Insurance
- −$1,795
- − Repairs & maintenance
- −$2,780
- − Management
- −$2,780
- − HOA
- −$144
- − Depreciation
- −$10,444
- Taxable loss
- −$6,563
- Est. tax savings @ 24.0%
- +$1,575
- After-tax cash flow
- $1,236/yr
For passive investors: Depreciation is non-cash, so a rental often shows a tax loss while cash-flowing — sheltering income. Rental losses are passive: they offset passive income freely, and up to $25,000/yr can offset ordinary (W-2) income if you actively participate and your MAGI is under $100k (phasing out to $0 by $150k); unused losses carry forward. On sale, claimed depreciation is recaptured at up to 25%, and gains may owe capital-gains tax (a 1031 exchange can defer both). Figures are a year-1 estimate at your 24.0% rate — not tax advice; consult a CPA.
Schools (NCES district)
- District
- Manatee
- NCES district ID
- 1201230
- Math proficiency
- 54% ▼ -6.00%
- Reading proficiency
- 50% ▼ -2.00%
- Median HH income
- $49,607
- Composite
- 44.43/100
- National rank
- #2806
- State rank
- #26 of 73 in FL
Livability — Bradenton
- Score
- 81/100
- State rank
- #101
- US rank
- #1528
Category grades
Schools grade is shown separately in the Schools card above.
Census & demographics
- County
- Manatee County · 416,364 people
- City population
- 52,177
- Metro
- North Port-Sarasota-Bradenton, FL
- Population (ZIP)
- 33,296
- Household income
- $113,773
- Rent vs Own
- Severe rent burden
- 219.0
Population outlook (Manatee County) Hauer SSP2
- Today (2025)
- 447,342 people
- By 2030
- 488,911 · +9.3%
- By 2040
- 567,934 · +27.0%
- By 2050
- 637,995 · +42.6%
- By 2075
- 781,970 · +74.8%
- By 2100
- 848,272 · +89.6%
Race, ethnicity, and origin ACS 2023
- Neighborhood character
- Predominantly White (75%)
- Race & ethnicity
- White 75% Hispanic / Latino 11% Two or more races 8% Black 8% Asian 2%
- Hispanic origin (detail)
- Mexican 2% Puerto Rican 3%
- Common ancestry
- Romanian 4% Hispanic 2% Russian 2%
- Foreign-born
- 10% · Canada, Dominican Republic, Jamaica
- Languages at home
- 88% English-only · Spanish 7% French/Haitian/Cajun 2% Other Asian/Pacific 1%
Political lean MEDSL · Manatee
- 2024 margin
- Strong R (+23.5) · D 37.9% · R 61.4%
- 2008→2024 swing
- -16.5pp toward R · 2008: -7.0pp · 2024: -23.5pp
- All cycles
- 2024: R+23.5 2020: R+16.1 2016: R+17.1 2012: R+12.5 2008: R+7.0
Not yet ingested
- Civics
- —
Market trends
- HPI YoY
- ▼ -84.45%
- Current HPI
- 271.7131
- Rent YoY
- ▼ -0.95%
- Metro
- North Port-Sarasota-Bradenton, FL
- State GDP YoY
- ▲ 3.28%
- F500 in state
- 36
Industry mix (Fortune 500 HQ in FL)
| Industry | F500 HQs | Revenue |
|---|---|---|
| Industrial Technology | 2 | $29B |
|
||
| Insurance | 2 | $17B |
|
||
| Retail | 1 | $60B |
|
||
| Technology Distribution | 1 | $58B |
|
||
| Homebuilding | 1 | $35B |
|
||
| Technology Manufacturing | 1 | $35B |
|
||
Price history
+128.8% since first listed3 events — show timeline
- 2026-06-01 Listed $359,000 Stellar MLS as Distributed by MLS Grid
- 2012-05-15 Sold (MLS) $152,000 Stellar MLS as Distributed by MLS Grid
- 2011-11-08 Listed $156,900 Stellar MLS as Distributed by MLS Grid
Property tax history
+1.9%/yrLatest (2025): $3,262 · +4.7% YoY. Source: county tax records.
Cash-flow waterfall
monthlySold comps — $/sqft
last 12 mo · ≤1 miLoading sold comps…