317 W Randolph St · Bevier, MO
Flood risk 1/10 · Minimal
- FEMA flood zone
- X (unshaded)
- Chance of flooding over 30 yrs
- 0.0%
- Est. flood insurance / yr
- $507 – $1,088
Fire risk 4/10 · Minor
- Est. fire insurance / yr
- $1,054 – $1,958
Heat risk 3/10 · Minor
- Hot days now (above 107°F)
- 7 days/yr
- Hot days in 30 yrs
- 16 days/yr
Wind risk 2/10 · Minimal
- Chance of severe wind over 30 yrs
- —
Air-quality risk 2/10 · Minimal
- Unhealthy air days now
- 0 days/yr
- Unhealthy air days in 30 yrs
- 2 days/yr
Risk factors via First Street. Map © Google.
Why this score? — see what drove the C grade
The composite is a weighted blend of 9 inputs, each scored 0–100. Each bar is that input's sub-score; the figure is the points it added to the 100-point composite (weight × sub-score).
- Cash flow +20.7/30.0
- ARV discount +7.5/15.0
- DSCR +6.6/10.0
- Appreciation +6.1/10.0
- 1% rule +4.3/10.0
- Schools +4.0/10.0
- Livability +3.1/5.0
- Rent growth +2.5/5.0
- Condition / age +2.5/5.0
$89,900
🖨 Deal sheet 📄 Offer letter ✓ Due diligence
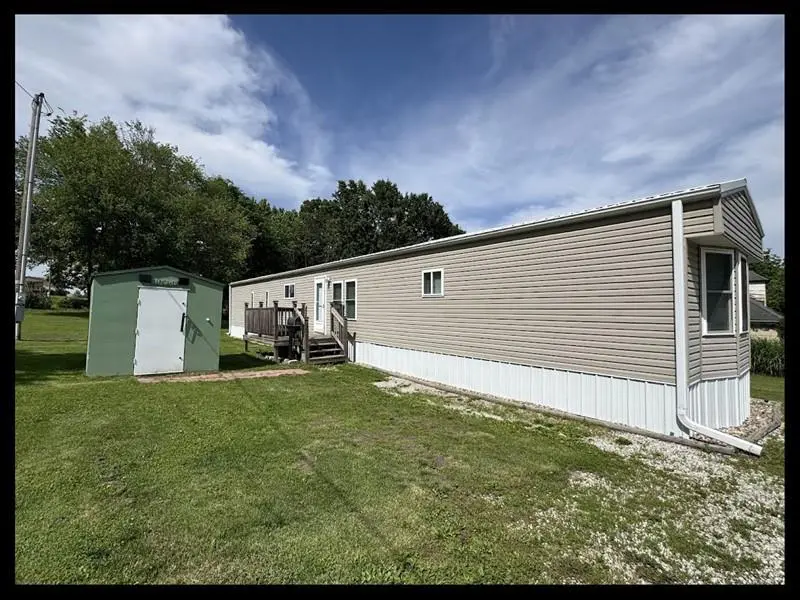
Listing remarks
Freshly updated 3BR/2BA manufactured home on a nice level lot! This clean, move-in ready home features fresh paint, updated flooring throughout, and a spacious designated primary suite. Enjoy the outdoors from the front and back decks—perfect for relaxing or grilling. Kitchen appliances stay for added convenience. The large yard offers plenty of room for a garden, pets, or future fencing. A secure shed provides extra storage and storm safety. Clean, fresh, and ready for you to call home! Call or text Sonja at 660-651-4107 or the Tiger Team at 660-385-7297
Key facts
- Secure shed
- Large yard
- Updated flooring
Tags
Property features AI
Finance
- Other: Lot approximately 100x150
Exterior
- Security: Smoke detector(s)
- Utilities: Public water; Public sewer; Cable available
- Home design: Single-family residence; Residential property
- Construction: Vinyl siding; Metal roof; Crawl space foundation; Built with vinyl siding and metal roof
- Exterior features: Deck
Interior
- Kitchen: Electric oven; Electric range; Microwave; Refrigerator
- Flooring: Vinyl
- Bathrooms: 2 full bathrooms
- Heating & cooling: Central air conditioning
- Interior features: Electric oven; Electric range; Microwave; Refrigerator; Electric water heater; Vinyl flooring
- Laundry & utility: Electric water heater
Neighborhood map
What this means for you Summary
Snapshot
- This is a 1-bed/2.0-bath manufactured listed at $90k.
Deal economics
- At list price, monthly cash flow is $122 ($1k/yr) — positive.
- The deal already cash-flows at list — no discount required.
- To meet the 1% rule (rent ≥ 1% of price), the offer needs to be $84k (6.5% below list).
- Recommended offer: $84k (6.5% below list) — sets the bar for 1% rule.
Location & tenants
- Location reads 61/100 on livability (#425 in MO) — a middle-class / working-renter tenant base. Strengths: cost of living A+, housing A+; Watch: employment D+, crime F, amenities F.
- Bevier C-4 (rural): math 40% / reading 50% proficiency, ranked #212 of 535 in MO (top 40%) — families likely to look elsewhere, expect single-tenant / working-renter base with shorter leases.
- Market conditions: 7 active listings in the ZIP; 26 units permitted in Macon County in 2024 (19 in 5+ unit buildings).
Forward outlook
- In year one you build about $3k of equity ($622 loan paydown + $2k appreciation (2.3% local appreciation)).
- Macon County population projected at -17% by 2050 — secular population decline; favor cash flow + early exit over multi-decade hold.
- At projected returns (2.3% appreciation + 3.0% rent growth), your $25k cash investment doubles in ~6 years — after that, you're playing with house money.
Negotiation context
- It's been on market 22 days — a 2% lower offer ($89k) is reasonable based on typical stale-listing flexibility.
Questions for the listing agent
- Is there a deadline driving the sale (1031 exchange, divorce, estate, relocation)? That informs how much negotiation room exists.
- Crime grade is F in this area — have there been break-ins, vandalism, or insurance claims at this property in the last 3 years? What carrier currently insures it and at what premium?
- What's the average days-on-market for RENTAL listings here right now (not sales)? A rising rental-DOM trend means longer vacancies and softer asking-rent achievability than the comps imply.
- What's the recent tenant-quality profile in this submarket — average credit score on applications, eviction rate, late-payment / NSF rate, and stable-employment percentage? A property-management company in the area should have these aggregated.
- How much new for-sale + rental construction is in the pipeline within 1–3 miles? Heavy new supply typically softens prices + rents 12–24 months out; constrained supply supports both.
Investment metrics
- 1% rule
- 0.93% ✗
- Cap rate
- 7.92%
- Cash-on-cash
- 5.80%
- DSCR
- 1.26
- GRM
- 8.9
CMA / ARV
No comps found within radius.
Projected returns pro-forma
2.28% appreciation · 3.0% rent growth · sell at horizon
- IRR
- 11.0%
- Equity multiple
- 1.60×
- Total profit
- $15,164
- Equity at exit
- $36,830
- IRR
- 13.7%
- Equity multiple
- 2.88×
- Total profit
- $47,416
- Equity at exit
- $54,111
Cash invested: $25,172 (down + closing). Projections, not guarantees.
Landlord ↔ Tenant lean methodology
- Overall (STATE)
- 81 Strongly Landlord-Friendly
- State Missouri
- 81 Strongly Landlord-Friendly · R+10
- County
- — inherits STATE
- City
- — inherits STATE
ZIP-level market 63532
- Home prices YoY
- 2.2%
- Active inventory
- 7
- Price-to-rent
- 8.9×
Monthly cashflow live
- Estimated rent
- $840 medium interval (Pro) →
- Mortgage (P&I)
- −$471
- Tax from tax record
- −$33 /mo · $399/yr
- Insurance
- −$37
- HOA
- −$0
- Vacancy / Maint / Mgmt
- −$176
- Net cashflow
- $122
Break-even live
UW: 25.0% down · 7.5% · 30yr · 1.5% tax · 5.0% vac · 8.0% maint · 8.0% mgmt
Financing live
Cash to close
- Down payment
- $22,475
- Closing costs
- $2,697
- Reserves months
- —
- Total cash needed
- —
Loan-product check · same deal, 3 products live
Conventional
25% down · 7.5% · 30yr
- Down + closing
- —
- Monthly P&I
- —
- Monthly cashflow
- —
- DSCR
- —
- Eligible?
- —
Personal DTI + credit; lowest rate.
DSCR
20% down · 8.5% · 30yr
- Down + closing
- —
- Monthly P&I
- —
- Monthly cashflow
- —
- DSCR
- —
- Eligible?
- —
No personal income docs; deal must DSCR.
Hard money
10% down · 12.0% · 12mo
- Down + closing
- —
- Monthly P&I
- —
- Monthly cashflow
- —
- DSCR
- —
- Eligible?
- —
Short-term bridge; refi at stabilization.
Listing history 14 events
-
2026-06-18days on market $89,900 Active 22 DOM
-
2026-06-17days on market $89,900 Active 21 DOM
-
2026-06-16days on market $89,900 Active 20 DOM
-
2026-06-15days on market $89,900 Active 19 DOM
-
2026-06-13days on market $89,900 Active 17 DOM
-
2026-06-12days on market $89,900 Active 16 DOM
-
2026-06-09days on market $89,900 Active 13 DOM
-
2026-06-08days on market $89,900 Active 12 DOM
-
2026-06-07days on market $89,900 Active 11 DOM
-
2026-06-05days on market $89,900 Active 9 DOM
-
2026-06-04days on market $89,900 Active 7 DOM
-
2026-06-02days on market $89,900 Active 6 DOM
-
2026-06-01days on market $89,900 Active 5 DOM
-
2026-05-31days on market $89,900 Active 4 DOM
ⓘ Source: listings_history table (triggers on properties + properties_extension) + one-shot
backfill from property_details.listing_events for pre-trigger history.
Tax reassessment forecast MO · Resets to sale price
- Current annual tax
- $399 · $33/mo
- Projected year-2 tax
- $872 · $73/mo
- Expected delta
- +$473/yr (+$39/mo · 118.6%)
ⓘ Screening estimate from a state-policy table — verify with the county assessor before closing.
Climate risk First Street
- Flood 1/10 Low FEMA zone X (unshaded) · 0% chance over 30 yrs
- Wildfire 4/10 Moderate
- Heat 3/10 Moderate 7 d/yr ≥107°F today · 16 d/yr by 30 yrs out
- Wind 2/10 Low
- Air quality 2/10 Low 0 unhealthy d/yr today · 2 by 30 yrs out
Nearby sold comps map
Loading sold comps map…
Walkable amenities ~0.75 mi
Loading nearby amenities…
Taxation est. · year 1
- Rental income
- $10,083
- − Mortgage interest
- −$5,036
- − Property taxes
- −$399
- − Insurance
- −$450
- − Repairs & maintenance
- −$807
- − Management
- −$807
- − Depreciation
- −$2,615
- Taxable loss
- −$30
- Est. tax savings @ 24.0%
- +$7
- After-tax cash flow
- $1,467/yr
For passive investors: Depreciation is non-cash, so a rental often shows a tax loss while cash-flowing — sheltering income. Rental losses are passive: they offset passive income freely, and up to $25,000/yr can offset ordinary (W-2) income if you actively participate and your MAGI is under $100k (phasing out to $0 by $150k); unused losses carry forward. On sale, claimed depreciation is recaptured at up to 25%, and gains may owe capital-gains tax (a 1031 exchange can defer both). Figures are a year-1 estimate at your 24.0% rate — not tax advice; consult a CPA.
Schools (NCES district)
- District
- Bevier C-4
- NCES district ID
- 2904980
- Math proficiency
- 40% ▲ 5.00%
- Reading proficiency
- 50% ▲ 20.00%
- Median HH income
- $38,757
- Composite
- 39.77/100
- National rank
- #7984
- State rank
- #212 of 535 in MO
Livability — Bevier
- Score
- 61/100
- State rank
- #425
- US rank
- #17627
Category grades
Schools grade is shown separately in the Schools card above.
Census & demographics
- Census place
- Bevier, MO
- Population (ZIP)
- 1,286
Population outlook (Macon County) Hauer SSP2
- Today (2025)
- 14,692 people
- By 2030
- 14,209 · -3.3%
- By 2040
- 13,197 · -10.2%
- By 2050
- 12,160 · -17.2%
- By 2075
- 9,745 · -33.7%
- By 2100
- 7,314 · -50.2%
Race, ethnicity, and origin ACS 2023
- Neighborhood character
- Predominantly White (96%)
- Race & ethnicity
- White 96% Two or more races 1%
- Common ancestry
- Romanian 2% Iranian 1% German 1%
- Foreign-born
- 0%
- Languages at home
- 99% English-only · Spanish 1%
Political lean MEDSL · Macon
- 2024 margin
- Solid R (+61.5) · D 18.9% · R 80.4%
- 2008→2024 swing
- -37.4pp toward R · 2008: -24.1pp · 2024: -61.5pp
- All cycles
- 2024: R+61.5 2020: R+56.3 2016: R+56.4 2012: R+33.4 2008: R+24.1
Not yet ingested
- Civics
- —
Market trends
- HPI YoY
- ▲ 2.28%
- Current HPI
- 103.9218
- Rent YoY
- —
- Metro
- —
- State GDP YoY
- ▲ 1.84%
- F500 in state
- 20
Industry mix (Fortune 500 HQ in MO)
| Industry | F500 HQs | Revenue |
|---|---|---|
| Healthcare | 1 | $163B |
|
||
| Insurance | 1 | $21B |
|
||
| Industrial Technology | 1 | $17B |
|
||
| Retail | 1 | $16B |
|
||
| Industrial Distribution | 1 | $10B |
|
||
| Utilities | 1 | $9B |
|
||
Price history
2 events — show timeline
- 2026-05-27 Listed $89,900 NECAR
- 2021-11-19 Sold (Public Records) — Public Records
Property tax history
-5.2%/yrLatest (2025): $399 · +18.1% YoY. Source: county tax records.
Cash-flow waterfall
monthlySold comps — $/sqft
last 12 mo · ≤1 miLoading sold comps…