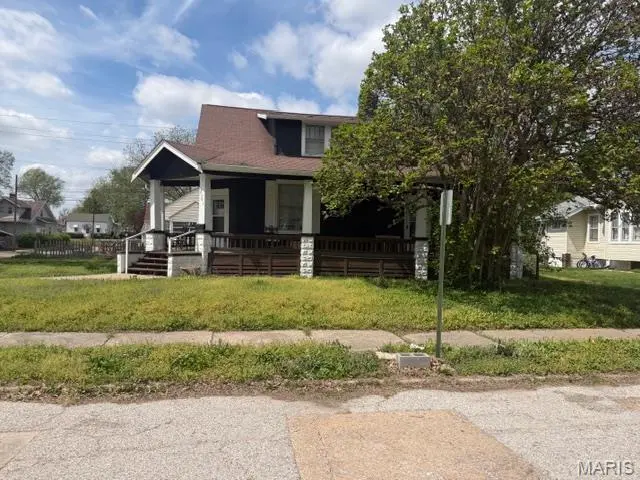
1301 N Charles St · Belleville, IL
Flood risk 1/10 · Minimal
- FEMA flood zone
- X
- Chance of flooding over 30 yrs
- 0.0%
- Est. flood insurance / yr
- $473 – $860
Fire risk 1/10 · Minimal
- Est. fire insurance / yr
- $804 – $1,492
Heat risk 5/10 · Moderate
- Hot days now (above 107°F)
- 7 days/yr
- Hot days in 30 yrs
- 21 days/yr
Wind risk 2/10 · Minimal
- Chance of severe wind over 30 yrs
- 1.0%
Air-quality risk 4/10 · Minor
- Unhealthy air days now
- 3 days/yr
- Unhealthy air days in 30 yrs
- 6 days/yr
Risk factors via First Street. Map © Google.
Why this score? — see what drove the B+ grade
The composite is a weighted blend of 9 inputs, each scored 0–100. Each bar is that input's sub-score; the figure is the points it added to the 100-point composite (weight × sub-score).
- Cash flow +30.0/30.0
- ARV discount +15.0/15.0
- 1% rule +10.0/10.0
- DSCR +10.0/10.0
- Rent growth +4.3/5.0
- Livability +3.9/5.0
- Condition / age +2.5/5.0
- Schools +2.2/10.0
- Appreciation +0.0/10.0
$84,900
🖨 Deal sheet 📄 Offer letter ✓ Due diligence
Listing remarks MLS
Great Investment Opportunity in Belleville! Duplex w/ 3 Bedroom/ 1 Full Bath Unit and 1 Bedroom/ 1 Bath Unit. The 3 Bedroom Unit, 1301 N Charles, features approxi 1800 Square Feet of living Space. Main Level: Living Room, Large Eat In Kitchen w/ Pantry and enclosed Porch w/ Door to side yard and Basement. Upstairs: Three bedrooms, 2 walk-in closets and a Full Bathroom. The Right Side, 1303 N Charles, 1 Bedroom/1 Bath Unit Features a living room w/ walk in closet storage closet, full bath, eat-in kitchen, walk in butlers pantry and bedroom. Both sides have access to the basement/Laundry/Storage. Ready to start or build your portfolio of investment properties? Here is your chance! No utilities included with rent. Just a block from Jefferson Elementry School. Close to Shopping, bus stop and downtown belleville. This Property is being Sold As Is. Cash and Conventional Financing Only.
Key facts
- Updated baths
- Extra light
- Great curb appeal
Tags
Property features AI
Finance
- Financial info: Property listed as residential income (2 units)
Exterior
- Home design: Residential income property; 2–4 unit building (2 total units)
- Construction: Frame construction
- Exterior features: Lot approximately 0.18 acre
Interior
- Bedrooms: One unit with 3 bedrooms; One unit with 1 bedroom
- Bathrooms: Each unit has 1 bathroom
- Heating & cooling: Central heating/air; Wall/window unit cooling
- Interior features: Unfinished basement; Central air; Wall/window air conditioning units
Neighborhood map
What this means for you Summary
Snapshot
- This is a 4-bed/4.0-bath single-family listed at $85k.
Deal economics
- At list price, monthly cash flow is $514 ($6k/yr) — positive.
- The deal already cash-flows at list — no discount required.
- Meets the 1% rule at list price ($2k rent vs $85k).
- Recommended offer: $82k (3.0% below list) — sets the bar for market timing.
- Cap rate 13.6% vs local median 5.6% in Belleville — top-decile yield for the area; either an underpriced asset or a hidden risk that comps aren't pricing in. Stress-test before assuming the spread holds.
Location & tenants
- Location reads 78/100 on livability (#142 in IL, #2,604 nationally) — a middle-class / working-renter tenant base. Strengths: commute A+, cost of living A+, housing A+; Watch: crime F, amenities D-.
- Belleville Twp Hsd 201 (suburban): math 21% / reading 28% proficiency, ranked #308 of 620 in IL (top 50%) — low school quality limits family demand, transient renter base, plan for 1-2y turnover.
- Zoned schools: Belleville High School-East (math 23% / reading 30%, grade F, #241 of 693 statewide, top 35%, 2,568 students, 0% FRL).
- Market conditions: Rents rising fast (+7.0%/yr); 157 active listings in the ZIP; 6 comparable units currently listed for rent nearby; rentals at typical pace (median 24d on market — plan ~3-4 weeks tenant-placement turnaround); solid renter incomes; 783 units permitted in St. Clair County in 2024 (378 in 5+ unit buildings).
Forward outlook
- Local home prices are declining (-3.0%/yr); year-one equity from $587 of loan paydown is wiped out by about $3k of value loss. Plan a longer hold.
- St. Clair County population projected at -23% by 2050 — secular population decline; favor cash flow + early exit over multi-decade hold.
- At projected returns (-3.0% appreciation + 7.0% rent growth), your $24k cash investment doubles in ~5 years — after that, you're playing with house money.
Negotiation context
- It's been on market 56 days — a 3% lower offer ($82k) is reasonable based on typical stale-listing flexibility.
- 4 sale attempts since 3y ago; this cycle's ask has dropped $58k (41%) from the opening price — seller is motivated, your offer sets the floor, not the list.
- Current owner paid $68k; 25% above their basis — modest negotiation headroom, anchor on the comps not their cost.
Risks & watch-outs
- Watch-outs: property tax is 4.0% of price; built in 1902 — expect roof / HVAC / electrical / plumbing capex.
- Climate carrying-cost: extreme-heat days projected 7→21/yr by 2055 (HVAC capex compounding) — expect insurance premiums to compound above CPI over the hold.
Questions for the listing agent
- It's been on market 56 days. Have you received any prior offers? Is the seller open to a 3% concession, seller financing, or rate buy-down credit?
- Built in 1902 — when were the roof, HVAC, electrical panel, plumbing, and water heater last replaced?
- Property tax is high relative to price — has the assessment been appealed recently, and will the sale trigger a re-assessment?
- Is there a deadline driving the sale (1031 exchange, divorce, estate, relocation)? That informs how much negotiation room exists.
- Crime grade is F in this area — have there been break-ins, vandalism, or insurance claims at this property in the last 3 years? What carrier currently insures it and at what premium?
- What's the average days-on-market for RENTAL listings here right now (not sales)? A rising rental-DOM trend means longer vacancies and softer asking-rent achievability than the comps imply.
- What's the recent tenant-quality profile in this submarket — average credit score on applications, eviction rate, late-payment / NSF rate, and stable-employment percentage? A property-management company in the area should have these aggregated.
- How much new for-sale + rental construction is in the pipeline within 1–3 miles? Heavy new supply typically softens prices + rents 12–24 months out; constrained supply supports both.
Investment metrics
- 1% rule
- 1.91% ✓
- Cap rate
- 13.56%
- Cash-on-cash
- 25.94%
- DSCR
- 2.15
- GRM
- 4.4
CMA / ARV
- ARV (on-the-fly)
- $135,454
- Comps found
- 12
Show comp detail 12 sales within ~0.75 mi
| Address | Dist | Beds/Ba | Sqft | Sold | Price | $/sf | Match |
|---|---|---|---|---|---|---|---|
| 1316 N Church St | 0.05mi | 3/1.0 (-1) | 1,500 (+4%) | 2mo | $150,000 | $100 | 72 |
| 1715 Scheel St | 0.27mi | 3/2.5 (-1) | 1,509 (+5%) | 2mo | $230,000 | $152 | 67 |
| 811 Lebanon Ave | 0.15mi | 3/2.0 (-1) | 1,515 (+5%) | 8mo | $179,900 | $119 | 64 |
| 1224 N Charles St | 0.03mi | 3/1.0 (-1) | 1,333 (-8%) | 8mo | $125,000 | $94 | 62 |
| 1631 N Church St | 0.33mi | 3/2.0 (-1) | 1,588 (+10%) | 2mo | $149,900 | $94 | 53 |
| 1615 E Belle Ave | 0.30mi | 3/1.0 (-1) | 1,600 (+11%) | 6mo | $132,000 | $83 | 46 |
| 1107 Bristow St | 0.32mi | 3/1.0 (-1) | 1,230 (-15%) | 4mo | $90,000 | $73 | 41 |
| 9 N Delaware Ave | 0.73mi | 3/1.0 (-1) | 1,368 (-5%) | 4mo | $130,000 | $95 | 37 |
| 1414 Lebanon Ave | 0.57mi | 3/1.0 (-1) | 1,604 (+11%) | 2mo | $135,900 | $85 | 36 |
| 619 E A St | 0.73mi | 3/2.0 (-1) | 1,568 (+9%) | 6mo | $45,000 | $29 | 33 |
| 221 N Church St | 0.74mi | 3/1.5 (-1) | 1,582 (+10%) | 1mo | $70,000 | $44 | 33 |
| 2000 E C St | 0.66mi | 3/2.0 (-1) | 1,634 (+13%) | 6mo | $230,000 | $141 | 29 |
Match score weights: distance 35% · size 25% · config 20% · recency 20%. Top-matched comps best support the ARV.
Projected returns pro-forma
-3.0% appreciation · 7.04% rent growth · sell at horizon
- IRR
- 24.9%
- Equity multiple
- 2.09×
- Total profit
- $25,953
- Equity at exit
- $12,659
- IRR
- 35.5%
- Equity multiple
- 5.03×
- Total profit
- $95,814
- Equity at exit
- $7,341
Cash invested: $23,772 (down + closing). Projections, not guarantees.
Landlord ↔ Tenant lean methodology
- Overall (STATE)
- 43 Moderately Tenant-Leaning
- State Illinois
- 43 Moderately Tenant-Leaning · D+7
- County
- — inherits STATE
- City
- — inherits STATE
ZIP-level market 62221
- Home prices YoY
- -24.2%
- Rents YoY
- 7.0%
- Active inventory
- 157
- Price-to-rent
- 4.4×
Monthly cashflow live
- Estimated rent
- $1,618 high interval (Pro) →
- Mortgage (P&I)
- −$445
- Tax from tax record
- −$283 /mo · $3,402/yr
- Insurance
- −$35
- HOA
- −$0
- Vacancy / Maint / Mgmt
- −$340
- Net cashflow
- $514
Break-even live
UW: 25.0% down · 7.5% · 30yr · 1.5% tax · 5.0% vac · 8.0% maint · 8.0% mgmt
Financing live
Cash to close
- Down payment
- $21,225
- Closing costs
- $2,547
- Reserves months
- —
- Total cash needed
- —
Loan-product check · same deal, 3 products live
Conventional
25% down · 7.5% · 30yr
- Down + closing
- —
- Monthly P&I
- —
- Monthly cashflow
- —
- DSCR
- —
- Eligible?
- —
Personal DTI + credit; lowest rate.
DSCR
20% down · 8.5% · 30yr
- Down + closing
- —
- Monthly P&I
- —
- Monthly cashflow
- —
- DSCR
- —
- Eligible?
- —
No personal income docs; deal must DSCR.
Hard money
10% down · 12.0% · 12mo
- Down + closing
- —
- Monthly P&I
- —
- Monthly cashflow
- —
- DSCR
- —
- Eligible?
- —
Short-term bridge; refi at stabilization.
Rent comps 6 comps
| Address | Beds | Baths | Sqft | Rent | $/sqft | DOM | Units | Dist |
|---|---|---|---|---|---|---|---|---|
| 1107 Bristow St Belleville, IL | 3.0 | 1.0 | 1238 | $1,500 | $1.21 | 12d | 1 | 0.33mi |
| 1717 La Salle St Belleville, IL | 3.0 | 1.0 | 1104 | $1,350 | $1.22 | 23d | 1 | 0.48mi |
| 1 Rosehaven Dr Belleville, IL | 3.0 | 2.0 | 1512 | $1,325 | $0.88 | 23d | 1 | 0.64mi |
| 1528 Lebanon Ave Belleville, IL | 4.0 | 2.0 | 1600 | $1,950 | $1.22 | 23d | 1 | 0.71mi |
| 25 Glencoe Dr Belleville, IL | 3.0 | 1.0 | 1200 | $1,275 | $1.06 | 23d | 1 | 0.84mi |
| 721 S Church St Belleville, IL | 4.0 | 2.0 | 1216 | $2,000 | $1.64 | 23d | 1 | 1.37mi |
Listing history 22 events
-
2026-06-18days on market $84,900 Active 56 DOM
-
2026-06-17pricedays on market $84,900 Active 55 DOM
-
2026-06-16days on market $99,900 Active 54 DOM
-
2026-06-15days on market $99,900 Active 53 DOM
-
2026-06-13days on market $99,900 Active 51 DOM
-
2026-06-09days on market $99,900 Active 47 DOM
-
2026-06-08days on market $99,900 Active 46 DOM
-
2026-06-07pricedays on market $99,900 Active 45 DOM
-
2026-06-03days on market $125,000 Active 41 DOM
-
2026-06-02days on market $125,000 Active 40 DOM
-
2026-06-01days on market $125,000 Active 39 DOM
-
2026-05-31days on market $125,000 Active 38 DOM
-
2026-05-21price $125,000
-
2026-05-05price $135,000
-
2026-04-23$143,000 Active
-
2024-12-26status Active
-
2024-11-22historical Active Under Contract
-
2024-11-08$165,000 Active
-
2023-04-06soldstatus Closed 895-char remark
Show marketing remark (895 chars)
Great Investment Opportunity in Belleville! Duplex w/ 3 Bedroom/ 1 Full Bath Unit and 1 Bedroom/ 1 Bath Unit. The 3 Bedroom Unit, 1301 N Charles, features approxi 1800 Square Feet of living Space. Main Level: Living Room, Large Eat In Kitchen w/ Pantry and enclosed Porch w/ Door to side yard and Basement. Upstairs: Three bedrooms, 2 walk-in closets and a Full Bathroom. The Right Side, 1303 N Charles, 1 Bedroom/1 Bath Unit Features a living room w/ walk in closet storage closet, full bath, eat-in kitchen, walk in butlers pantry and bedroom. Both sides have access to the basement/Laundry/Storage. Ready to start or build your portfolio of investment properties? Here is your chance! No utilities included with rent. Just a block from Jefferson Elementry School. Close to Shopping, bus stop and downtown belleville. This Property is being Sold As Is. Cash and Conventional Financing Only.
-
2023-03-20status Pending 895-char remark
Show marketing remark (895 chars)
Great Investment Opportunity in Belleville! Duplex w/ 3 Bedroom/ 1 Full Bath Unit and 1 Bedroom/ 1 Bath Unit. The 3 Bedroom Unit, 1301 N Charles, features approxi 1800 Square Feet of living Space. Main Level: Living Room, Large Eat In Kitchen w/ Pantry and enclosed Porch w/ Door to side yard and Basement. Upstairs: Three bedrooms, 2 walk-in closets and a Full Bathroom. The Right Side, 1303 N Charles, 1 Bedroom/1 Bath Unit Features a living room w/ walk in closet storage closet, full bath, eat-in kitchen, walk in butlers pantry and bedroom. Both sides have access to the basement/Laundry/Storage. Ready to start or build your portfolio of investment properties? Here is your chance! No utilities included with rent. Just a block from Jefferson Elementry School. Close to Shopping, bus stop and downtown belleville. This Property is being Sold As Is. Cash and Conventional Financing Only.
-
2023-02-16$129,900 Active 895-char remark
Show marketing remark (895 chars)
Great Investment Opportunity in Belleville! Duplex w/ 3 Bedroom/ 1 Full Bath Unit and 1 Bedroom/ 1 Bath Unit. The 3 Bedroom Unit, 1301 N Charles, features approxi 1800 Square Feet of living Space. Main Level: Living Room, Large Eat In Kitchen w/ Pantry and enclosed Porch w/ Door to side yard and Basement. Upstairs: Three bedrooms, 2 walk-in closets and a Full Bathroom. The Right Side, 1303 N Charles, 1 Bedroom/1 Bath Unit Features a living room w/ walk in closet storage closet, full bath, eat-in kitchen, walk in butlers pantry and bedroom. Both sides have access to the basement/Laundry/Storage. Ready to start or build your portfolio of investment properties? Here is your chance! No utilities included with rent. Just a block from Jefferson Elementry School. Close to Shopping, bus stop and downtown belleville. This Property is being Sold As Is. Cash and Conventional Financing Only.
-
2005-03-22soldstatus $68,000
ⓘ Source: listings_history table (triggers on properties + properties_extension) + one-shot
backfill from property_details.listing_events for pre-trigger history.
Tax reassessment forecast IL · Partial reset (capped growth)
- Current annual tax
- $3,402 · $283/mo
- Projected year-2 tax
- $3,402 · $283/mo
- Expected delta
- $0/yr ($0/mo · 0.0%)
ⓘ Screening estimate from a state-policy table — verify with the county assessor before closing.
Climate risk First Street
- Flood 1/10 Low FEMA zone X · 0% chance over 30 yrs
- Wildfire 1/10 Low
- Heat 5/10 Major 7 d/yr ≥107°F today · 21 d/yr by 30 yrs out
- Wind 2/10 Low 100% chance of damaging wind over 30 yrs
- Air quality 4/10 Moderate 3 unhealthy d/yr today · 6 by 30 yrs out
Nearby sold comps map
Loading sold comps map…
Walkable amenities ~0.75 mi
Loading nearby amenities…
Taxation est. · year 1
- Rental income
- $19,413
- − Mortgage interest
- −$4,756
- − Property taxes
- −$3,402
- − Insurance
- −$424
- − Repairs & maintenance
- −$1,553
- − Management
- −$1,553
- − Depreciation
- −$2,470
- Taxable income
- $5,255
- Est. tax owed @ 24.0%
- −$1,261
- After-tax cash flow
- $4,906/yr
For passive investors: Depreciation is non-cash, so a rental often shows a tax loss while cash-flowing — sheltering income. Rental losses are passive: they offset passive income freely, and up to $25,000/yr can offset ordinary (W-2) income if you actively participate and your MAGI is under $100k (phasing out to $0 by $150k); unused losses carry forward. On sale, claimed depreciation is recaptured at up to 25%, and gains may owe capital-gains tax (a 1031 exchange can defer both). Figures are a year-1 estimate at your 24.0% rate — not tax advice; consult a CPA.
Schools (NCES district)
- District
- Belleville Twp Hsd 201
- NCES district ID
- 1705640
- Math proficiency
- 21% ▼ -8.00%
- Reading proficiency
- 28% ▼ -3.00%
- Median HH income
- $58,064
- Composite
- 22.39/100
- National rank
- #8115
- State rank
- #308 of 620 in IL
Livability — Belleville
- Score
- 78/100
- State rank
- #142
- US rank
- #2604
Category grades
Schools grade is shown separately in the Schools card above.
Census & demographics
- Census place
- Belleville, IL
- County
- Saint Clair County · 169,691 people
- City population
- 47,407
- Metro
- St. Louis, MO-IL
- Population (ZIP)
- 29,875
- Household income
- $82,271
- Rent vs Own
- Severe rent burden
- 658.0
Population outlook (St. Clair County) Hauer SSP2
- Today (2025)
- 250,366 people
- By 2030
- 240,511 · -3.9%
- By 2040
- 217,391 · -13.2%
- By 2050
- 192,699 · -23.0%
- By 2075
- 140,637 · -43.8%
- By 2100
- 100,499 · -59.9%
Race, ethnicity, and origin ACS 2023
- Neighborhood character
- Diverse neighborhood (Simpson 0.58)
- Race & ethnicity
- White 56% Black 31% Two or more races 6% Hispanic / Latino 3% Asian 2%
- Common ancestry
- Lithuanian 4% Romanian 2% Slovak 2%
- Foreign-born
- 3% · Canada, South Korea
- Languages at home
- 94% English-only · Spanish 2% German/W. Germanic 1% French/Haitian/Cajun 1%
Political lean MEDSL · St. Clair
- 2024 margin
- Lean D (+7.9) · D 53.0% · R 45.1% · Other 1.8%
- 2008→2024 swing
- -14.6pp toward R · 2008: 22.4pp · 2024: 7.9pp
- All cycles
- 2024: D+7.9 2020: D+8.7 2016: D+5.6 2012: D+14.5 2008: D+22.4
Not yet ingested
- Civics
- —
Market trends
- HPI YoY
- ▼ -53.50%
- Current HPI
- 167.8124
- Rent YoY
- ▲ 7.04%
- Metro
- St. Louis, MO-IL
- State GDP YoY
- ▲ 1.59%
- F500 in state
- 60
Industry mix (Fortune 500 HQ in IL)
| Industry | F500 HQs | Revenue |
|---|---|---|
| Insurance | 4 | $201B |
|
||
| Consumer Goods | 4 | $87B |
|
||
| Industrial Machinery | 3 | $64B |
|
||
| Healthcare | 2 | $55B |
|
||
| Retail / Pharmacy | 1 | $148B |
|
||
| Agriculture / Food | 1 | $86B |
|
||
Price history
+83.8% since first listed10 events — show timeline
- 2026-05-21 Price Changed $125,000 MARIS as Distributed by MLS Grid
- 2026-05-05 Price Changed $135,000 MARIS as Distributed by MLS Grid
- 2026-04-23 Listed $143,000 MARIS as Distributed by MLS Grid
- 2024-12-26 Relisted — MARIS as Distributed by MLS Grid
- 2024-11-22 Contingent — MARIS as Distributed by MLS Grid
- 2024-11-08 Listed $165,000 MARIS as Distributed by MLS Grid
- 2023-04-06 Sold (MLS) — MARIS as Distributed by MLS Grid
- 2023-03-20 Pending — MARIS as Distributed by MLS Grid
- 2023-02-16 Listed $129,900 MARIS as Distributed by MLS Grid
- 2005-03-22 Sold (Public Records) $68,000 Public Records
Property tax history
+5.1%/yrLatest (2024): $3,402 · +8.9% YoY. Source: county tax records.
Cash-flow waterfall
monthlySold comps — $/sqft
last 12 mo · ≤1 miLoading sold comps…