 Duplex
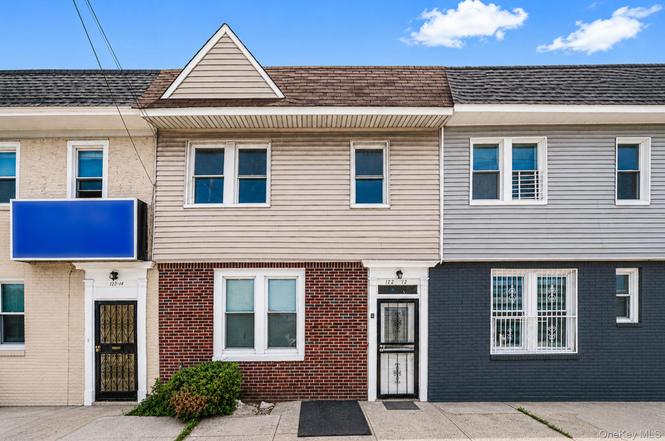
12212 Montauk St · New York, NY
Flood risk No data
- FEMA flood zone
- —
- Chance of flooding over 30 yrs
- —
- Est. flood insurance / yr
- —
Fire risk No data
- Est. fire insurance / yr
- —
Heat risk No data
- Hot days now (above threshold)
- —
- Hot days in 30 yrs
- —
Wind risk No data
- Chance of severe wind over 30 yrs
- —
Air-quality risk No data
- Unhealthy air days now
- —
- Unhealthy air days in 30 yrs
- —
Risk factors via First Street. Map © Google.
Why this score? — see what drove the D+ grade
The composite is a weighted blend of 9 inputs, each scored 0–100. Each bar is that input's sub-score; the figure is the points it added to the 100-point composite (weight × sub-score).
- ARV discount +15.0/15.0
- Cash flow +13.3/30.0
- Schools +5.0/10.0
- DSCR +4.0/10.0
- Livability +3.8/5.0
- 1% rule +2.8/10.0
- Rent growth +2.5/5.0
- Condition / age +2.5/5.0
- Appreciation +0.0/10.0
$869,999
🖨 Deal sheet 📄 Offer letter ✓ Due diligence
Multi-family units
County records classify this as Multi-Family (2-4 Unit). Listing-text estimate: 2 units. confirmed
Listing remarks
Welcome to this beautifully renovated two-family home in the heart of Springfield Gardens. This exceptional property features two spacious units, one is offering 3 bedrooms and 1 bathroom and second is offering 3 bedrooms and 1.5 baths, along with a fully finished basement —providing endless possibilities for extended living, recreation, or additional space. No detail has been overlooked in this complete renovation. The home boasts modern finishes throughout, updated kitchens and bathrooms, and a thoughtfully designed layout that combines comfort and functionality. Enjoy year-round comfort with central air conditioning and central heating, ensuring efficiency and convenience in every
Key facts
- Central heating
- Updated bathrooms
- Updated kitchens
Tags
Property features AI
Exterior
- Parking: On-street parking
- Utilities: Public sewer; Electricity available; Natural gas available; Sewer available
- Home design: Duplex
- Construction: Frame construction
- Exterior features: Frame construction; Not waterfront
Interior
- Bedrooms: Two 3-bedroom units
- Bathrooms: Three full bathrooms
- Heating & cooling: Forced air heating; Other heating; Ductless cooling
- Interior features: Finished full basement; Other interior features
Neighborhood map
What this means for you Summary
Snapshot
- This is a 2 × 3.0-bed/1.5-bath units multifamily listed at $870k.
Deal economics
- At list price, monthly cash flow is $-2 ($-25/yr) — negative. Per door: $-1/mo.
- To cash-flow at today's rent, offer at most $870k (0.0% below list).
- To meet the 1% rule (rent ≥ 1% of price), the offer needs to be $679k (22.0% below list).
- Recommended offer: $679k (22.0% below list) — sets the bar for 1% rule.
- Cap rate 6.3% vs local median 2.6% in New York — top-decile yield for the area; either an underpriced asset or a hidden risk that comps aren't pricing in. Stress-test before assuming the spread holds.
Location & tenants
- Location reads 75/100 on livability (#268 in NY, #4,188 nationally) — a middle-class / working-renter tenant base. Strengths: amenities A+, commute A+, health & safety A; Watch: crime F, cost of living F.
- Market conditions: 193 active listings in the ZIP; 5,302 units permitted in Queens County in 2024 (4,918 in 5+ unit buildings).
Forward outlook
- Local home prices are declining (-3.0%/yr); year-one equity from $6k of loan paydown is wiped out by about $26k of value loss. Plan a longer hold.
- Queens County population projected at +16% by 2050 — long-run rental-demand tailwind backs the buy-and-hold thesis.
Negotiation context
- Only 8 days on market — expect competitive offers; lowballing is unlikely to land.
- 2 sale attempts with the ask held roughly flat each time — persistent listings suggest the price (not the market) is what's stuck; bring a comps-based counter.
- Current owner paid $318k; list at $870k implies a 173% gain — meaningful room to come down on a strong offer.
Risks & watch-outs
- Watch-outs: built in 1930 — expect roof / HVAC / electrical / plumbing capex.
Questions for the listing agent
- What do current leases actually rent for vs. the listed asking? Can we see a recent rent roll and the last 12 months of T-12 income?
- Can we see the unit-by-unit rent roll, current vacancy, and any below-market leases? What's the average tenancy length?
- What capital expenditures (roof, boiler, parking lot, exteriors) have been made in the last 5 years, and what's planned in the next 2?
- Built in 1930 — when were the roof, HVAC, electrical panel, plumbing, and water heater last replaced?
- Is there a deadline driving the sale (1031 exchange, divorce, estate, relocation)? That informs how much negotiation room exists.
- Schools are B-rated — typically a magnet for longer-tenancy family renters. What's the average tenant stay here, and is there a school-zone premium baked into asking?
- Crime grade is F in this area — have there been break-ins, vandalism, or insurance claims at this property in the last 3 years? What carrier currently insures it and at what premium?
- The area grade is low — what's the realistic commute time and amenity access for the typical tenant pool here? Any planned neighborhood developments (good or bad) we should know about?
- What's the average days-on-market for RENTAL listings here right now (not sales)? A rising rental-DOM trend means longer vacancies and softer asking-rent achievability than the comps imply.
- What's the recent tenant-quality profile in this submarket — average credit score on applications, eviction rate, late-payment / NSF rate, and stable-employment percentage? A property-management company in the area should have these aggregated.
- How much new apartment / multifamily construction is in the pipeline within 1–3 miles? Heavy new supply (>2% of stock underway) typically softens rents 12–24 months out; light construction supports rent growth.
Investment metrics
- 1% rule
- 0.78% ✗
- Cap rate
- 6.29%
- Cash-on-cash
- -0.01%
- DSCR
- 1.00
- GRM
- 10.7
CMA / ARV
- ARV (on-the-fly)
- $1,093,400
- Comps found
- 10
Show comp detail 10 sales within ~0.75 mi
| Address | Dist | Beds/Ba | Sqft | Sold | Price | $/sf | Match |
|---|---|---|---|---|---|---|---|
| 13012 178th St | 0.32mi | 6/4.0 | 2,352 (+7%) | 6mo | $1,250,000 | $531 | 65 |
| 13526 219th St | 0.57mi | 6/— | 2,340 (+6%) | 2mo | $772,500 | $330 | 61 |
| 11942 189th St | 0.33mi | 6/5.0 | 2,025 (-8%) | 4mo | $1,100,000 | $543 | 60 |
| 189-12 118 Ave | 0.54mi | 6/4.0 | 2,250 (+2%) | 9mo | $1,175,000 | $522 | 60 |
| 17836 Eveleth Rd | 0.15mi | 5/3.0 (-1) | 2,500 (+14%) | 7mo | $910,000 | $364 | 60 |
| 17808 137th Ave | 0.55mi | 6/5.0 | 2,124 (-4%) | 2mo | $970,000 | $457 | 59 |
| 130-16 178th St | 0.32mi | 6/5.0 | 2,400 (+9%) | 23mo | $1,330,000 | $554 | 43 |
| 118-12 189th St | 0.51mi | 6/3.0 | 1,872 (-15%) | 12mo | $930,000 | $497 | 42 |
| 17203 119th Ave | 0.75mi | 6/4.0 | 2,500 (+14%) | 2mo | $1,150,000 | $460 | 37 |
| 17238 125th Ave | 0.57mi | 5/2.0 (-1) | 1,872 (-15%) | 8mo | $790,000 | $422 | 34 |
Match score weights: distance 35% · size 25% · config 20% · recency 20%. Top-matched comps best support the ARV.
Projected returns pro-forma
-3.0% appreciation · 3.0% rent growth · sell at horizon
- IRR
- -16.4%
- Equity multiple
- 0.42×
- Total profit
- $-141,407
- Equity at exit
- $129,720
- IRR
- -8.2%
- Equity multiple
- 0.49×
- Total profit
- $-124,509
- Equity at exit
- $75,222
Cash invested: $243,600 (down + closing). Projections, not guarantees.
Landlord ↔ Tenant lean methodology
- Overall (CITY)
- 0 Strongly Tenant-Friendly
- State New York
- 15 Strongly Tenant-Friendly · D+10
- County
- — inherits STATE
- City New York
- 0 Strongly Tenant-Friendly · D+34
ZIP-level market 11413
- Active inventory
- 193
- Price-to-rent
- 21.4×
Monthly cashflow live
- Estimated rent
- $6,787 high interval (Pro) →
- Mortgage (P&I)
- −$4,562
- Tax from tax record
- −$439 /mo · $5,267/yr
- Insurance
- −$362
- HOA
- −$0
- Vacancy / Maint / Mgmt
- −$1,425
- Net cashflow
- $-2
Break-even live
2-unit breakdown (identical units grouped — click to expand)
| Units | Beds | Baths | Est. rent |
|---|---|---|---|
| 2× units | 3.0 | 1.5 | $6,786 |
| #1 | 3.0 | 1.5 | $3,393 |
| #2 | 3.0 | 1.5 | $3,393 |
| Total (2 units) | $6,787 | ||
UW: 25.0% down · 7.5% · 30yr · 1.5% tax · 5.0% vac · 8.0% maint · 8.0% mgmt
Financing live
Cash to close
- Down payment
- $217,500
- Closing costs
- $26,100
- Reserves months
- —
- Total cash needed
- —
Loan-product check · same deal, 3 products live
Conventional
25% down · 7.5% · 30yr
- Down + closing
- —
- Monthly P&I
- —
- Monthly cashflow
- —
- DSCR
- —
- Eligible?
- —
Personal DTI + credit; lowest rate.
DSCR
20% down · 8.5% · 30yr
- Down + closing
- —
- Monthly P&I
- —
- Monthly cashflow
- —
- DSCR
- —
- Eligible?
- —
No personal income docs; deal must DSCR.
Hard money
10% down · 12.0% · 12mo
- Down + closing
- —
- Monthly P&I
- —
- Monthly cashflow
- —
- DSCR
- —
- Eligible?
- —
Short-term bridge; refi at stabilization.
Listing history 6 events
-
2026-06-18days on market $869,999 Active 8 DOM
-
2026-06-17days on market $869,999 Active 7 DOM
-
2026-06-16days on market $869,999 Active 6 DOM
-
2026-06-15days on market $869,999 Active 5 DOM
-
2026-06-13remarks 693-char remark
-
2026-06-13$869,999 Active 3 DOM
ⓘ Source: listings_history table (triggers on properties + properties_extension) + one-shot
backfill from property_details.listing_events for pre-trigger history.
Tax reassessment forecast NY · Partial reset (capped growth)
- Current annual tax
- $5,267 · $439/mo
- Projected year-2 tax
- $9,985 · $832/mo
- Expected delta
- +$4,718/yr (+$393/mo · 89.6%)
ⓘ Screening estimate from a state-policy table — verify with the county assessor before closing.
Nearby sold comps map
Loading sold comps map…
Walkable amenities ~0.75 mi
Loading nearby amenities…
Taxation est. · year 1
- Rental income
- $81,444
- − Mortgage interest
- −$48,733
- − Property taxes
- −$5,267
- − Insurance
- −$4,350
- − Repairs & maintenance
- −$6,516
- − Management
- −$6,516
- − Depreciation
- −$25,309
- Taxable loss
- −$15,247
- Est. tax savings @ 24.0%
- +$3,659
- After-tax cash flow
- $3,634/yr
For passive investors: Depreciation is non-cash, so a rental often shows a tax loss while cash-flowing — sheltering income. Rental losses are passive: they offset passive income freely, and up to $25,000/yr can offset ordinary (W-2) income if you actively participate and your MAGI is under $100k (phasing out to $0 by $150k); unused losses carry forward. On sale, claimed depreciation is recaptured at up to 25%, and gains may owe capital-gains tax (a 1031 exchange can defer both). Figures are a year-1 estimate at your 24.0% rate — not tax advice; consult a CPA.
Schools (NCES district)
No district data.
Livability — New York
- Score
- 75/100
- State rank
- #268
- US rank
- #4188
Category grades
Schools grade is shown separately in the Schools card above.
Census & demographics
- Census place
- New York, NY
- City population
- 7,731,280
- Population (ZIP)
- 45,072
Population outlook (Queens County) Hauer SSP2
- Today (2025)
- 2,546,320 people
- By 2030
- 2,643,059 · +3.8%
- By 2040
- 2,815,563 · +10.6%
- By 2050
- 2,944,423 · +15.6%
- By 2075
- 3,123,338 · +22.7%
- By 2100
- 3,098,688 · +21.7%
Race, ethnicity, and origin ACS 2023
- Neighborhood character
- Predominantly Black (84%)
- Race & ethnicity
- Black 84% Hispanic / Latino 9% Two or more races 4% Asian 2% White 1%
- Hispanic origin (detail)
- Puerto Rican 3% Dominican 3%
- Common ancestry
- Hispanic 6%
- Foreign-born
- 39% · Canada, Mexico
- Languages at home
- 84% English-only · French/Haitian/Cajun 7% Spanish 6% Other Indo-European 1%
Political lean MEDSL · Queens
- 2024 margin
- Strong D (+24.6) · D 62.3% · R 37.7%
- 2008→2024 swing
- -26.2pp toward R · 2008: 50.8pp · 2024: 24.6pp
- All cycles
- 2024: D+24.6 2020: D+45.2 2016: D+53.4 2012: D+58.5 2008: D+50.8
Not yet ingested
- Civics
- —
Market trends
- HPI YoY
- ▼ -390.89%
- Current HPI
- 311.5327
- Rent YoY
- —
- Metro
- —
- State GDP YoY
- ▲ 2.60%
- F500 in state
- 92
Industry mix (Fortune 500 HQ in NY)
| Industry | F500 HQs | Revenue |
|---|---|---|
| Financial Services | 10 | $950B |
|
||
| Consumer Goods | 9 | $162B |
|
||
| Insurance | 4 | $225B |
|
||
| Telecommunications | 2 | $144B |
|
||
| Pharmaceuticals | 2 | $112B |
|
||
| Media / Entertainment | 2 | $69B |
|
||
Price history
+1238.5% since first listed5 events — show timeline
- 2026-06-10 Listed $869,999 OneKey® MLS as Distributed by MLS Grid
- 2026-03-16 Listing Removed — OneKey® MLS as Distributed by MLS Grid
- 2026-02-09 Listed $649,999 OneKey® MLS as Distributed by MLS Grid
- 2025-08-13 Sold (Public Records) $318,250 Public Records
- 1998-04-20 Sold (Public Records) $65,000 Public Records
Property tax history
+5.4%/yrLatest (2025): $5,267 · +3.4% YoY. Source: county tax records.
Cash-flow waterfall
monthlySold comps — $/sqft
last 12 mo · ≤1 miLoading sold comps…