 🏗️ New Construction
25738 Sapphire Cove St · Houston, TX
Flood risk 1/10 · Minimal
- FEMA flood zone
- X (unshaded)
- Chance of flooding over 30 yrs
- 0.0%
- Est. flood insurance / yr
- $507 – $1,088
Fire risk 4/10 · Minor
- Est. fire insurance / yr
- $1,222 – $2,270
Heat risk 9/10 · Severe
- Hot days now (above 110°F)
- 7 days/yr
- Hot days in 30 yrs
- 22 days/yr
Wind risk 9/10 · Severe
- Chance of severe wind over 30 yrs
- 99.0%
Air-quality risk 2/10 · Minimal
- Unhealthy air days now
- 1 days/yr
- Unhealthy air days in 30 yrs
- 1 days/yr
Risk factors via First Street. Map © Google.
Why this score? — see what drove the D grade
The composite is a weighted blend of 9 inputs, each scored 0–100. Each bar is that input's sub-score; the figure is the points it added to the 100-point composite (weight × sub-score).
- Cash flow +10.4/30.0
- ARV discount +7.5/15.0
- Schools +5.7/10.0
- Condition / age +5.0/5.0
- 1% rule +3.7/10.0
- Livability +3.7/5.0
- DSCR +3.0/10.0
- Rent growth +2.3/5.0
- Appreciation +0.0/10.0
$346,990
🖨 Deal sheet (PDF) 📄 Offer letter ✓ Due diligence
Listing remarks
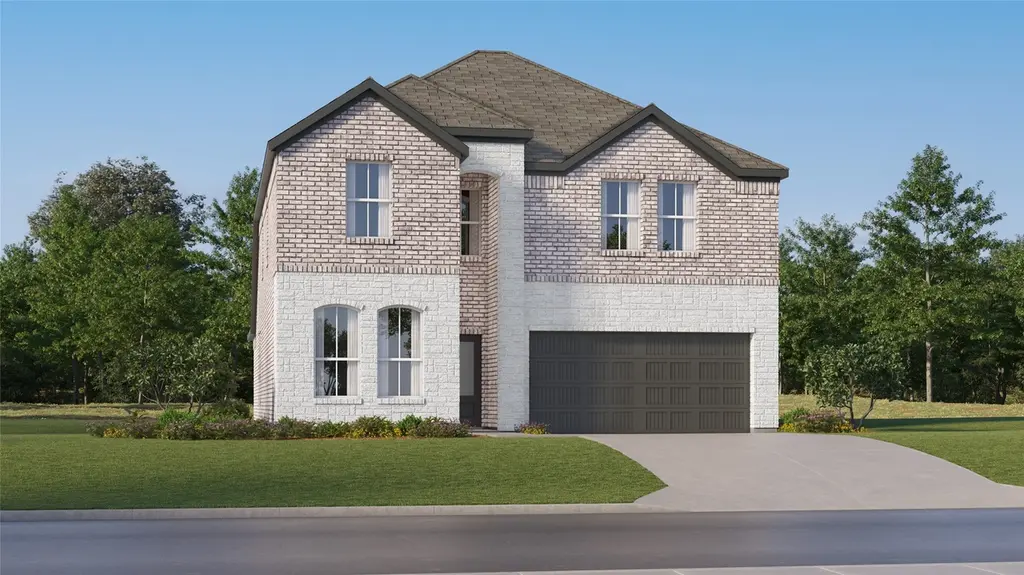
New Construction Lennar Houston Home - The Napali Floor Plan - This new two-story home features a single-level owner’s suite, offering a serene retreat with a full bathroom and walk-in closet. A secondary bedroom is located near the front of the home, while an open-concept floorplan encourages seamless indoor-outdoor living with access to an inviting covered porch. On the second level, a bonus room provides a versatile shared living area easily accessible from three additional secondary bedrooms. The completion date, prices and features may vary and are subject to change. Please verify with Lennar directly. Photos are for illustrative purposes only.
Key facts
- Covered porch
- Full bathroom
- Walk-in closet
Tags
Property features AI
Finance
- Financial info: Association fee paid annually
- HOA & community: Alamo Management Group HOA; Community picnic area, playground, and park; Annual association fee
Exterior
- Parking: Attached garage with 2 spaces
- Utilities: Public water; Public sewer
- Home design: Residential property; Under construction (new construction); Slab foundation
- Construction: Built in 2026; Brick construction; Composition roof
- Exterior features: Fenced backyard; Subdivision lot
Interior
- Kitchen: Dishwasher; Electric oven; Electric range; Gas oven; Gas range
- Bedrooms: Primary bedroom on first floor; Additional bedroom on first floor; Four bedrooms on second floor
- Flooring: Carpet; Vinyl
- Bathrooms: 3 full bathrooms
- Heating & cooling: Central heating (electric and gas); Central air conditioning (electric and gas)
- Interior features: Breakfast bar; Kitchen/family room combo; Kitchen/dining combo; Separate shower; Tub with shower
- Laundry & utility: Washer hookup; Electric dryer hookup; Gas dryer hookup
Neighborhood map
What this means for you Summary
Snapshot
- This is a 5-bed/3.0-bath single-family listed at $347k. Condition is rated excellent.
Deal economics
- At list price, monthly cash flow is $-187 ($-2k/yr) — negative.
- To cash-flow at today's rent, offer at most $323k (6.8% below list).
- To meet the 1% rule (rent ≥ 1% of price), the offer needs to be $304k (12.4% below list).
- Recommended offer: $304k (12.4% below list) — sets the bar for 1% rule.
- Cap rate 5.7% vs local median 3.2% in Houston — top-decile yield for the area; either an underpriced asset or a hidden risk that comps aren't pricing in. Stress-test before assuming the spread holds.
Location & tenants
- Location reads 74/100 on livability (#184 in TX, #4,771 nationally) — a middle-class / working-renter tenant base. Strengths: amenities A+, cost of living A+, housing A+; Watch: crime F.
- Katy ISD (suburban): math 61% / reading 63% proficiency, ranked #29 of 826 in TX (top 4%) — acceptable for families but not a draw, mixed tenant base, ~2y average lease.
- Zoned schools: Robert King El (math 41% / reading 44%, grade F, #1,313 of 4,322 statewide, top 31%, 981 students, 68% FRL); Katy J H (math 52% / reading 51%, grade C, #318 of 1,662 statewide, top 20%, 1,094 students, 53% FRL); Katy H S (math 62% / reading 74%, grade B, #150 of 1,632 statewide, top 10%, 3,330 students, 38% FRL) — zoned schools average 53% FRL vs 27% district-wide (25 pts higher); higher-poverty schools than district average — tighter screening recommended.
- Market conditions: Rents soft (-0.8%/yr); 2729 active listings in the ZIP; 2 comparable units currently listed for rent nearby; high-income renter base; 29,883 units permitted in Harris County in 2024 (8,621 in 5+ unit buildings).
- This rent runs 31% of the median local income ($118k/yr) — at the standard rent-burdened threshold; future hikes will face affordability resistance.
Forward outlook
- Local home prices are declining (-3.0%/yr); year-one equity from $2k of loan paydown is wiped out by about $11k of value loss. Plan a longer hold.
- Harris County population projected at +47% by 2050 — long-run rental-demand tailwind backs the buy-and-hold thesis.
Negotiation context
- It's been on market 38 days — a 3% lower offer ($337k) is reasonable based on typical stale-listing flexibility.
- 2 sale attempts with the ask held roughly flat each time — persistent listings suggest the price (not the market) is what's stuck; bring a comps-based counter.
Risks & watch-outs
- Climate carrying-cost: severe wind risk, 99% chance of damaging wind over 30y; extreme-heat days projected 7→22/yr by 2055 (HVAC capex compounding) — expect insurance premiums to compound above CPI over the hold.
Questions for the listing agent
- What do current leases actually rent for vs. the listed asking? Can we see a recent rent roll and the last 12 months of T-12 income?
- It's been on market 38 days. Have you received any prior offers? Is the seller open to a 12% concession, seller financing, or rate buy-down credit?
- What does the HOA fee cover, when was the last increase, and are there any pending special assessments or reserve-fund shortfalls?
- Is there a deadline driving the sale (1031 exchange, divorce, estate, relocation)? That informs how much negotiation room exists.
- Schools are D-rated, which usually means shorter tenancies and higher turnover. Who's the typical renter profile here, and what's been the actual vacancy rate?
- Crime grade is F in this area — have there been break-ins, vandalism, or insurance claims at this property in the last 3 years? What carrier currently insures it and at what premium?
- The area grade is low — what's the realistic commute time and amenity access for the typical tenant pool here? Any planned neighborhood developments (good or bad) we should know about?
- What's the average days-on-market for RENTAL listings here right now (not sales)? A rising rental-DOM trend means longer vacancies and softer asking-rent achievability than the comps imply.
- What's the recent tenant-quality profile in this submarket — average credit score on applications, eviction rate, late-payment / NSF rate, and stable-employment percentage? A property-management company in the area should have these aggregated.
- How much new for-sale + rental construction is in the pipeline within 1–3 miles? Heavy new supply typically softens prices + rents 12–24 months out; constrained supply supports both.
Investment metrics
- 1% rule
- 0.87% ✗
- Cap rate
- 5.65%
- Cash-on-cash
- -2.29%
- DSCR
- 0.90
- GRM
- 9.6
CMA / ARV
- ARV (median comp)
- $350,380
- List price
- $346,990
- Delta
- -0.97%
- Verdict
- FAIR
- Comps
- 20 within 1.0 mi
Show comp detail 7 sales within ~0.75 mi
| Address | Dist | Beds/Ba | Sqft | Sold | Price | $/sf | Match |
|---|---|---|---|---|---|---|---|
| 25830 Deep Blue Dr | 0.15mi | 4/3.0 (-1) | 2,794 (+6%) | 2mo | $442,990 | $159 | 77 |
| 25818 Deep Blue Dr | 0.18mi | 4/3.0 (-1) | 2,794 (+6%) | 1mo | $430,990 | $154 | 77 |
| 8203 Tidal View Dr | 0.21mi | 4/3.5 (-1) | 2,731 (+3%) | 4mo | $427,990 | $157 | 75 |
| 25731 Sapphire Cove St | 0.21mi | 4/3.0 (-1) | 2,410 (-9%) | 4mo | $369,990 | $154 | 67 |
| 25810 Deep Blue Dr | 0.20mi | 4/3.5 (-1) | 2,902 (+10%) | 1mo | $444,990 | $153 | 67 |
| 8215 Tidal View Dr | 0.21mi | 4/3.5 (-1) | 2,902 (+10%) | 2mo | $461,990 | $159 | 66 |
| 8207 Tidal View Dr | 0.21mi | 4/3.0 (-1) | 2,370 (-10%) | 4mo | $399,990 | $169 | 65 |
Match score weights: distance 35% · size 25% · config 20% · recency 20%. Top-matched comps best support the ARV.
Projected returns pro-forma
-3.0% appreciation · 0.0% rent growth · sell at horizon
- IRR
- -23.7%
- Equity multiple
- 0.21×
- Total profit
- $-77,435
- Equity at exit
- $52,243
- IRR
- -31.1%
- Equity multiple
- -0.19×
- Total profit
- $-116,576
- Equity at exit
- $30,294
Cash invested: $98,106 (down + closing). Projections, not guarantees.
Landlord ↔ Tenant lean methodology
- Overall (STATE)
- 87 Strongly Landlord-Friendly
- State Texas
- 87 Strongly Landlord-Friendly · R+5
- County
- — inherits STATE
- City
- — inherits STATE
ZIP-level market 77493
- Rents YoY
- -0.8%
- Active inventory
- 2729
- Price-to-rent
- 9.5×
Monthly cashflow live
- Estimated rent
- $3,040 medium interval (Pro) →
- Mortgage (P&I)
- −$1,837
- Tax est. 1.5%
- −$438 /mo · $5,256/yr
- Insurance
- −$146
- HOA
- −$167
- Vacancy / Maint / Mgmt
- −$638
- Net cashflow
- $-187
Break-even live
Sensitivity live
| Price | -10% $55 | -5% $-66 | +0% $-187 | +5% $-308 | +10% $-429 |
|---|---|---|---|---|---|
| Rent | -10% $-427 | -5% $-307 | +0% $-187 | +5% $-67 | +10% $53 |
| Rate | -1.0pp $-10 | -0.5pp $-98 | base $-187 | +0.5pp $-278 | +1.0pp $-370 |
UW: 25.0% down · 7.5% · 30yr · 1.5% tax · 5.0% vac · 8.0% maint · 8.0% mgmt
Financing live
Cash to close
- Down payment
- $87,595
- Closing costs
- $10,511
- Reserves months
- —
- Total cash needed
- —
Loan-product check · same deal, 3 products live
Conventional
25% down · 7.5% · 30yr
- Down + closing
- —
- Monthly P&I
- —
- Monthly cashflow
- —
- DSCR
- —
- Eligible?
- —
Personal DTI + credit; lowest rate.
DSCR
20% down · 8.5% · 30yr
- Down + closing
- —
- Monthly P&I
- —
- Monthly cashflow
- —
- DSCR
- —
- Eligible?
- —
No personal income docs; deal must DSCR.
Hard money
10% down · 12.0% · 12mo
- Down + closing
- —
- Monthly P&I
- —
- Monthly cashflow
- —
- DSCR
- —
- Eligible?
- —
Short-term bridge; refi at stabilization.
Rent comps 2 comps
| Address | Beds | Baths | Sqft | Rent | $/sqft | DOM | Units | Dist |
|---|---|---|---|---|---|---|---|---|
| 7410 Hillside Arbor Dr Katy, TX | 4.0 | 2.0 | 2289 | $2,400 | $1.05 | 45d | 1 | 0.93mi |
| 7402 Clover Chase Dr Katy, TX | 4.0 | 3.0 | 1840 | $2,400 | $1.30 | 45d | 1 | 1.19mi |
HOA detail
- Monthly dues
- $167 · $2,004/yr
Listing history 19 events
-
2026-06-21days on market $346,990 Active 38 DOM
-
2026-06-18days on market $346,990 Active 35 DOM
-
2026-06-17days on market $346,990 Active 34 DOM
-
2026-06-16days on market $346,990 Active 33 DOM
-
2026-06-15remarks 657-char remark
-
2026-06-15price $346,990 Active 32 DOM
-
2026-06-15days on market $332,890 Active 32 DOM
-
2026-06-13days on market $332,890 Active 30 DOM
-
2026-06-09days on market $332,890 Active 26 DOM
-
2026-06-08days on market $332,890 Active 25 DOM
-
2026-06-07days on market $332,890 Active 24 DOM
-
2026-06-04days on market $332,890 Active 21 DOM
-
2026-06-03days on market $332,890 Active 20 DOM
-
2026-06-02days on market $332,890 Active 19 DOM
-
2026-06-01days on market $332,890 Active 18 DOM
-
2026-05-31days on market $332,890 Active 17 DOM
-
2026-05-14historical
-
2026-05-14$345,390 Active 624-char remark
-
2026-04-23$350,590 Active
ⓘ Source: listings_history table (triggers on properties + properties_extension) + one-shot
backfill from property_details.listing_events for pre-trigger history.
Climate risk First Street
- Flood 1/10 Low FEMA zone X (unshaded) · 0% chance over 30 yrs
- Wildfire 4/10 Moderate
- Heat 9/10 Extreme 7 d/yr ≥110°F today · 22 d/yr by 30 yrs out
- Wind 9/10 Extreme 99% chance of damaging wind over 30 yrs
- Air quality 2/10 Low 1 unhealthy d/yr today · 1 by 30 yrs out
Nearby sold comps map
Loading sold comps map…
Walkable amenities ~0.75 mi
Loading nearby amenities…
Taxation est. · year 1
- Rental income
- $36,480
- − Mortgage interest
- −$19,627
- − Property taxes
- −$5,256
- − Insurance
- −$1,752
- − Repairs & maintenance
- −$2,918
- − Management
- −$2,918
- − HOA
- −$2,004
- − Depreciation
- −$10,193
- Taxable loss
- −$8,188
- Est. tax savings @ 24.0%
- +$1,965
- After-tax cash flow
- $-277/yr
For passive investors: Depreciation is non-cash, so a rental often shows a tax loss while cash-flowing — sheltering income. Rental losses are passive: they offset passive income freely, and up to $25,000/yr can offset ordinary (W-2) income if you actively participate and your MAGI is under $100k (phasing out to $0 by $150k); unused losses carry forward. On sale, claimed depreciation is recaptured at up to 25%, and gains may owe capital-gains tax (a 1031 exchange can defer both). Figures are a year-1 estimate at your 24.0% rate — not tax advice; consult a CPA.
Condition & rehab AI · 3 photos
This new two-story home is in excellent condition with no visible repairs or maintenance needed. It offers a serene retreat, open-concept floorplan, and modern amenities, making it an attractive investment for both resale and rental markets.
Value-add opportunities
- Both Painting — Fresh paint can enhance curb appeal and interior aesthetics
- Both Landscaping — Enhances curb appeal and can increase property value
- Both Lighting — Modern lighting can improve the home's ambiance and safety
- Both Smart home integration — Modernizes the home and adds convenience
Renovation cost estimate screening
Value-add ROI direction
- Both Painting — Fresh paint can enhance curb appeal and interior aesthetics ↑
- Both Landscaping — Enhances curb appeal and can increase property value ↑
- Both Lighting — Modern lighting can improve the home's ambiance and safety ↑
- Both Smart home integration — Modernizes the home and adds convenience ↑
ⓘ Cost ranges are severity-bucket heuristics (US national rule-of-thumb). Get contractor quotes + a written scope before underwriting a rehab budget.
Schools (NCES district)
- District
- Katy ISD
- NCES district ID
- 4825170
- Math proficiency
- 61% ▼ -7.00%
- Reading proficiency
- 63% ▼ -3.00%
- Median HH income
- $90,312
- Composite
- 56.59/100
- National rank
- #1146
- State rank
- #29 of 826 in TX
Livability — Houston
- Score
- 74/100
- State rank
- #184
- US rank
- #4771
Category grades
Schools grade is shown separately in the Schools card above.
Census & demographics
- County
- Harris County · 4,702,590 people
- City population
- 3,226,434
- Metro
- Houston-The Woodlands-Sugar Land, TX
- Population (ZIP)
- 71,484
- Household income
- $118,464
- Rent vs Own
- Severe rent burden
- 913.0
Population outlook (Harris County) Hauer SSP2
- Today (2025)
- 5,571,493 people
- By 2030
- 6,089,821 · +9.3%
- By 2040
- 7,142,806 · +28.2%
- By 2050
- 8,185,864 · +46.9%
- By 2075
- 10,574,329 · +89.8%
- By 2100
- 12,109,958 · +117.4%
Race, ethnicity, and origin ACS 2023
- Neighborhood character
- Highly diverse neighborhood (Simpson 0.73)
- Race & ethnicity
- White 36% Hispanic / Latino 33% Two or more races 16% Black 15% Asian 12%
- Hispanic origin (detail)
- Mexican 20%
- Common ancestry
- Lithuanian 2% Slovak 1% Italian 1%
- Foreign-born
- 21% · Canada, Vietnam, Jamaica
- Languages at home
- 64% English-only · Spanish 22% Vietnamese 5% French/Haitian/Cajun 4%
Political lean MEDSL · Harris
- 2024 margin
- Lean D (+5.5) · D 52.0% · R 46.4% · Other 1.6%
- 2008→2024 swing
- +3.9pp toward D · 2008: 1.6pp · 2024: 5.5pp
- All cycles
- 2024: D+5.5 2020: D+13.3 2016: D+12.4 2012: D+0.1 2008: D+1.6
Not yet ingested
- Civics
- —
Market trends
- HPI YoY
- ▼ -140.65%
- Current HPI
- 233.1683
- Rent YoY
- ▼ -0.80%
- Metro
- Houston-The Woodlands-Sugar Land, TX
- State GDP YoY
- ▲ 3.95%
- F500 in state
- 110
Industry mix (Fortune 500 HQ in TX)
| Industry | F500 HQs | Revenue |
|---|---|---|
| Energy | 16 | $1,198B |
|
||
| Technology | 5 | $198B |
|
||
| Engineering / Construction | 4 | $72B |
|
||
| Energy Services | 3 | $60B |
|
||
| Utilities | 3 | $41B |
|
||
| Healthcare | 2 | $330B |
|
||
Price history
-1.0% since first listed7 events — show timeline
- 2026-06-15 Price Changed $346,990 HARMLS
- 2026-05-28 Price Changed $332,890 HARMLS
- 2026-05-26 Price Changed $338,290 HARMLS
- 2026-05-19 Price Changed $343,540 HARMLS
- 2026-05-14 Listing Removed — HARMLS
- 2026-05-14 Listed $345,390 HARMLS
- 2026-04-23 Listed $350,590 HARMLS
Cash-flow waterfall
monthlySold comps — $/sqft
last 12 mo · ≤1 miLoading sold comps…