 Multi-family
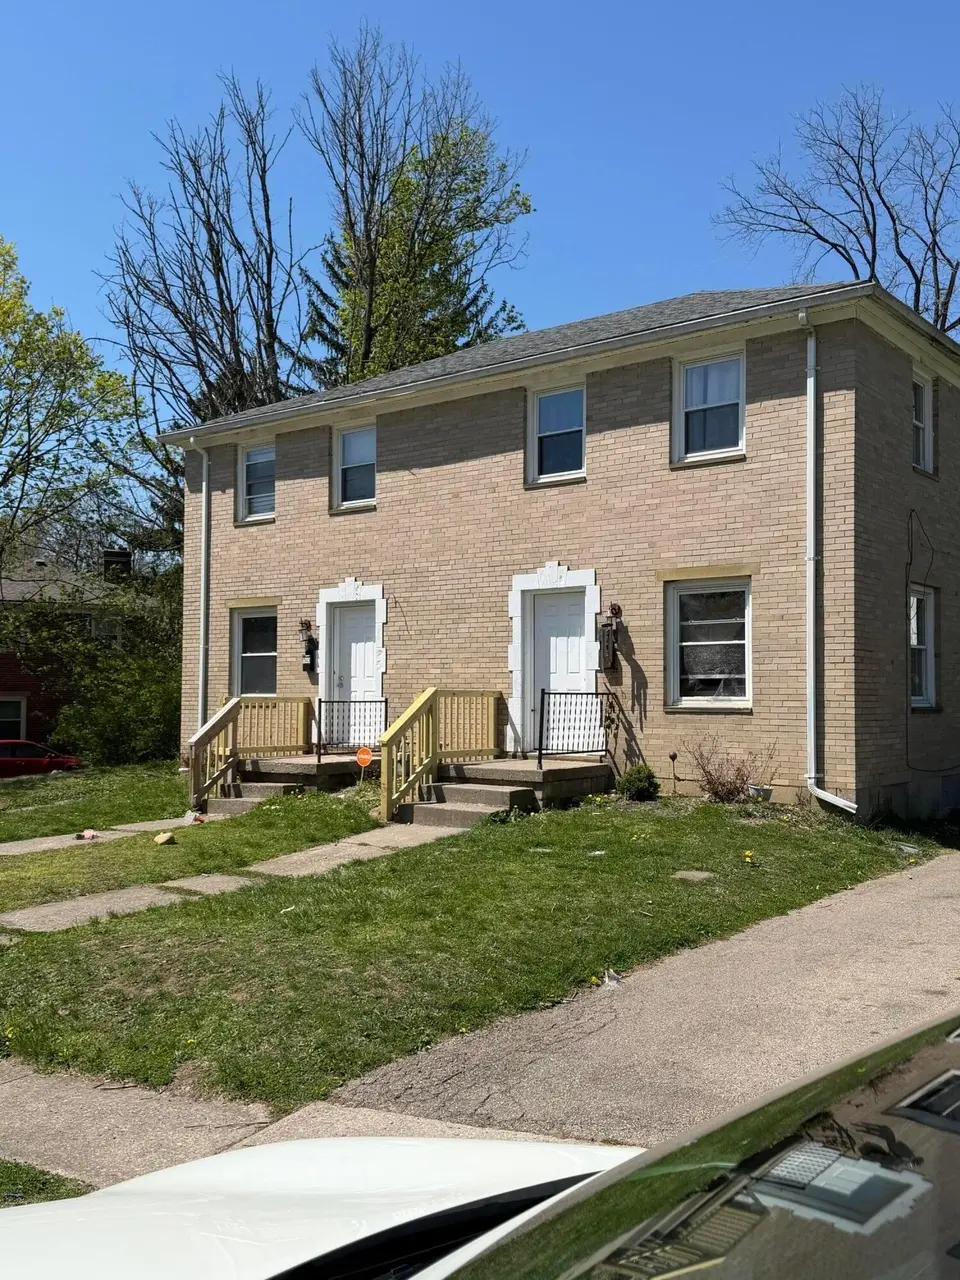
1143 Cedarview Dr · Springfield, OH
Flood risk 1/10 · Minimal
- FEMA flood zone
- X (unshaded)
- Chance of flooding over 30 yrs
- 0.0%
- Est. flood insurance / yr
- $473 – $860
Fire risk 1/10 · Minimal
- Est. fire insurance / yr
- $713 – $1,323
Heat risk 3/10 · Minor
- Hot days now (above 100°F)
- 7 days/yr
- Hot days in 30 yrs
- 18 days/yr
Wind risk 2/10 · Minimal
- Chance of severe wind over 30 yrs
- —
Air-quality risk 3/10 · Minor
- Unhealthy air days now
- 2 days/yr
- Unhealthy air days in 30 yrs
- 3 days/yr
Risk factors via First Street. Map © Google.
Why this score? — see what drove the C+ grade
The composite is a weighted blend of 9 inputs, each scored 0–100. Each bar is that input's sub-score; the figure is the points it added to the 100-point composite (weight × sub-score).
- Cash flow +27.4/30.0
- DSCR +9.6/10.0
- 1% rule +7.1/10.0
- ARV discount +6.7/15.0
- Livability +2.8/5.0
- Rent growth +2.5/5.0
- Condition / age +2.5/5.0
- Schools +1.9/10.0
- Appreciation +0.0/10.0
$166,000
🖨 Deal sheet 📄 Offer letter ✓ Due diligence
Multi-family units
County records classify this as Multi-Family (2-4 Unit). Listing-text estimate: 1 unit. estimate disagrees with records
Listing remarks MLS
Established investment property- Brick double with 2 bedrooms, 1 bath upstairs, living room, dining room and kitchen. Full unfinished basement w/laundry hookup. Same floor plan for each unit. Bathroom updates less than 2 years old, new outside railings, new flooring both units 2024 and 2025. Tenants pay gas, electric, cable, internet. Owner/seller pays water/sewer and trash. Current rent is $850 each side.
Key facts
- 7,405 sq ft lot
- Built 1938
- Listed 71 days
Neighborhood map
What this means for you Summary
Snapshot
- This is a 4-bed/2.0-bath multifamily listed at $166k.
Deal economics
- At list price, monthly cash flow is $486 ($6k/yr) — positive.
- The deal already cash-flows at list — no discount required.
- Meets the 1% rule at list price ($2k rent vs $166k).
- Recommended offer: $156k (6.0% below list) — sets the bar for market timing.
- Cap rate 9.8% vs local median 4.8% in Springfield — top-decile yield for the area; either an underpriced asset or a hidden risk that comps aren't pricing in. Stress-test before assuming the spread holds.
Location & tenants
- Location reads 56/100 on livability (#1,108 in OH) — a working-class tenant base; expect higher turnover. Strengths: cost of living A+, housing A+; Watch: crime F, amenities F, commute F.
- Springfield City School District (urban): math 20% / reading 27% proficiency, ranked #616 of 656 in OH (top 94%) — low school quality limits family demand, transient renter base, plan for 1-2y turnover; 75% free/reduced lunch — lower-income household profile, screen leases tightly.
- Market conditions: 142 active listings in the ZIP; 1 comparable units currently listed for rent nearby; 232 units permitted in Clark County in 2024 (116 in 5+ unit buildings).
- This rent runs 44% of the median local income ($55k/yr) — at the standard rent-burdened threshold; future hikes will face affordability resistance.
Forward outlook
- Local home prices are declining (-3.0%/yr); year-one equity from $1k of loan paydown is wiped out by about $5k of value loss. Plan a longer hold.
- Clark County population projected at -16% by 2050 — secular population decline; favor cash flow + early exit over multi-decade hold.
- At projected returns (-3.0% appreciation + 3.0% rent growth), your $46k cash investment doubles in ~10 years — after that, you're playing with house money.
Negotiation context
- It's been on market 72 days — a 6% lower offer ($156k) is reasonable based on typical stale-listing flexibility.
- 3 sale attempts with the ask held roughly flat each time — persistent listings suggest the price (not the market) is what's stuck; bring a comps-based counter.
Risks & watch-outs
- Watch-outs: built in 1938 — expect roof / HVAC / electrical / plumbing capex.
Questions for the listing agent
- It's been on market 72 days. Have you received any prior offers? Is the seller open to a 6% concession, seller financing, or rate buy-down credit?
- Built in 1938 — when were the roof, HVAC, electrical panel, plumbing, and water heater last replaced?
- Why hasn't it sold? Are there any deal-killer items the seller is aware of (foundation, flood, title, zoning, code violations)?
- Is there a deadline driving the sale (1031 exchange, divorce, estate, relocation)? That informs how much negotiation room exists.
- Crime grade is F in this area — have there been break-ins, vandalism, or insurance claims at this property in the last 3 years? What carrier currently insures it and at what premium?
- What's the average days-on-market for RENTAL listings here right now (not sales)? A rising rental-DOM trend means longer vacancies and softer asking-rent achievability than the comps imply.
- What's the recent tenant-quality profile in this submarket — average credit score on applications, eviction rate, late-payment / NSF rate, and stable-employment percentage? A property-management company in the area should have these aggregated.
- How much new apartment / multifamily construction is in the pipeline within 1–3 miles? Heavy new supply (>2% of stock underway) typically softens rents 12–24 months out; light construction supports rent growth.
Investment metrics
- 1% rule
- 1.21% ✓
- Cap rate
- 9.81%
- Cash-on-cash
- 12.55%
- DSCR
- 1.56
- GRM
- 6.9
CMA / ARV
- ARV (median comp)
- $163,101
- List price
- $166,000
- Delta
- 1.78%
- Verdict
- FAIR
- Comps
- 20 within 1.0 mi
Show comp detail 10 sales within ~0.75 mi
| Address | Dist | Beds/Ba | Sqft | Sold | Price | $/sf | Match |
|---|---|---|---|---|---|---|---|
| 913-915 Mitchell Blvd | 0.06mi | 4/2.0 | 1,728 (0%) | 0mo | $172,000 | $100 | 97 |
| 876 E Mccreight Ave | 0.05mi | 4/2.0 | 1,728 (0%) | 2mo | $130,000 | $75 | 96 |
| 1309-1311 W Cedarview Dr | 0.17mi | 4/2.0 | 1,728 (0%) | 14mo | $166,000 | $96 | 80 |
| 1330-1332 E Cedarview Dr | 0.19mi | 4/2.0 | 1,728 (0%) | 21mo | $152,000 | $88 | 74 |
| 1340-1342 E Cedarview Dr | 0.20mi | 4/2.0 | 1,728 (0%) | 21mo | $162,000 | $94 | 73 |
| 1223 Cedarview Dr | 0.08mi | 4/— | 1,944 (+12%) | 23mo | $156,000 | $80 | 56 |
| 1663-1665 Brentwood Dr | 0.70mi | 4/2.0 | 1,520 (-12%) | 0mo | $155,000 | $102 | 47 |
| 1681 Brentwood Dr | 0.72mi | 4/2.0 | 1,552 (-10%) | 6mo | $165,000 | $106 | 45 |
| 472 Stanton Ave | 0.50mi | 4/2.0 | 1,471 (-15%) | 15mo | $107,100 | $73 | 39 |
| 1674 Brentwood Dr | 0.69mi | 4/2.0 | 1,552 (-10%) | 22mo | $155,000 | $100 | 33 |
Match score weights: distance 35% · size 25% · config 20% · recency 20%. Top-matched comps best support the ARV.
Projected returns pro-forma
-3.0% appreciation · 3.0% rent growth · sell at horizon
- IRR
- 2.3%
- Equity multiple
- 1.09×
- Total profit
- $4,058
- Equity at exit
- $24,751
- IRR
- 11.9%
- Equity multiple
- 1.93×
- Total profit
- $43,409
- Equity at exit
- $14,353
Cash invested: $46,480 (down + closing). Projections, not guarantees.
Landlord ↔ Tenant lean methodology
- Overall (STATE)
- 73 Landlord-Friendly
- State Ohio
- 73 Landlord-Friendly · R+6
- County
- — inherits STATE
- City
- — inherits STATE
ZIP-level market 45503
- Active inventory
- 142
- Price-to-rent
- 13.7×
Monthly cashflow live
- Estimated rent
- $2,015 medium interval (Pro) →
- Mortgage (P&I)
- −$871
- Tax from tax record
- −$166 /mo · $1,994/yr
- Insurance
- −$69
- HOA
- −$0
- Vacancy / Maint / Mgmt
- −$423
- Net cashflow
- $486
Break-even live
2-unit breakdown (identical units grouped — click to expand)
| Units | Beds | Baths | Est. rent |
|---|---|---|---|
| 2× units | 2 | 1 | $2,014 |
| #1 | 2 | 1 | $1,007 |
| #2 | 2 | 1 | $1,007 |
| Total (2 units) | $2,015 | ||
UW: 25.0% down · 7.5% · 30yr · 1.5% tax · 5.0% vac · 8.0% maint · 8.0% mgmt
Financing live
Cash to close
- Down payment
- $41,500
- Closing costs
- $4,980
- Reserves months
- —
- Total cash needed
- —
Loan-product check · same deal, 3 products live
Conventional
25% down · 7.5% · 30yr
- Down + closing
- —
- Monthly P&I
- —
- Monthly cashflow
- —
- DSCR
- —
- Eligible?
- —
Personal DTI + credit; lowest rate.
DSCR
20% down · 8.5% · 30yr
- Down + closing
- —
- Monthly P&I
- —
- Monthly cashflow
- —
- DSCR
- —
- Eligible?
- —
No personal income docs; deal must DSCR.
Hard money
10% down · 12.0% · 12mo
- Down + closing
- —
- Monthly P&I
- —
- Monthly cashflow
- —
- DSCR
- —
- Eligible?
- —
Short-term bridge; refi at stabilization.
Rent comps 1 comps
| Address | Beds | Baths | Sqft | Rent | $/sqft | DOM | Units | Dist |
|---|---|---|---|---|---|---|---|---|
| 401 Section St Springfield, OH | 4.0 | 2.0 | 1612 | $1,850 | $1.15 | 11d | 1 | 1.05mi |
Listing history 27 events
-
2026-06-19days on market $166,000 Active 72 DOM
-
2026-06-18days on market $166,000 Active 71 DOM
-
2026-06-17days on market $166,000 Active 70 DOM
-
2026-06-16days on market $166,000 Active 69 DOM
-
2026-06-15days on market $166,000 Active 68 DOM
-
2026-06-14days on market $166,000 Active 66 DOM
-
2026-06-12days on market $166,000 Active 65 DOM
-
2026-06-09days on market $166,000 Active 62 DOM
-
2026-06-08days on market $166,000 Active 61 DOM
-
2026-06-07days on market $166,000 Active 60 DOM
-
2026-06-05days on market $166,000 Active 57 DOM
-
2026-06-02days on market $166,000 Active 55 DOM
-
2026-06-01days on market $166,000 Active 54 DOM
-
2026-05-31days on market $166,000 Active 53 DOM
-
2026-05-30days on market $166,000 Active 52 DOM
-
2026-05-16status Active 412-char remark
Show marketing remark (412 chars)
Established investment property- Brick double with 2 bedrooms, 1 bath upstairs, living room, dining room and kitchen. Full unfinished basement w/laundry hookup. Same floor plan for each unit. Bathroom updates less than 2 years old, new outside railings, new flooring both units 2024 and 2025. Tenants pay gas, electric, cable, internet. Owner/seller pays water/sewer and trash. Current rent is $850 each side.
-
2026-05-15historical Contingency - Finance and Inspections 412-char remark
Show marketing remark (412 chars)
Established investment property- Brick double with 2 bedrooms, 1 bath upstairs, living room, dining room and kitchen. Full unfinished basement w/laundry hookup. Same floor plan for each unit. Bathroom updates less than 2 years old, new outside railings, new flooring both units 2024 and 2025. Tenants pay gas, electric, cable, internet. Owner/seller pays water/sewer and trash. Current rent is $850 each side.
-
2026-05-08price $167,000 412-char remark
Show marketing remark (412 chars)
Established investment property- Brick double with 2 bedrooms, 1 bath upstairs, living room, dining room and kitchen. Full unfinished basement w/laundry hookup. Same floor plan for each unit. Bathroom updates less than 2 years old, new outside railings, new flooring both units 2024 and 2025. Tenants pay gas, electric, cable, internet. Owner/seller pays water/sewer and trash. Current rent is $850 each side.
-
2026-04-08$168,000 Active 410-char remark
Show marketing remark (410 chars)
Established investment property- Brick double with 2 bedrooms, 1 bath upstairs, living room, dining room and kitchen. Full unfinished basement w/ laundry hookup. Same floor plan for each unit. Bathroom updates less than 2 years old, new outside railings, new flooring both units 2024 and 2025. Tenants pay gas, electric, cable, internet. Owner/seller pays water/sewer and trash. Current rent is $850 each side.
-
2026-04-07$168,000 Active 412-char remark
Show marketing remark (412 chars)
Established investment property- Brick double with 2 bedrooms, 1 bath upstairs, living room, dining room and kitchen. Full unfinished basement w/laundry hookup. Same floor plan for each unit. Bathroom updates less than 2 years old, new outside railings, new flooring both units 2024 and 2025. Tenants pay gas, electric, cable, internet. Owner/seller pays water/sewer and trash. Current rent is $850 each side.
-
2022-07-29soldstatus $155,000
-
2022-07-29soldstatus $105,000
-
2018-12-26soldstatus $170,000
-
2012-07-02soldstatus $64,500
-
2002-12-31soldstatus $74,000
-
2001-01-08soldstatus $67,800
-
1986-10-14soldstatus $37,000
ⓘ Source: listings_history table (triggers on properties + properties_extension) + one-shot
backfill from property_details.listing_events for pre-trigger history.
Tax reassessment forecast OH · Partial reset (capped growth)
- Current annual tax
- $1,994 · $166/mo
- Projected year-2 tax
- $2,292 · $191/mo
- Expected delta
- +$298/yr (+$25/mo · 14.9%)
ⓘ Screening estimate from a state-policy table — verify with the county assessor before closing.
Climate risk First Street
- Flood 1/10 Low FEMA zone X (unshaded) · 0% chance over 30 yrs
- Wildfire 1/10 Low
- Heat 3/10 Moderate 7 d/yr ≥100°F today · 18 d/yr by 30 yrs out
- Wind 2/10 Low
- Air quality 3/10 Moderate 2 unhealthy d/yr today · 3 by 30 yrs out
Nearby sold comps map
Loading sold comps map…
Walkable amenities ~0.75 mi
Loading nearby amenities…
Taxation est. · year 1
- Rental income
- $24,180
- − Mortgage interest
- −$9,299
- − Property taxes
- −$1,994
- − Insurance
- −$830
- − Repairs & maintenance
- −$1,934
- − Management
- −$1,934
- − Depreciation
- −$4,829
- Taxable income
- $3,359
- Est. tax owed @ 24.0%
- −$806
- After-tax cash flow
- $5,025/yr
For passive investors: Depreciation is non-cash, so a rental often shows a tax loss while cash-flowing — sheltering income. Rental losses are passive: they offset passive income freely, and up to $25,000/yr can offset ordinary (W-2) income if you actively participate and your MAGI is under $100k (phasing out to $0 by $150k); unused losses carry forward. On sale, claimed depreciation is recaptured at up to 25%, and gains may owe capital-gains tax (a 1031 exchange can defer both). Figures are a year-1 estimate at your 24.0% rate — not tax advice; consult a CPA.
Schools (NCES district)
- District
- Springfield City School District
- NCES district ID
- 3904481
- Math proficiency
- 20% ▼ -16.00%
- Reading proficiency
- 27% ▼ -12.00%
- Median HH income
- $32,541
- Composite
- 19.12/100
- National rank
- #8834
- State rank
- #616 of 656 in OH
Livability — Springfield
- Score
- 56/100
- State rank
- #1108
- US rank
- #22551
Category grades
Schools grade is shown separately in the Schools card above.
Census & demographics
- Census place
- Springfield, OH
- County
- Clark · 134,280 people
- City population
- 33,261
- Metro
- Springfield, OH
- Population (ZIP)
- 32,673
- Household income
- $54,561
- Rent vs Own
- Severe rent burden
- 4.7
Population outlook (Clark County) Hauer SSP2
- Today (2025)
- 130,703 people
- By 2030
- 126,952 · -2.9%
- By 2040
- 118,344 · -9.5%
- By 2050
- 109,590 · -16.2%
- By 2075
- 89,464 · -31.6%
- By 2100
- 68,810 · -47.4%
Race, ethnicity, and origin ACS 2023
- Neighborhood character
- Predominantly White (84%)
- Race & ethnicity
- White 84% Black 9% Two or more races 5% Hispanic / Latino 2%
- Common ancestry
- Italian 2% Lithuanian 1% Slovak 1%
- Foreign-born
- 2% · Canada
- Languages at home
- 98% English-only · French/Haitian/Cajun 1% Spanish 1%
Political lean MEDSL · Clark
- 2024 margin
- Strong R (+29.5) · D 34.8% · R 64.3%
- 2008→2024 swing
- -27.0pp toward R · 2008: -2.5pp · 2024: -29.5pp
- All cycles
- 2024: R+29.5 2020: R+23.3 2016: R+19.5 2012: R+1.8 2008: R+2.5
Not yet ingested
- Civics
- —
Market trends
- HPI YoY
- ▼ -211.92%
- Current HPI
- 257.5694
- Rent YoY
- —
- Metro
- —
- State GDP YoY
- ▲ 1.98%
- F500 in state
- 48
Industry mix (Fortune 500 HQ in OH)
| Industry | F500 HQs | Revenue |
|---|---|---|
| Insurance | 3 | $145B |
|
||
| Industrial Machinery | 3 | $49B |
|
||
| Financial Services | 3 | $24B |
|
||
| Consumer Goods | 2 | $93B |
|
||
| Aerospace / Defense | 2 | $47B |
|
||
| Utilities | 2 | $33B |
|
||
Price history
+351.4% since first listed12 events — show timeline
- 2026-05-16 Relisted — WRIST
- 2026-05-15 Contingent — WRIST
- 2026-05-08 Price Changed $167,000 WRIST
- 2026-04-08 Listed $168,000 CBRMLS
- 2026-04-07 Listed $168,000 WRIST
- 2022-07-29 Sold (Public Records) $105,000 Public Records
- 2022-07-29 Sold (Public Records) $155,000 Public Records
- 2018-12-26 Sold (Public Records) $170,000 Public Records
- 2012-07-02 Sold (Public Records) $64,500 Public Records
- 2002-12-31 Sold (Public Records) $74,000 Public Records
- 2001-01-08 Sold (Public Records) $67,800 Public Records
- 1986-10-14 Sold (Public Records) $37,000 Public Records
Property tax history
+4.8%/yrLatest (2025): $1,994 · +51.8% YoY. Source: county tax records.
Cash-flow waterfall
monthlySold comps — $/sqft
last 12 mo · ≤1 miLoading sold comps…