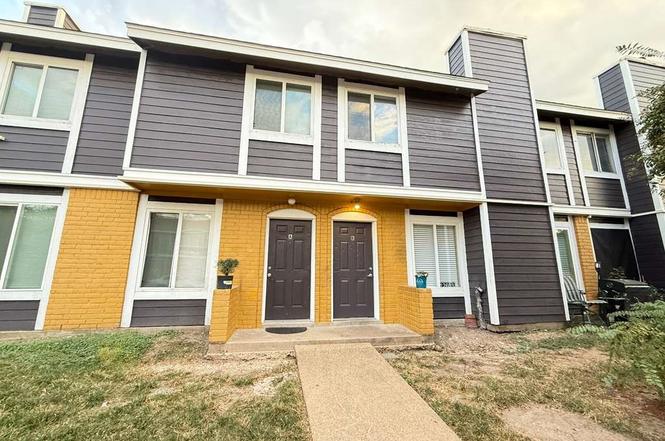
 Fourplex
12603 Ashford Meadow Dr Unit ABCD · Houston, TX
Flood risk 7/10 · Major
- FEMA flood zone
- AE
- Chance of flooding over 30 yrs
- 0.93%
- Est. flood insurance / yr
- $1,737 – $8,500
Fire risk 1/10 · Minimal
- Est. fire insurance / yr
- $1,222 – $2,270
Heat risk 9/10 · Severe
- Hot days now (above 111°F)
- 7 days/yr
- Hot days in 30 yrs
- 24 days/yr
Wind risk 9/10 · Severe
- Chance of severe wind over 30 yrs
- 99.0%
Air-quality risk 2/10 · Minimal
- Unhealthy air days now
- 2 days/yr
- Unhealthy air days in 30 yrs
- 2 days/yr
Risk factors via First Street. Map © Google.
Why this score? — see what drove the B+ grade
The composite is a weighted blend of 9 inputs, each scored 0–100. Each bar is that input's sub-score; the figure is the points it added to the 100-point composite (weight × sub-score).
- Cash flow +30.0/30.0
- ARV discount +14.7/15.0
- 1% rule +10.0/10.0
- DSCR +10.0/10.0
- Appreciation +3.9/10.0
- Livability +3.7/5.0
- Condition / age +2.5/5.0
- Rent growth +2.1/5.0
- Schools +2.1/10.0
$309,000
🖨 Deal sheet (PDF) 📄 Offer letter ✓ Due diligence
Multi-family units
County records classify this as Multi-Family (2-4 Unit). Listing-text estimate: 4 units. confirmed
Listing remarks MLS
FORECLOSURE, ATTENTION INVESTORS, THIS FOURPLEX HAS POTENTIAL. TWO UNITS UP AND TWO UNITS DOWN. ALL FOUR UNITS HAVE TWO BEDROOM, TWO FULL BATHS, DEN WITH FIREPLACE, DINING AREA AND KITCHEN. DON'T DELAY, HURRY AND SCHEDULE YOUR SHOWING.
Key facts
- Modern finishes
- Ceramic tile
- Granite countertops
Tags
Property features AI
Finance
- HOA & community: Managed by Genesis Community Mgmt; Monthly association fee of $360 covering common areas, structural maintenance, and trash
Exterior
- Utilities: Has heating; Has cooling
- Home design: Residential income property; 4 units
- Construction: Brick construction; Composition roof; Built in 1981
Interior
- Kitchen: Dishwasher; Microwave; Refrigerator
- Bedrooms: 2 beds per unit (4 total units)
- Flooring: Tile; Wood
- Bathrooms: 8 full bathrooms
- Heating & cooling: Central heating (gas); Central air conditioning (electric)
- Interior features: Fireplace
Neighborhood map
What this means for you Summary
Snapshot
- This is a 4 × 2-bed/2.0-bath units multifamily listed at $309k.
Deal economics
- At list price, monthly cash flow is $1k ($13k/yr) — positive. Per door: $264/mo.
- The deal already cash-flows at list — no discount required.
- Meets the 1% rule at list price ($5k rent vs $309k).
- Recommended offer: $300k (3.0% below list) — sets the bar for market timing.
- Cap rate 12.0% vs local median 3.2% in Houston — top-decile yield for the area; either an underpriced asset or a hidden risk that comps aren't pricing in. Stress-test before assuming the spread holds.
Location & tenants
- Location reads 74/100 on livability (#184 in TX, #4,771 nationally) — a middle-class / working-renter tenant base. Strengths: amenities A+, cost of living A+, housing A+; Watch: crime F.
- Alief ISD (urban): math 23% / reading 28% proficiency, ranked #717 of 826 in TX (top 87%) — low school quality limits family demand, transient renter base, plan for 1-2y turnover; 74% free/reduced lunch — lower-income household profile, screen leases tightly.
- Zoned schools: O'Donnell Middle (math 32% / reading 33%, grade F, #947 of 1,662 statewide, top 58%, 1,230 students, 89% FRL).
- Market conditions: Rents soft (-1.6%/yr); 302 active listings in the ZIP; 29,883 units permitted in Harris County in 2024 (8,621 in 5+ unit buildings).
- At $5,034/mo this rent would consume 97% of the median local household income ($62k/yr) (locally 3722% of renters already pay >50% of income on rent) — very limited rent-growth headroom before tenants either downsize or default.
Forward outlook
- Local home prices are declining (-2.2%/yr); year-one equity from $2k of loan paydown is wiped out by about $7k of value loss. Plan a longer hold.
- Harris County population projected at +47% by 2050 — long-run rental-demand tailwind backs the buy-and-hold thesis.
Negotiation context
- It's been on market 55 days — a 3% lower offer ($300k) is reasonable based on typical stale-listing flexibility.
- 2 sale attempts since 15y ago with the ask held roughly flat each time — persistent listings suggest the price (not the market) is what's stuck; bring a comps-based counter.
Risks & watch-outs
- Watch-outs: flood insurance adds $427/mo.
- Climate carrying-cost: in FEMA flood zone AE (mandatory federal flood insurance); severe wind risk, 99% chance of damaging wind over 30y; extreme-heat days projected 7→24/yr by 2055 (HVAC capex compounding) — expect insurance premiums to compound above CPI over the hold.
Questions for the listing agent
- It's been on market 55 days. Have you received any prior offers? Is the seller open to a 3% concession, seller financing, or rate buy-down credit?
- Can we see the unit-by-unit rent roll, current vacancy, and any below-market leases? What's the average tenancy length?
- What capital expenditures (roof, boiler, parking lot, exteriors) have been made in the last 5 years, and what's planned in the next 2?
- What's the actual annual flood-insurance premium (NFIP or private), and is the property in a SFHA with mandatory coverage?
- What does the HOA fee cover, when was the last increase, and are there any pending special assessments or reserve-fund shortfalls?
- Is there a deadline driving the sale (1031 exchange, divorce, estate, relocation)? That informs how much negotiation room exists.
- Schools are D-rated, which usually means shorter tenancies and higher turnover. Who's the typical renter profile here, and what's been the actual vacancy rate?
- Crime grade is F in this area — have there been break-ins, vandalism, or insurance claims at this property in the last 3 years? What carrier currently insures it and at what premium?
- What's the average days-on-market for RENTAL listings here right now (not sales)? A rising rental-DOM trend means longer vacancies and softer asking-rent achievability than the comps imply.
- What's the recent tenant-quality profile in this submarket — average credit score on applications, eviction rate, late-payment / NSF rate, and stable-employment percentage? A property-management company in the area should have these aggregated.
- How much new apartment / multifamily construction is in the pipeline within 1–3 miles? Heavy new supply (>2% of stock underway) typically softens rents 12–24 months out; light construction supports rent growth.
Investment metrics
- 1% rule
- 1.63% ✓
- Cap rate
- 12.05%
- Cash-on-cash
- 20.55%
- DSCR
- 1.91
- GRM
- 5.1
CMA / ARV
- ARV (median comp)
- $367,725
- List price
- $309,000
- Delta
- -15.97%
- Verdict
- UNDERPRICED
- Comps
- 16 within 1.0 mi
Show comp detail 4 sales within ~0.75 mi
| Address | Dist | Beds/Ba | Sqft | Sold | Price | $/sf | Match |
|---|---|---|---|---|---|---|---|
| 12655 Ashford Meadow Dr Unit ABCD | 0.10mi | 8/8.0 | 4,044 (-5%) | 5mo | $289,999 | $72 | 82 |
| 12646 Ashford Meadow Dr #4 | 0.08mi | 8/8.0 | 4,272 (0%) | 23mo | $225,000 | $53 | 77 |
| 12654 Ashford Meadow Dr Dr | 0.12mi | 8/8.0 | 3,746 (-12%) | 4mo | $299,500 | $80 | 70 |
| 12659 Ashford Meadow Dr #4 | 0.11mi | 8/2.0 | 3,746 (-12%) | 16mo | $370,000 | $99 | 41 |
Match score weights: distance 35% · size 25% · config 20% · recency 20%. Top-matched comps best support the ARV.
Projected returns pro-forma
-2.21% appreciation · 0.0% rent growth · sell at horizon
- IRR
- 3.9%
- Equity multiple
- 1.15×
- Total profit
- $13,308
- Equity at exit
- $57,122
- IRR
- 8.5%
- Equity multiple
- 1.61×
- Total profit
- $52,526
- Equity at exit
- $46,089
Cash invested: $86,520 (down + closing). Projections, not guarantees.
Landlord ↔ Tenant lean methodology
- Overall (STATE)
- 87 Strongly Landlord-Friendly
- State Texas
- 87 Strongly Landlord-Friendly · R+5
- County
- — inherits STATE
- City
- — inherits STATE
ZIP-level market 77082
- Home prices YoY
- -0.9%
- Rents YoY
- -1.6%
- Active inventory
- 302
- Price-to-rent
- 20.5×
Monthly cashflow live
- Estimated rent
- $5,034 high interval (Pro) →
- Mortgage (P&I)
- −$1,620
- Tax est. 1.5%
- −$386 /mo · $4,635/yr
- Insurance
- −$129
- Flood insurance flood zone
- −$427 /mo · $5,118/yr
- HOA
- −$360
- Vacancy / Maint / Mgmt
- −$1,057
- Net cashflow
- $1,055
Break-even live
Sensitivity live
| Price | -10% $1,268 | -5% $1,162 | +0% $1,055 | +5% $948 | +10% $841 |
|---|---|---|---|---|---|
| Rent | -10% $657 | -5% $856 | +0% $1,055 | +5% $1,254 | +10% $1,453 |
| Rate | -1.0pp $1,211 | -0.5pp $1,133 | base $1,055 | +0.5pp $975 | +1.0pp $893 |
4-unit breakdown (identical units grouped — click to expand)
| Units | Beds | Baths | Est. rent |
|---|---|---|---|
| 4× units | 2 | 2 | $5,036 |
| #1 | 2 | 2 | $1,259 |
| #2 | 2 | 2 | $1,259 |
| #3 | 2 | 2 | $1,259 |
| #4 | 2 | 2 | $1,259 |
| Total (4 units) | $5,034 | ||
UW: 25.0% down · 7.5% · 30yr · 1.5% tax · 5.0% vac · 8.0% maint · 8.0% mgmt
Financing live
Cash to close
- Down payment
- $77,250
- Closing costs
- $9,270
- Reserves months
- —
- Total cash needed
- —
Loan-product check · same deal, 3 products live
Conventional
25% down · 7.5% · 30yr
- Down + closing
- —
- Monthly P&I
- —
- Monthly cashflow
- —
- DSCR
- —
- Eligible?
- —
Personal DTI + credit; lowest rate.
DSCR
20% down · 8.5% · 30yr
- Down + closing
- —
- Monthly P&I
- —
- Monthly cashflow
- —
- DSCR
- —
- Eligible?
- —
No personal income docs; deal must DSCR.
Hard money
10% down · 12.0% · 12mo
- Down + closing
- —
- Monthly P&I
- —
- Monthly cashflow
- —
- DSCR
- —
- Eligible?
- —
Short-term bridge; refi at stabilization.
HOA detail
- Monthly dues
- $360 · $4,320/yr
Listing history 18 events
-
2026-06-21days on market $309,000 Active 55 DOM
-
2026-06-18days on market $309,000 Active 52 DOM
-
2026-06-17days on market $309,000 Active 51 DOM
-
2026-06-16days on market $309,000 Active 50 DOM
-
2026-06-15days on market $309,000 Active 49 DOM
-
2026-06-13days on market $309,000 Active 47 DOM
-
2026-06-09days on market $309,000 Active 43 DOM
-
2026-06-08days on market $309,000 Active 42 DOM
-
2026-06-07days on market $309,000 Active 41 DOM
-
2026-06-04days on market $309,000 Active 38 DOM
-
2026-06-03days on market $309,000 Active 37 DOM
-
2026-06-02days on market $309,000 Active 36 DOM
-
2026-06-01days on market $309,000 Active 35 DOM
-
2026-05-31days on market $309,000 Active 34 DOM
-
2026-04-27$309,000 Active 989-char remark
-
2011-06-30soldstatus 239-char remark
Show marketing remark (239 chars)
FORECLOSURE, ATTENTION INVESTORS, THIS FOURPLEX HAS POTENTIAL. TWO UNITS UP AND TWO UNITS DOWN. ALL FOUR UNITS HAVE TWO BEDROOM, TWO FULL BATHS, DEN WITH FIREPLACE, DINING AREA AND KITCHEN. DON'T DELAY, HURRY AND SCHEDULE YOUR SHOWING.
-
2011-06-28historical 239-char remark
Show marketing remark (239 chars)
FORECLOSURE, ATTENTION INVESTORS, THIS FOURPLEX HAS POTENTIAL. TWO UNITS UP AND TWO UNITS DOWN. ALL FOUR UNITS HAVE TWO BEDROOM, TWO FULL BATHS, DEN WITH FIREPLACE, DINING AREA AND KITCHEN. DON'T DELAY, HURRY AND SCHEDULE YOUR SHOWING.
-
2011-05-31$58,000 239-char remark
Show marketing remark (239 chars)
FORECLOSURE, ATTENTION INVESTORS, THIS FOURPLEX HAS POTENTIAL. TWO UNITS UP AND TWO UNITS DOWN. ALL FOUR UNITS HAVE TWO BEDROOM, TWO FULL BATHS, DEN WITH FIREPLACE, DINING AREA AND KITCHEN. DON'T DELAY, HURRY AND SCHEDULE YOUR SHOWING.
ⓘ Source: listings_history table (triggers on properties + properties_extension) + one-shot
backfill from property_details.listing_events for pre-trigger history.
Climate risk First Street
- Flood 7/10 Severe FEMA zone AE · 93% chance over 30 yrs
- Wildfire 1/10 Low
- Heat 9/10 Extreme 7 d/yr ≥111°F today · 24 d/yr by 30 yrs out
- Wind 9/10 Extreme 99% chance of damaging wind over 30 yrs
- Air quality 2/10 Low 2 unhealthy d/yr today · 2 by 30 yrs out
Nearby sold comps map
Loading sold comps map…
Walkable amenities ~0.75 mi
Loading nearby amenities…
Taxation est. · year 1
- Rental income
- $60,408
- − Mortgage interest
- −$17,309
- − Property taxes
- −$4,635
- − Insurance
- −$6,664
- − Repairs & maintenance
- −$4,833
- − Management
- −$4,833
- − HOA
- −$4,320
- − Depreciation
- −$8,989
- Taxable income
- $8,826
- Est. tax owed @ 24.0%
- −$2,118
- After-tax cash flow
- $10,540/yr
For passive investors: Depreciation is non-cash, so a rental often shows a tax loss while cash-flowing — sheltering income. Rental losses are passive: they offset passive income freely, and up to $25,000/yr can offset ordinary (W-2) income if you actively participate and your MAGI is under $100k (phasing out to $0 by $150k); unused losses carry forward. On sale, claimed depreciation is recaptured at up to 25%, and gains may owe capital-gains tax (a 1031 exchange can defer both). Figures are a year-1 estimate at your 24.0% rate — not tax advice; consult a CPA.
Schools (NCES district)
- District
- Alief ISD
- NCES district ID
- 4807830
- Math proficiency
- 23% ▼ -19.00%
- Reading proficiency
- 28% ▼ -8.00%
- Median HH income
- $37,775
- Composite
- 21.29/100
- National rank
- #8391
- State rank
- #717 of 826 in TX
Livability — Houston
- Score
- 74/100
- State rank
- #184
- US rank
- #4771
Category grades
Schools grade is shown separately in the Schools card above.
Census & demographics
- Census place
- Houston, TX
- County
- Harris County · 4,702,590 people
- City population
- 3,226,434
- Metro
- Houston-The Woodlands-Sugar Land, TX
- Population (ZIP)
- 59,412
- Household income
- $62,455
- Rent vs Own
- Severe rent burden
- 3722.0
Population outlook (Harris County) Hauer SSP2
- Today (2025)
- 5,571,493 people
- By 2030
- 6,089,821 · +9.3%
- By 2040
- 7,142,806 · +28.2%
- By 2050
- 8,185,864 · +46.9%
- By 2075
- 10,574,329 · +89.8%
- By 2100
- 12,109,958 · +117.4%
Race, ethnicity, and origin ACS 2023
- Neighborhood character
- Highly diverse neighborhood (Simpson 0.72)
- Race & ethnicity
- Black 40% Hispanic / Latino 27% White 20% Two or more races 14% Asian 10%
- Hispanic origin (detail)
- Mexican 14% Puerto Rican 1% Cuban 2%
- Common ancestry
- Armenian 2% Arab 1% Lithuanian 0%
- Foreign-born
- 39% · Canada, Vietnam, Jamaica
- Languages at home
- 56% English-only · Spanish 22% Vietnamese 4% Arabic 4%
Political lean MEDSL · Harris
- 2024 margin
- Lean D (+5.5) · D 52.0% · R 46.4% · Other 1.6%
- 2008→2024 swing
- +3.9pp toward D · 2008: 1.6pp · 2024: 5.5pp
- All cycles
- 2024: D+5.5 2020: D+13.3 2016: D+12.4 2012: D+0.1 2008: D+1.6
Not yet ingested
- Civics
- —
Market trends
- HPI YoY
- ▼ -2.21%
- Current HPI
- 237.2183
- Rent YoY
- ▼ -1.62%
- Metro
- Houston-The Woodlands-Sugar Land, TX
- State GDP YoY
- ▲ 3.95%
- F500 in state
- 110
Industry mix (Fortune 500 HQ in TX)
| Industry | F500 HQs | Revenue |
|---|---|---|
| Energy | 16 | $1,198B |
|
||
| Technology | 5 | $198B |
|
||
| Engineering / Construction | 4 | $72B |
|
||
| Energy Services | 3 | $60B |
|
||
| Utilities | 3 | $41B |
|
||
| Healthcare | 2 | $330B |
|
||
Price history
+432.8% since first listed4 events — show timeline
- 2026-04-27 Listed $309,000 HARMLS
- 2011-06-30 Sold (MLS) — HARMLS
- 2011-06-28 Listing Removed — HARMLS
- 2011-05-31 Listed $58,000 HARMLS
Cash-flow waterfall
monthlySold comps — $/sqft
last 12 mo · ≤1 miLoading sold comps…