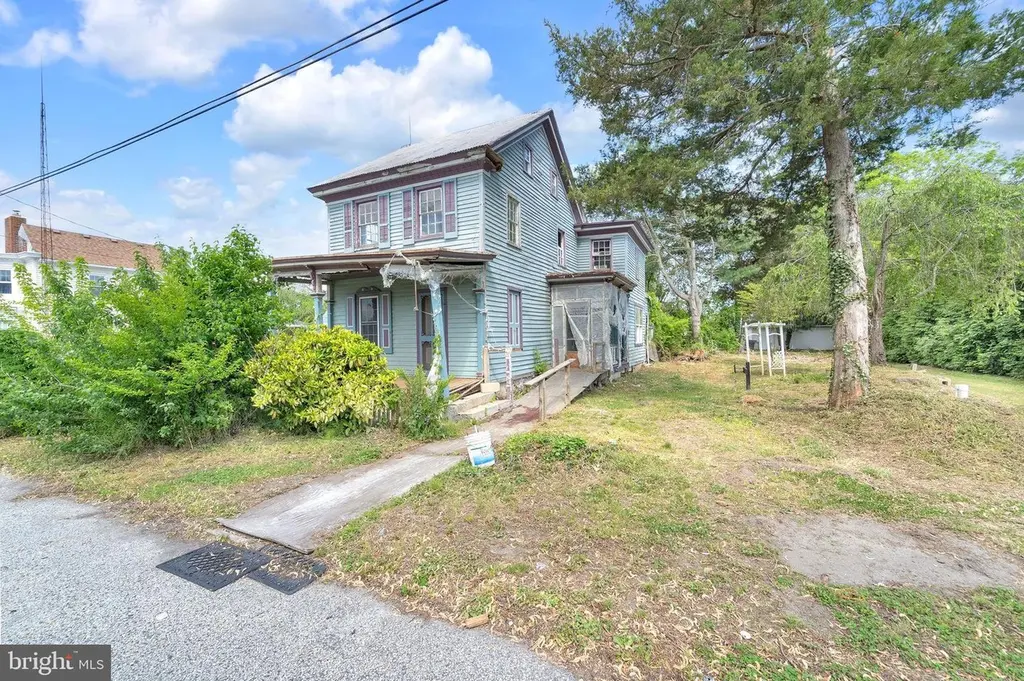
2528 Market St · Port Norris, NJ
Flood risk 7/10 · Major
- FEMA flood zone
- X (shaded)
- Chance of flooding over 30 yrs
- 0.95%
- Est. flood insurance / yr
- $507 – $1,088
Fire risk 3/10 · Minor
- Est. fire insurance / yr
- $526 – $976
Heat risk 7/10 · Major
- Hot days now (above 102°F)
- 7 days/yr
- Hot days in 30 yrs
- 16 days/yr
Wind risk 8/10 · Major
- Chance of severe wind over 30 yrs
- 80.0%
Air-quality risk 6/10 · Moderate
- Unhealthy air days now
- 7 days/yr
- Unhealthy air days in 30 yrs
- 11 days/yr
Risk factors via First Street. Map © Google.
Why this score? — see what drove the B grade
The composite is a weighted blend of 9 inputs, each scored 0–100. Each bar is that input's sub-score; the figure is the points it added to the 100-point composite (weight × sub-score).
- Cash flow +30.0/30.0
- 1% rule +10.0/10.0
- DSCR +10.0/10.0
- ARV discount +7.5/15.0
- Appreciation +4.8/10.0
- Livability +2.9/5.0
- Rent growth +2.5/5.0
- Condition / age +2.5/5.0
- Schools +1.5/10.0
$89,000
🖨 Deal sheet 📄 Offer letter ✓ Due diligence
Listing remarks MLS
Investor alert!!! Huge Victorian just a short drive to the shore with comparable sales in excess of $350,000! This 4BD/2BTH fixer upper is overflowing with historic charm & just waiting for someone to make it their own. Full bathroom and one bedroom located on the first floor for maximum convenience. Third floor attic & basement offer an abundance of storage space. Strictly as-is sale, buyer is responsible for the CO. Seller obtained property via tax lien foreclosure. Seller prefers to use Brennan Title to complete the transaction. Seller makes no guarantees or warranties as to the condition or accuracy of the information provided. Seller has never seen nor been to property. Schedule a private tour!
Key facts
- Third floor attic
- First floor bathroom
- Historic charm
Tags
Property features AI
Exterior
- Parking: On-street parking
- Utilities: Well water; Private sewer / septic
- Home design: Detached structure; Above-grade finished area reported as 1,938 sq ft
- Construction: Wood siding; Permanent foundation; Other structures above grade and below grade; Year built reported by assessor
- Exterior features: Porch(es); Lot dimensions approximately 66.00 x 140.25; Located in a federal flood zone
Interior
- Bedrooms: Three bedrooms on the first upper level; One bedroom on the main level
- Bathrooms: Two full bathrooms total (one on main level, one on first upper level)
- Heating & cooling: Radiator heating; Oil fuel; Electric hot water
- Interior features: Basement (full); Attic; Living area reported by assessor
Neighborhood map
What this means for you Summary
Snapshot
- This is a 4-bed/2.0-bath single-family listed at $89k.
Deal economics
- At list price, monthly cash flow is $774 ($9k/yr) — positive.
- The deal already cash-flows at list — no discount required.
- Meets the 1% rule at list price ($2k rent vs $89k).
- Recommended offer: $86k (3.0% below list) — sets the bar for market timing.
Location & tenants
- Location reads 58/100 on livability (#508 in NJ) — a working-class tenant base; expect higher turnover. Strengths: crime A+; Watch: schools F, amenities F, commute F.
- Commercial Township School District (rural): math 5% / reading 29% proficiency, ranked #449 of 472 in NJ (top 95%) — low school quality limits family demand, transient renter base, plan for 1-2y turnover; 65% free/reduced lunch — lower-income household profile, screen leases tightly.
- Market conditions: 24 active listings in the ZIP; 216 units permitted in Cumberland County in 2024 (73 in 5+ unit buildings).
Forward outlook
- In year one you build about $290 of equity ($615 loan paydown + $-325 appreciation (-0.4% local appreciation)).
- Cumberland County population projected to shrink 7% by 2050 — rents likely to lag national; underwrite the cash flow, not the appreciation.
- At projected returns (-0.4% appreciation + 3.0% rent growth), your $25k cash investment doubles in ~3 years — after that, you're playing with house money.
Negotiation context
- It's been on market 37 days — a 3% lower offer ($86k) is reasonable based on typical stale-listing flexibility.
- 2 sale attempts; this cycle's ask has dropped $11k (11%) from the opening price — seller is motivated, your offer sets the floor, not the list.
Risks & watch-outs
- Watch-outs: flood insurance adds $66/mo; built in 1880 — expect roof / HVAC / electrical / plumbing capex.
- Climate carrying-cost: major flood risk; severe wind risk, 80% chance of damaging wind over 30y; extreme-heat days projected 7→16/yr by 2055 (HVAC capex compounding) — expect insurance premiums to compound above CPI over the hold.
Questions for the listing agent
- It's been on market 37 days. Have you received any prior offers? Is the seller open to a 3% concession, seller financing, or rate buy-down credit?
- Built in 1880 — when were the roof, HVAC, electrical panel, plumbing, and water heater last replaced?
- What's the actual annual flood-insurance premium (NFIP or private), and is the property in a SFHA with mandatory coverage?
- Is there a deadline driving the sale (1031 exchange, divorce, estate, relocation)? That informs how much negotiation room exists.
- Schools are F-rated, which usually means shorter tenancies and higher turnover. Who's the typical renter profile here, and what's been the actual vacancy rate?
- What's the average days-on-market for RENTAL listings here right now (not sales)? A rising rental-DOM trend means longer vacancies and softer asking-rent achievability than the comps imply.
- What's the recent tenant-quality profile in this submarket — average credit score on applications, eviction rate, late-payment / NSF rate, and stable-employment percentage? A property-management company in the area should have these aggregated.
- How much new for-sale + rental construction is in the pipeline within 1–3 miles? Heavy new supply typically softens prices + rents 12–24 months out; constrained supply supports both.
Investment metrics
- 1% rule
- 2.07% ✓
- Cap rate
- 17.63%
- Cash-on-cash
- 40.48%
- DSCR
- 2.80
- GRM
- 4.0
CMA / ARV
- ARV (median comp)
- $229,461
- List price
- $89,000
- Delta
- -61.21%
- Verdict
- UNDERPRICED
- Comps
- 20 within 1.0 mi
Show comp detail 9 sales within ~0.75 mi
| Address | Dist | Beds/Ba | Sqft | Sold | Price | $/sf | Match |
|---|---|---|---|---|---|---|---|
| 1668 Main St | 0.21mi | 4/1.5 | 2,032 (+5%) | 2mo | $65,000 | $32 | 79 |
| 1794 Main St | 0.51mi | 4/2.5 | 1,988 (+3%) | 3mo | $150,000 | $75 | 68 |
| 2533 High St | 0.06mi | 3/1.5 (-1) | 1,686 (-13%) | 2mo | $261,000 | $155 | 67 |
| 1726 Main St | 0.24mi | 3/1.5 (-1) | 1,864 (-4%) | 12mo | $235,000 | $126 | 66 |
| 2317 Market St | 0.28mi | 3/2.5 (-1) | 2,100 (+8%) | 19mo | $350,000 | $167 | 50 |
| 2510 High St | 0.12mi | 3/1.5 (-1) | 1,660 (-14%) | 18mo | $272,000 | $164 | 49 |
| 6311 Brown St | 0.34mi | 3/1.0 (-1) | 1,736 (-10%) | 11mo | $147,500 | $85 | 48 |
| 6824 Brown St | 0.30mi | 3/1.5 (-1) | 1,688 (-13%) | 17mo | $275,000 | $163 | 44 |
| 2400 Maurice St | 0.68mi | 4/3.0 | 1,736 (-10%) | 9mo | $338,000 | $195 | 39 |
Match score weights: distance 35% · size 25% · config 20% · recency 20%. Top-matched comps best support the ARV.
Projected returns pro-forma
-0.37% appreciation · 3.0% rent growth · sell at horizon
- IRR
- 37.6%
- Equity multiple
- 2.82×
- Total profit
- $45,251
- Equity at exit
- $24,229
- IRR
- 41.2%
- Equity multiple
- 5.54×
- Total profit
- $113,159
- Equity at exit
- $27,866
Cash invested: $24,920 (down + closing). Projections, not guarantees.
Landlord ↔ Tenant lean methodology
- Overall (STATE)
- 21 Tenant-Leaning
- State New Jersey
- 21 Tenant-Leaning · D+6
- County
- — inherits STATE
- City
- — inherits STATE
ZIP-level market 08349
- Home prices YoY
- -0.2%
- Active inventory
- 24
- Price-to-rent
- 4.0×
Monthly cashflow live
- Estimated rent
- $1,843 medium interval (Pro) →
- Mortgage (P&I)
- −$467
- Tax est. 1.5%
- −$111 /mo · $1,335/yr
- Insurance
- −$37
- Flood insurance flood zone
- −$66 /mo · $798/yr
- HOA
- −$0
- Vacancy / Maint / Mgmt
- −$387
- Net cashflow
- $774
Break-even live
UW: 25.0% down · 7.5% · 30yr · 1.5% tax · 5.0% vac · 8.0% maint · 8.0% mgmt
Financing live
Cash to close
- Down payment
- $22,250
- Closing costs
- $2,670
- Reserves months
- —
- Total cash needed
- —
Loan-product check · same deal, 3 products live
Conventional
25% down · 7.5% · 30yr
- Down + closing
- —
- Monthly P&I
- —
- Monthly cashflow
- —
- DSCR
- —
- Eligible?
- —
Personal DTI + credit; lowest rate.
DSCR
20% down · 8.5% · 30yr
- Down + closing
- —
- Monthly P&I
- —
- Monthly cashflow
- —
- DSCR
- —
- Eligible?
- —
No personal income docs; deal must DSCR.
Hard money
10% down · 12.0% · 12mo
- Down + closing
- —
- Monthly P&I
- —
- Monthly cashflow
- —
- DSCR
- —
- Eligible?
- —
Short-term bridge; refi at stabilization.
Listing history 17 events
-
2026-06-19days on market $89,000 Active 37 DOM
-
2026-06-18days on market $89,000 Active 36 DOM
-
2026-06-17days on market $89,000 Active 35 DOM
-
2026-06-16days on market $89,000 Active 34 DOM
-
2026-06-15days on market $89,000 Active 33 DOM
-
2026-06-14days on market $89,000 Active 31 DOM
-
2026-06-13days on market $89,000 Active 30 DOM
-
2026-06-10days on market $89,000 Active 28 DOM
-
2026-06-09days on market $89,000 Active 27 DOM
-
2026-06-08days on market $89,000 Active 26 DOM
-
2026-06-07days on market $89,000 Active 25 DOM
-
2026-06-02days on market $89,000 Active 20 DOM
-
2026-06-01days on market $89,000 Active 19 DOM
-
2026-05-31days on market $89,000 Active 18 DOM
-
2026-05-30days on market $89,000 Active 17 DOM
-
2026-05-13$99,900 Active 720-char remark
Show marketing remark (720 chars)
Investor alert!!! Huge Victorian just a short drive to the shore with comparable sales in excess of $350,000! This 4BD/2BTH fixer upper is overflowing with historic charm & just waiting for someone to make it their own. Full bathroom and one bedroom located on the first floor for maximum convenience. Third floor attic & basement offer an abundance of storage space. Strictly as-is sale, buyer is responsible for the CO. Seller obtained property via tax lien foreclosure. Seller prefers to use Brennan Title to complete the transaction. Seller makes no guarantees or warranties as to the condition or accuracy of the information provided. Seller has never seen nor been to property. Schedule a private tour!
ⓘ Source: listings_history table (triggers on properties + properties_extension) + one-shot
backfill from property_details.listing_events for pre-trigger history.
Climate risk First Street
- Flood 7/10 Severe FEMA zone X (shaded) · 95% chance over 30 yrs
- Wildfire 3/10 Moderate
- Heat 7/10 Severe 7 d/yr ≥102°F today · 16 d/yr by 30 yrs out
- Wind 8/10 Severe 80% chance of damaging wind over 30 yrs
- Air quality 6/10 Major 7 unhealthy d/yr today · 11 by 30 yrs out
Nearby sold comps map
Loading sold comps map…
Walkable amenities ~0.75 mi
Loading nearby amenities…
Taxation est. · year 1
- Rental income
- $22,111
- − Mortgage interest
- −$4,985
- − Property taxes
- −$1,335
- − Insurance
- −$1,242
- − Repairs & maintenance
- −$1,769
- − Management
- −$1,769
- − Depreciation
- −$2,589
- Taxable income
- $8,421
- Est. tax owed @ 24.0%
- −$2,021
- After-tax cash flow
- $7,268/yr
For passive investors: Depreciation is non-cash, so a rental often shows a tax loss while cash-flowing — sheltering income. Rental losses are passive: they offset passive income freely, and up to $25,000/yr can offset ordinary (W-2) income if you actively participate and your MAGI is under $100k (phasing out to $0 by $150k); unused losses carry forward. On sale, claimed depreciation is recaptured at up to 25%, and gains may owe capital-gains tax (a 1031 exchange can defer both). Figures are a year-1 estimate at your 24.0% rate — not tax advice; consult a CPA.
Schools (NCES district)
- District
- Commercial Township School District
- NCES district ID
- 3403480
- Math proficiency
- 5% ▼ -7.00%
- Reading proficiency
- 29% ▲ 10.00%
- Median HH income
- $45,143
- Composite
- 14.86/100
- National rank
- #9378
- State rank
- #449 of 472 in NJ
Livability — Port Norris
- Score
- 58/100
- State rank
- #508
- US rank
- #21543
Category grades
Schools grade is shown separately in the Schools card above.
Census & demographics
- Census place
- Port Norris, NJ
- City population
- 2,400
- Population (ZIP)
- 2,400
Population outlook (Cumberland County) Hauer SSP2
- Today (2025)
- 152,743 people
- By 2030
- 150,373 · -1.6%
- By 2040
- 146,881 · -3.8%
- By 2050
- 142,653 · -6.6%
- By 2075
- 129,468 · -15.2%
- By 2100
- 107,456 · -29.6%
Race, ethnicity, and origin ACS 2023
- Neighborhood character
- Predominantly White (68%)
- Race & ethnicity
- White 68% Black 19% Hispanic / Latino 9% Two or more races 7% Native American 3%
- Hispanic origin (detail)
- Puerto Rican 3%
- Common ancestry
- Slovak 11% Romanian 5% Lithuanian 2%
- Foreign-born
- 2% · Canada
- Languages at home
- 97% English-only · Spanish 1% Other Indo-European 1%
Political lean MEDSL · Cumberland
- 2024 margin
- Toss-up / Even · D 47.6% · R 51.3% · Other 1.1%
- 2008→2024 swing
- -25.4pp toward R · 2008: 21.6pp · 2024: -3.8pp
- All cycles
- 2024: R+3.8 2020: D+6.0 2016: D+5.3 2012: D+23.1 2008: D+21.6
Not yet ingested
- Civics
- —
Market trends
- HPI YoY
- ▼ -0.37%
- Current HPI
- 177.1561
- Rent YoY
- —
- Metro
- —
- State GDP YoY
- ▲ 2.05%
- F500 in state
- 34
Industry mix (Fortune 500 HQ in NJ)
| Industry | F500 HQs | Revenue |
|---|---|---|
| Consumer Goods | 3 | $31B |
|
||
| Pharmaceuticals | 2 | $153B |
|
||
| Technology | 2 | $21B |
|
||
| Insurance | 2 | $20B |
|
||
| Healthcare | 2 | $19B |
|
||
| Financial Services | 1 | $70B |
|
||
Price history
-10.9% since first listed4 events — show timeline
- 2026-05-27 Price Changed $89,000 SJSRMLS
- 2026-05-26 Price Changed $89,000 BRIGHT MLS
- 2026-05-13 Listed $99,900 BRIGHT MLS
- 2026-05-13 Listed $99,900 SJSRMLS
Property tax history
+3.6%/yrLatest (2025): $4,962 · +4.8% YoY. Source: county tax records.
Cash-flow waterfall
monthlySold comps — $/sqft
last 12 mo · ≤1 miLoading sold comps…