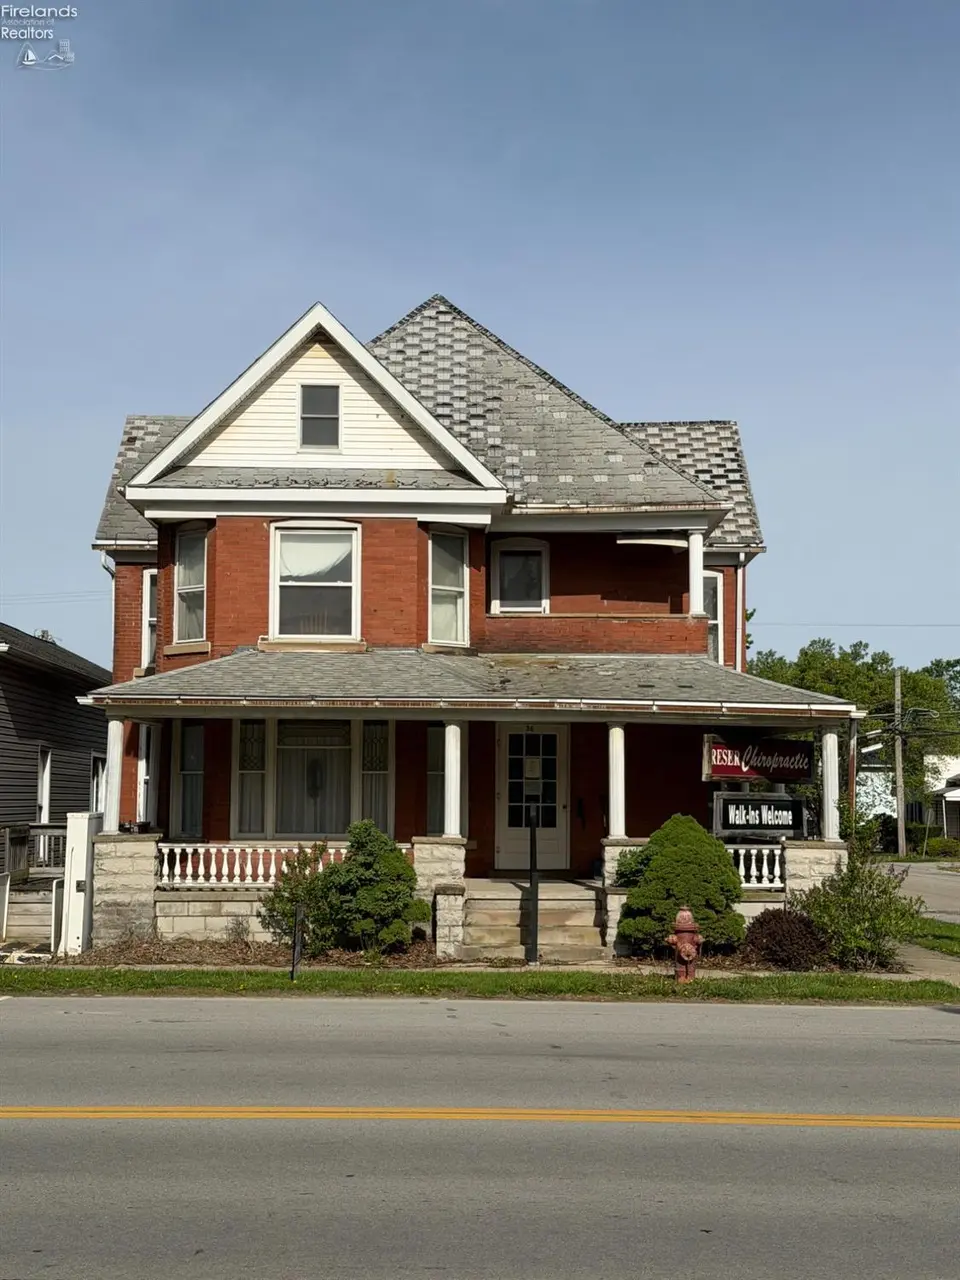
36 N Main St · Attica, OH
Flood risk 1/10 · Minimal
- FEMA flood zone
- X (unshaded)
- Chance of flooding over 30 yrs
- 0.0%
- Est. flood insurance / yr
- $473 – $860
Fire risk 1/10 · Minimal
- Est. fire insurance / yr
- $713 – $1,323
Heat risk 3/10 · Minor
- Hot days now (above 98°F)
- 7 days/yr
- Hot days in 30 yrs
- 17 days/yr
Wind risk 2/10 · Minimal
- Chance of severe wind over 30 yrs
- —
Air-quality risk 2/10 · Minimal
- Unhealthy air days now
- 1 days/yr
- Unhealthy air days in 30 yrs
- 1 days/yr
Risk factors via First Street. Map © Google.
Why this score? — see what drove the C grade
The composite is a weighted blend of 9 inputs, each scored 0–100. Each bar is that input's sub-score; the figure is the points it added to the 100-point composite (weight × sub-score).
- ARV discount +15.0/15.0
- Cash flow +12.5/30.0
- Appreciation +10.0/10.0
- Schools +5.9/10.0
- DSCR +3.7/10.0
- Livability +3.4/5.0
- 1% rule +3.2/10.0
- Rent growth +2.5/5.0
- Condition / age +2.5/5.0
$139,900
🖨 Deal sheet (PDF) 📄 Offer letter ✓ Due diligence
Listing remarks MLS
Very large brick home on the edge of the business district. Room out back for a large garage. Zoning is open to businesses.
Key facts
- Intricate trim work
- 6,300 sq ft lot
- Built 1920
Tags
Property features AI
Exterior
- Parking: Off-street parking
- Utilities: Public water; Public sewer
- Home design: Single family residence; Residential property
- Construction: Brick construction
- Exterior features: Asphalt roof
Interior
- Bathrooms: 2 full bathrooms
- Heating & cooling: Natural gas heating; Forced air system
- Interior features: Full basement
Neighborhood map
What this means for you Summary
Snapshot
- This is a 5-bed/2.0-bath single-family listed at $140k.
Deal economics
- At list price, monthly cash flow is $-22 ($-259/yr) — negative.
- To cash-flow at today's rent, offer at most $136k (2.7% below list).
- To meet the 1% rule (rent ≥ 1% of price), the offer needs to be $115k (18.0% below list).
- Recommended offer: $115k (18.0% below list) — sets the bar for 1% rule.
Location & tenants
- Location reads 68/100 on livability (#580 in OH) — a middle-class / working-renter tenant base. Strengths: cost of living A+, housing A+, schools B+; Watch: crime C-, amenities F, commute F.
- Seneca East Local (rural): math 70% / reading 68% proficiency, ranked #155 of 656 in OH (top 24%) — acceptable for families but not a draw, mixed tenant base, ~2y average lease.
- Market conditions: 7 active listings in the ZIP; solid renter incomes; 45 units permitted in Seneca County in 2024 (0 in 5+ unit buildings).
Forward outlook
- In year one you build about $15k of equity ($967 loan paydown + $14k appreciation (10.0% local appreciation)).
- Seneca County population projected at -14% by 2050 — secular population decline; favor cash flow + early exit over multi-decade hold.
- At projected returns (10.0% appreciation + 3.0% rent growth), your $39k cash investment doubles in ~3 years — after that, you're playing with house money.
- By year 3, paydown + projected appreciation supports a ~$38k cash-out refi (75% LTV) — recoverable capital for the next deal without selling this one.
Negotiation context
- It's been on market 52 days — a 3% lower offer ($136k) is reasonable based on typical stale-listing flexibility.
- 2 sale attempts since 11y ago with the ask held roughly flat each time — persistent listings suggest the price (not the market) is what's stuck; bring a comps-based counter.
- Current owner paid $54k; list at $140k implies a 157% gain — meaningful room to come down on a strong offer.
Risks & watch-outs
- Watch-outs: built in 1920 — expect roof / HVAC / electrical / plumbing capex.
Questions for the listing agent
- What do current leases actually rent for vs. the listed asking? Can we see a recent rent roll and the last 12 months of T-12 income?
- It's been on market 52 days. Have you received any prior offers? Is the seller open to a 18% concession, seller financing, or rate buy-down credit?
- Built in 1920 — when were the roof, HVAC, electrical panel, plumbing, and water heater last replaced?
- Is there a deadline driving the sale (1031 exchange, divorce, estate, relocation)? That informs how much negotiation room exists.
- Schools are B-rated — typically a magnet for longer-tenancy family renters. What's the average tenant stay here, and is there a school-zone premium baked into asking?
- What's the average days-on-market for RENTAL listings here right now (not sales)? A rising rental-DOM trend means longer vacancies and softer asking-rent achievability than the comps imply.
- What's the recent tenant-quality profile in this submarket — average credit score on applications, eviction rate, late-payment / NSF rate, and stable-employment percentage? A property-management company in the area should have these aggregated.
- How much new for-sale + rental construction is in the pipeline within 1–3 miles? Heavy new supply typically softens prices + rents 12–24 months out; constrained supply supports both.
Investment metrics
- 1% rule
- 0.82% ✗
- Cap rate
- 6.11%
- Cash-on-cash
- -0.66%
- DSCR
- 0.97
- GRM
- 10.2
CMA / ARV
- ARV (median comp)
- $216,597
- List price
- $139,900
- Delta
- -35.41%
- Verdict
- UNDERPRICED
- Comps
- 6 within 1.0 mi
Projected returns pro-forma
10.0% appreciation · 3.0% rent growth · sell at horizon
- IRR
- 23.8%
- Equity multiple
- 2.91×
- Total profit
- $74,813
- Equity at exit
- $126,033
- IRR
- 21.1%
- Equity multiple
- 6.65×
- Total profit
- $221,379
- Equity at exit
- $271,795
Cash invested: $39,172 (down + closing). Projections, not guarantees.
Landlord ↔ Tenant lean methodology
- Overall (STATE)
- 73 Landlord-Friendly
- State Ohio
- 73 Landlord-Friendly · R+6
- County
- — inherits STATE
- City
- — inherits STATE
ZIP-level market 44807
- Home prices YoY
- 5.3%
- Active inventory
- 7
- Price-to-rent
- 10.2×
Monthly cashflow live
- Estimated rent
- $1,147 medium interval (Pro) →
- Mortgage (P&I)
- −$734
- Tax from tax record
- −$136 /mo · $1,631/yr
- Insurance
- −$58
- HOA
- −$0
- Vacancy / Maint / Mgmt
- −$241
- Net cashflow
- $-22
Break-even live
Sensitivity live
| Price | -10% $58 | -5% $18 | +0% $-22 | +5% $-61 | +10% $-101 |
|---|---|---|---|---|---|
| Rent | -10% $-112 | -5% $-67 | +0% $-22 | +5% $24 | +10% $69 |
| Rate | -1.0pp $49 | -0.5pp $14 | base $-22 | +0.5pp $-58 | +1.0pp $-95 |
UW: 25.0% down · 7.5% · 30yr · 1.5% tax · 5.0% vac · 8.0% maint · 8.0% mgmt
Financing live
Cash to close
- Down payment
- $34,975
- Closing costs
- $4,197
- Reserves months
- —
- Total cash needed
- —
Loan-product check · same deal, 3 products live
Conventional
25% down · 7.5% · 30yr
- Down + closing
- —
- Monthly P&I
- —
- Monthly cashflow
- —
- DSCR
- —
- Eligible?
- —
Personal DTI + credit; lowest rate.
DSCR
20% down · 8.5% · 30yr
- Down + closing
- —
- Monthly P&I
- —
- Monthly cashflow
- —
- DSCR
- —
- Eligible?
- —
No personal income docs; deal must DSCR.
Hard money
10% down · 12.0% · 12mo
- Down + closing
- —
- Monthly P&I
- —
- Monthly cashflow
- —
- DSCR
- —
- Eligible?
- —
Short-term bridge; refi at stabilization.
Listing history 18 events
-
2026-06-19days on market $139,900 Active 52 DOM
-
2026-06-18days on market $139,900 Active 51 DOM
-
2026-06-17days on market $139,900 Active 50 DOM
-
2026-06-16days on market $139,900 Active 49 DOM
-
2026-06-15days on market $139,900 Active 48 DOM
-
2026-06-14days on market $139,900 Active 46 DOM
-
2026-06-12days on market $139,900 Active 45 DOM
-
2026-06-09days on market $139,900 Active 42 DOM
-
2026-06-08days on market $139,900 Active 41 DOM
-
2026-06-07days on market $139,900 Active 40 DOM
-
2026-06-07days on market $139,900 Active 39 DOM
-
2026-06-02days on market $139,900 Active 35 DOM
-
2026-06-01days on market $139,900 Active 34 DOM
-
2026-05-31days on market $139,900 Active 33 DOM
-
2026-05-30days on market $139,900 Active 32 DOM
-
2026-04-27$139,900 Active 812-char remark
-
2015-08-28soldstatus $54,500 123-char remark
Show marketing remark (123 chars)
Very large brick home on the edge of the business district. Room out back for a large garage. Zoning is open to businesses.
-
2015-02-03$69,900 123-char remark
Show marketing remark (123 chars)
Very large brick home on the edge of the business district. Room out back for a large garage. Zoning is open to businesses.
ⓘ Source: listings_history table (triggers on properties + properties_extension) + one-shot
backfill from property_details.listing_events for pre-trigger history.
Tax reassessment forecast OH · Partial reset (capped growth)
- Current annual tax
- $1,631 · $136/mo
- Projected year-2 tax
- $1,907 · $159/mo
- Expected delta
- +$276/yr (+$23/mo · 16.9%)
ⓘ Screening estimate from a state-policy table — verify with the county assessor before closing.
Climate risk First Street
- Flood 1/10 Low FEMA zone X (unshaded) · 0% chance over 30 yrs
- Wildfire 1/10 Low
- Heat 3/10 Moderate 7 d/yr ≥98°F today · 17 d/yr by 30 yrs out
- Wind 2/10 Low
- Air quality 2/10 Low 1 unhealthy d/yr today · 1 by 30 yrs out
Nearby sold comps map
Loading sold comps map…
Walkable amenities ~0.75 mi
Loading nearby amenities…
Taxation est. · year 1
- Rental income
- $13,767
- − Mortgage interest
- −$7,837
- − Property taxes
- −$1,631
- − Insurance
- −$700
- − Repairs & maintenance
- −$1,101
- − Management
- −$1,101
- − Depreciation
- −$4,070
- Taxable loss
- −$2,673
- Est. tax savings @ 24.0%
- +$642
- After-tax cash flow
- $383/yr
For passive investors: Depreciation is non-cash, so a rental often shows a tax loss while cash-flowing — sheltering income. Rental losses are passive: they offset passive income freely, and up to $25,000/yr can offset ordinary (W-2) income if you actively participate and your MAGI is under $100k (phasing out to $0 by $150k); unused losses carry forward. On sale, claimed depreciation is recaptured at up to 25%, and gains may owe capital-gains tax (a 1031 exchange can defer both). Figures are a year-1 estimate at your 24.0% rate — not tax advice; consult a CPA.
Schools (NCES district)
- District
- Seneca East Local
- NCES district ID
- 3904968
- Math proficiency
- 70% ▼ -7.00%
- Reading proficiency
- 68% ▼ -4.00%
- Median HH income
- $55,832
- Composite
- 59.11/100
- National rank
- #955
- State rank
- #155 of 656 in OH
Livability — Attica
- Score
- 68/100
- State rank
- #580
- US rank
- #9860
Category grades
Schools grade is shown separately in the Schools card above.
Census & demographics
- Census place
- Attica, OH
- County
- Seneca · 70,739 people
- Population (ZIP)
- 2,118
- Household income
- $76,302
- Rent vs Own
- Severe rent burden
- 2.1
Population outlook (Seneca County) Hauer SSP2
- Today (2025)
- 54,243 people
- By 2030
- 52,947 · -2.4%
- By 2040
- 49,842 · -8.1%
- By 2050
- 46,689 · -13.9%
- By 2075
- 39,889 · -26.5%
- By 2100
- 32,155 · -40.7%
Race, ethnicity, and origin ACS 2023
- Neighborhood character
- Predominantly White (93%)
- Race & ethnicity
- White 93% Two or more races 5% Hispanic / Latino 2%
- Common ancestry
- Italian 1% English 1% Lithuanian 1%
- Foreign-born
- 1%
- Languages at home
- 98% English-only · Spanish 1% Other Asian/Pacific 1%
Political lean MEDSL · Seneca
- 2024 margin
- Solid R (+37.5) · D 30.7% · R 68.2% · Other 1.0%
- 2008→2024 swing
- -34.8pp toward R · 2008: -2.7pp · 2024: -37.5pp
- All cycles
- 2024: R+37.5 2020: R+34.2 2016: R+31.2 2012: R+8.4 2008: R+2.7
Not yet ingested
- Civics
- —
Market trends
- HPI YoY
- ▲ 10.29%
- Current HPI
- 203.7731
- Rent YoY
- —
- Metro
- —
- State GDP YoY
- ▲ 1.98%
- F500 in state
- 48
Industry mix (Fortune 500 HQ in OH)
| Industry | F500 HQs | Revenue |
|---|---|---|
| Insurance | 3 | $145B |
|
||
| Industrial Machinery | 3 | $49B |
|
||
| Financial Services | 3 | $24B |
|
||
| Consumer Goods | 2 | $93B |
|
||
| Aerospace / Defense | 2 | $47B |
|
||
| Utilities | 2 | $33B |
|
||
Price history
+100.1% since first listed3 events — show timeline
- 2026-04-27 Listed $139,900 FAOR
- 2015-08-28 Sold (MLS) $54,500 FAOR
- 2015-02-03 Listed $69,900 FAOR
Property tax history
-0.1%/yrLatest (2025): $1,631 · -0.2% YoY. Source: county tax records.
Cash-flow waterfall
monthlySold comps — $/sqft
last 12 mo · ≤1 miLoading sold comps…