 🏗️ New Construction
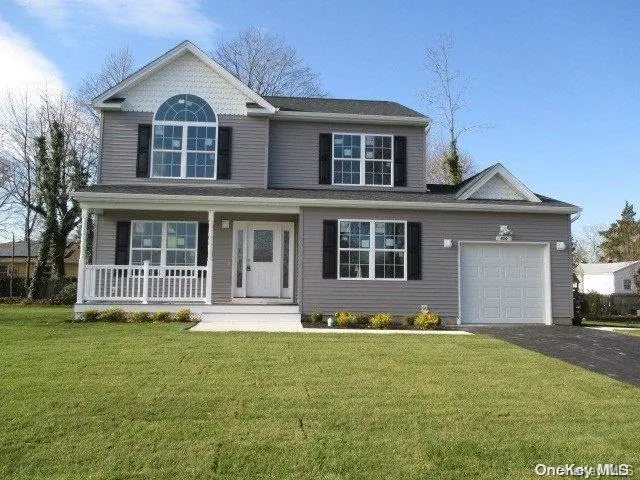
Lot (2135) Macdonald Ave · North Bellport, NY
Flood risk No data
- FEMA flood zone
- —
- Chance of flooding over 30 yrs
- —
- Est. flood insurance / yr
- —
Fire risk No data
- Est. fire insurance / yr
- —
Heat risk No data
- Hot days now (above threshold)
- —
- Hot days in 30 yrs
- —
Wind risk No data
- Chance of severe wind over 30 yrs
- —
Air-quality risk No data
- Unhealthy air days now
- —
- Unhealthy air days in 30 yrs
- —
Risk factors via First Street. Map © Google.
Why this score? — see what drove the B grade
The composite is a weighted blend of 9 inputs, each scored 0–100. Each bar is that input's sub-score; the figure is the points it added to the 100-point composite (weight × sub-score).
- Cash flow +30.0/30.0
- 1% rule +10.0/10.0
- DSCR +10.0/10.0
- ARV discount +7.5/15.0
- Schools +4.5/10.0
- Livability +3.1/5.0
- Rent growth +2.5/5.0
- Condition / age +2.5/5.0
- Appreciation +0.0/10.0
$499,000
🖨 Deal sheet 📄 Offer letter ✓ Due diligence
Listing remarks
Bellport New The Bentley 4 to be built. Quality Craftsmanship 4 BR 2.5 baths 2 story with front porch, choice of kitchen cabinets, quartz countertops, wood floors on 1st floor carpet in BRs, tiled baths, CAC, 200 amp service, full basement w/ OSE, attached 1 car garage, appliance credit. , Additional information: Appearance:New
Key facts
- 7,405 sq ft lot
- Built 2023
- Listed 192 days
Neighborhood map
What this means for you Summary
Snapshot
- This is a 4-bed/2.5-bath single-family listed at $499k.
Deal economics
- At list price, monthly cash flow is $5k ($61k/yr) — positive.
- The deal already cash-flows at list — no discount required.
- Meets the 1% rule at list price ($11k rent vs $499k).
- Recommended offer: $439k (12.0% below list) — sets the bar for market timing.
- Cap rate 17.7% vs local median 4.9% in North Bellport — top-decile yield for the area; either an underpriced asset or a hidden risk that comps aren't pricing in. Stress-test before assuming the spread holds.
Location & tenants
- Location reads 62/100 on livability (#842 in NY) — a middle-class / working-renter tenant base. Strengths: employment A+, housing A+; Watch: crime C-, amenities F, commute F.
- South Country Central School District (suburban): math 50% / reading 44% proficiency, ranked #460 of 755 in NY (top 61%) — families likely to look elsewhere, expect single-tenant / working-renter base with shorter leases.
- Zoned schools: Frank P Long Intermediate School (math 10% / reading 50%, grade F, #1,702 of 2,108 statewide, top 82%, 576 students, 58% FRL); Bellport Middle School (math 64% / reading 54%, grade B, #161 of 729 statewide, top 24%, 838 students, 56% FRL); Bellport Senior High School (math 86% / reading 64%, grade A-, #630 of 1,100 statewide, top 57%, 1,392 students, 52% FRL).
- Market conditions: 57 active listings in the ZIP; 3 comparable units currently listed for rent nearby; rentals leasing fast (median 14d on market — plan ~1-2 weeks tenant-placement turnaround); 1,366 units permitted in Suffolk County in 2024 (216 in 5+ unit buildings).
Forward outlook
- Local home prices are declining (-3.0%/yr); year-one equity from $4k of loan paydown is wiped out by about $16k of value loss. Plan a longer hold.
- Suffolk County population projected to shrink 5% by 2050 — rents likely to lag national; underwrite the cash flow, not the appreciation.
- At projected returns (-3.0% appreciation + 3.0% rent growth), your $150k cash investment doubles in ~3 years — after that, you're playing with house money.
Negotiation context
- It's been on market 192 days — a 12% lower offer ($439k) is reasonable based on typical stale-listing flexibility.
Questions for the listing agent
- It's been on market 192 days. Have you received any prior offers? Is the seller open to a 12% concession, seller financing, or rate buy-down credit?
- Why hasn't it sold? Are there any deal-killer items the seller is aware of (foundation, flood, title, zoning, code violations)?
- Is there a deadline driving the sale (1031 exchange, divorce, estate, relocation)? That informs how much negotiation room exists.
- Schools are F-rated, which usually means shorter tenancies and higher turnover. Who's the typical renter profile here, and what's been the actual vacancy rate?
- What's the average days-on-market for RENTAL listings here right now (not sales)? A rising rental-DOM trend means longer vacancies and softer asking-rent achievability than the comps imply.
- What's the recent tenant-quality profile in this submarket — average credit score on applications, eviction rate, late-payment / NSF rate, and stable-employment percentage? A property-management company in the area should have these aggregated.
- How much new for-sale + rental construction is in the pipeline within 1–3 miles? Heavy new supply typically softens prices + rents 12–24 months out; constrained supply supports both.
Investment metrics
- 1% rule
- 2.08% ✓
- Cap rate
- 17.71%
- Cash-on-cash
- 40.77%
- DSCR
- 2.81
- GRM
- 4.0
CMA / ARV
- ARV (on-the-fly)
- $536,190
- Comps found
- 12
Show comp detail 12 sales within ~0.75 mi
| Address | Dist | Beds/Ba | Sqft | Sold | Price | $/sf | Match |
|---|---|---|---|---|---|---|---|
| 655 Bourdois Ave | 0.15mi | 4/2.5 | 1,758 (0%) | 2mo | $499,000 | $284 | 91 |
| 641 (2122) Bourdois Ave | 0.05mi | 4/2.5 | 1,758 (0%) | 10mo | $550,000 | $313 | 90 |
| 661 Bourdois Ave | 0.16mi | 4/2.5 | 1,758 (0%) | 8mo | $499,990 | $284 | 86 |
| 522 Scherger Ave | 0.24mi | 4/2.5 | 1,756 (-0%) | 5mo | $550,000 | $313 | 85 |
| 441 Macdonald Ave | 0.18mi | 4/2.0 | 1,854 (+6%) | 5mo | $565,000 | $305 | 76 |
| 333 Atlantic Ave | 0.15mi | 5/2.0 (+1) | 1,913 (+9%) | 9mo | $475,000 | $248 | 64 |
| 6 Danamarie Ln | 0.62mi | 3/2.5 (-1) | 1,765 (+0%) | 8mo | $796,000 | $451 | 59 |
| 4 Danamarie Ln | 0.62mi | 3/1.5 (-1) | 1,722 (-2%) | 1mo | $770,000 | $447 | 58 |
| 35 Maple Ave | 0.71mi | 3/2.5 (-1) | 1,800 (+2%) | 3mo | $514,000 | $286 | 56 |
| 805 Doane Ave | 0.47mi | 3/2.0 (-1) | 1,584 (-10%) | 3mo | $405,000 | $256 | 52 |
| 360 Munsell Rd | 0.67mi | 5/2.0 (+1) | 1,901 (+8%) | 8mo | $570,000 | $300 | 41 |
| 914 Doane Ave | 0.65mi | 3/3.5 (-1) | 2,000 (+14%) | 9mo | $660,000 | $330 | 30 |
Match score weights: distance 35% · size 25% · config 20% · recency 20%. Top-matched comps best support the ARV.
Projected returns pro-forma
-3.0% appreciation · 3.0% rent growth · sell at horizon
- IRR
- 37.3%
- Equity multiple
- 2.59×
- Total profit
- $238,142
- Equity at exit
- $79,948
- IRR
- 43.9%
- Equity multiple
- 5.17×
- Total profit
- $626,363
- Equity at exit
- $46,360
Cash invested: $150,133 (down + closing). Projections, not guarantees.
Landlord ↔ Tenant lean methodology
- Overall (STATE)
- 15 Strongly Tenant-Friendly
- State New York
- 15 Strongly Tenant-Friendly · D+10
- County
- — inherits STATE
- City
- — inherits STATE
ZIP-level market 11713
- Home prices YoY
- -26.0%
- Active inventory
- 57
- Price-to-rent
- 3.7×
Monthly cashflow live
- Estimated rent
- $11,147 medium interval (Pro) →
- Mortgage (P&I)
- −$2,812
- Tax est. 1.5%
- −$670 /mo · $8,043/yr
- Insurance
- −$223
- HOA
- −$0
- Vacancy / Maint / Mgmt
- −$2,341
- Net cashflow
- $5,101
Break-even live
UW: 25.0% down · 7.5% · 30yr · 1.5% tax · 5.0% vac · 8.0% maint · 8.0% mgmt
Financing live
Cash to close
- Down payment
- $134,048
- Closing costs
- $16,086
- Reserves months
- —
- Total cash needed
- —
Loan-product check · same deal, 3 products live
Conventional
25% down · 7.5% · 30yr
- Down + closing
- —
- Monthly P&I
- —
- Monthly cashflow
- —
- DSCR
- —
- Eligible?
- —
Personal DTI + credit; lowest rate.
DSCR
20% down · 8.5% · 30yr
- Down + closing
- —
- Monthly P&I
- —
- Monthly cashflow
- —
- DSCR
- —
- Eligible?
- —
No personal income docs; deal must DSCR.
Hard money
10% down · 12.0% · 12mo
- Down + closing
- —
- Monthly P&I
- —
- Monthly cashflow
- —
- DSCR
- —
- Eligible?
- —
Short-term bridge; refi at stabilization.
Rent comps 3 comps
| Address | Beds | Baths | Sqft | Rent | $/sqft | DOM | Units | Dist |
|---|---|---|---|---|---|---|---|---|
| 262 N Dunton Ave East Patchogue, NY | 3.0 | 1.0 | 1778 | $3,900 | $2.19 | 13d | 1 | 0.95mi |
| 58 N Howells Point Rd Bellport, NY | 3.0 | 2.0 | 1404 | $15,000 | $10.68 | 19d | 1 | 1.20mi |
| 21 N Howells Point Rd Bellport, NY | 3.0 | 3.5 | 2148 | $20,000 | $9.31 | 1d | 1 | 1.45mi |
Listing history 2 events
-
2024-03-07status Pending
-
2023-08-28$499,000 Active
ⓘ Source: listings_history table (triggers on properties + properties_extension) + one-shot
backfill from property_details.listing_events for pre-trigger history.
Nearby sold comps map
Loading sold comps map…
Walkable amenities ~0.75 mi
Loading nearby amenities…
Taxation est. · year 1
- Rental income
- $133,763
- − Mortgage interest
- −$30,035
- − Property taxes
- −$8,043
- − Insurance
- −$2,681
- − Repairs & maintenance
- −$10,701
- − Management
- −$10,701
- − Depreciation
- −$15,598
- Taxable income
- $56,004
- Est. tax owed @ 24.0%
- −$13,441
- After-tax cash flow
- $47,766/yr
For passive investors: Depreciation is non-cash, so a rental often shows a tax loss while cash-flowing — sheltering income. Rental losses are passive: they offset passive income freely, and up to $25,000/yr can offset ordinary (W-2) income if you actively participate and your MAGI is under $100k (phasing out to $0 by $150k); unused losses carry forward. On sale, claimed depreciation is recaptured at up to 25%, and gains may owe capital-gains tax (a 1031 exchange can defer both). Figures are a year-1 estimate at your 24.0% rate — not tax advice; consult a CPA.
Schools (NCES district)
- District
- South Country Central School District
- NCES district ID
- 3600008
- Math proficiency
- 50% ▲ 4.00%
- Reading proficiency
- 44% ▲ 4.00%
- Median HH income
- $74,049
- Composite
- 44.75/100
- National rank
- #5960
- State rank
- #460 of 755 in NY
Livability — North Bellport
- Score
- 62/100
- State rank
- #842
- US rank
- #16345
Category grades
Schools grade is shown separately in the Schools card above.
Census & demographics
- Census place
- North Bellport, NY
- City population
- 9,236
- Population (ZIP)
- 9,236
Population outlook (Suffolk County) Hauer SSP2
- Today (2025)
- 1,505,262 people
- By 2030
- 1,498,318 · -0.5%
- By 2040
- 1,471,101 · -2.3%
- By 2050
- 1,424,848 · -5.3%
- By 2075
- 1,337,157 · -11.2%
- By 2100
- 1,217,720 · -19.1%
Race, ethnicity, and origin ACS 2023
- Neighborhood character
- Diverse neighborhood (Simpson 0.64)
- Race & ethnicity
- White 50% Hispanic / Latino 30% Black 14% Two or more races 10% Asian 2%
- Hispanic origin (detail)
- Mexican 2% Puerto Rican 3% Dominican 1%
- Common ancestry
- Romanian 4% Italian 1% Lithuanian 1%
- Foreign-born
- 23% · Canada, Jamaica, China
- Languages at home
- 72% English-only · Spanish 23% Other Indo-European 3%
Political lean MEDSL · Suffolk
- 2024 margin
- Lean R (+10.0) · D 45.0% · R 55.0%
- 2008→2024 swing
- -16.0pp toward R · 2008: 6.0pp · 2024: -10.0pp
- All cycles
- 2024: R+10.0 2020: R+0.0 2016: R+8.2 2012: D+2.9 2008: D+6.0
Not yet ingested
- Civics
- —
Market trends
- HPI YoY
- ▼ -148.23%
- Current HPI
- 421.2165
- Rent YoY
- —
- Metro
- —
- State GDP YoY
- ▲ 2.60%
- F500 in state
- 92
Industry mix (Fortune 500 HQ in NY)
| Industry | F500 HQs | Revenue |
|---|---|---|
| Financial Services | 10 | $950B |
|
||
| Consumer Goods | 9 | $162B |
|
||
| Insurance | 4 | $225B |
|
||
| Telecommunications | 2 | $144B |
|
||
| Pharmaceuticals | 2 | $112B |
|
||
| Media / Entertainment | 2 | $69B |
|
||
Price history
2 events — show timeline
- 2024-03-07 Pending — OneKey® MLS as Distributed by MLS Grid
- 2023-08-28 Listed $499,000 OneKey® MLS as Distributed by MLS Grid
Cash-flow waterfall
monthlySold comps — $/sqft
last 12 mo · ≤1 miLoading sold comps…